
Candlestick patterns are one of the most powerful tools in technical analysis, helping traders understand market psychology and predict potential price movements.
Whether you trade forex, stocks, or cryptocurrencies, learning how to read candlestick patterns can significantly improve your entry and exit decisions.
This candlestick patterns cheat sheet covers the most important bullish, bearish, and continuation patterns, explained in a simple and practical way.
By mastering these patterns, you will be able to identify high-probability trading opportunities, avoid common mistakes, and trade with more confidence in any market condition.
Candlestick Patterns Cheat Sheet: Simple Visual Guide for Traders

Candlestick Patterns Explained: How to Read Each Pattern Step by Step
Understanding candlestick patterns is essential if you want to read the market with confidence and precision.
Each pattern reflects the ongoing battle between buyers and sellers, revealing shifts in momentum and potential turning points.
In the sections below, you’ll discover the most important candlestick patterns, grouped by their function, so you can quickly identify high-probability setups and apply them effectively in your trading.
Bullish Reversal Candlestick Patterns
Bullish reversal candlestick patterns signal a potential shift from a downtrend to an uptrend, indicating that buyers are starting to take control of the market.
These patterns typically form after a decline and often appear at key support levels where selling pressure weakens and demand begins to rise.
By learning to recognize these setups, you can identify early entry opportunities and position yourself alongside smart money before the next upward move begins.
Bullish Engulfing Candlestick Pattern

The Bullish Engulfing candlestick pattern is a strong bullish reversal signal that occurs when a large green candle completely overtakes the previous red candle, indicating that buyers have gained control over sellers.
It typically forms after a downtrend or a pullback and suggests a potential shift in momentum to the upside.
Traders use this pattern to identify high-probability buying opportunities, especially when it appears at key support levels, demand zones, or during a retracement within an uptrend.
The bullish engulfing candlestick pattern is one of the most powerful reversal signals in trading. If you want to fully understand how it works, including real examples and confirmation techniques, check out this complete guide: Bullish Engulfing Candlestick Pattern: The Complete Guide for Traders.
Hammer Candlestick Pattern

The Hammer candlestick pattern is a bullish reversal signal that forms after a downtrend and indicates that selling pressure is weakening.
It is characterized by a small body at the top and a long lower wick, showing that sellers pushed the price down but buyers regained control before the candle closed.
This shift in momentum suggests a potential move to the upside. Traders often use the Hammer pattern to identify buying opportunities, especially when it appears at key support levels, demand zones, or after a strong pullback.
We covered the Hammer Candlestick Pattern in detail in this guide. Feel free to check it out to learn how traders use this bullish reversal candlestick pattern in real market conditions.
Inverted Hammer Candlestick Pattern
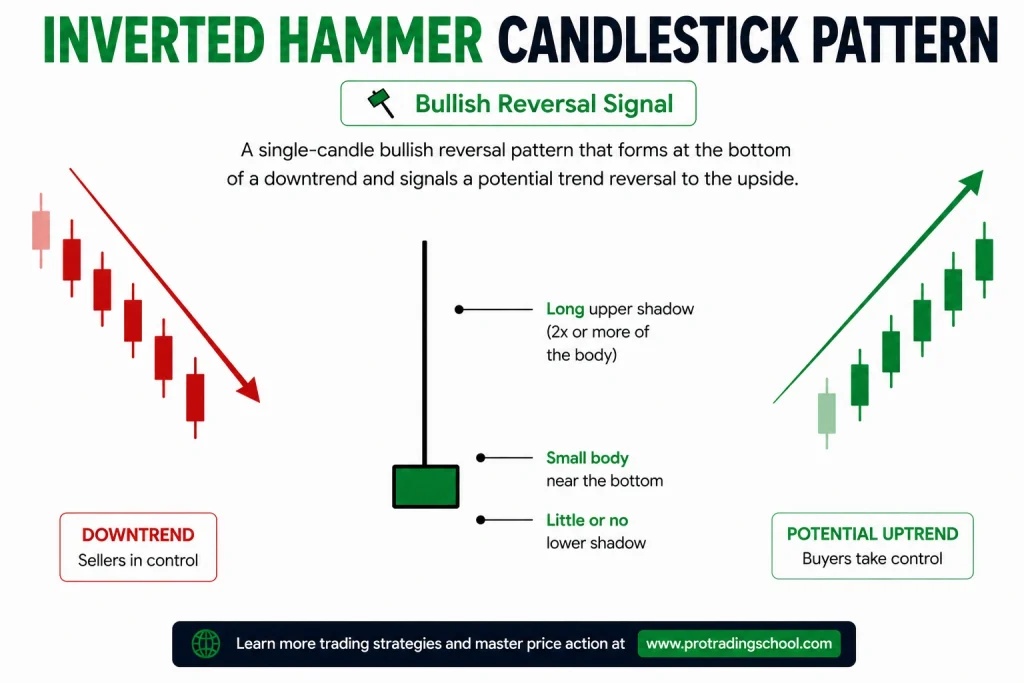
The Inverted Hammer candlestick pattern is a bullish reversal signal that forms after a downtrend and indicates a potential shift in momentum from sellers to buyers.
It is characterized by a small body at the bottom and a long upper wick, showing that buyers attempted to push the price higher despite selling pressure.
Although the candle closes near its opening level, the strong rejection of higher prices suggests that buying interest is increasing.
Traders often look for confirmation after the Inverted Hammer, especially when it appears at key support levels or demand zones.
Learn how to trade the inverted hammer candlestick pattern using support and resistance levels, liquidity sweeps, and smart money confirmation techniques.
Morning Star Candlestick Pattern
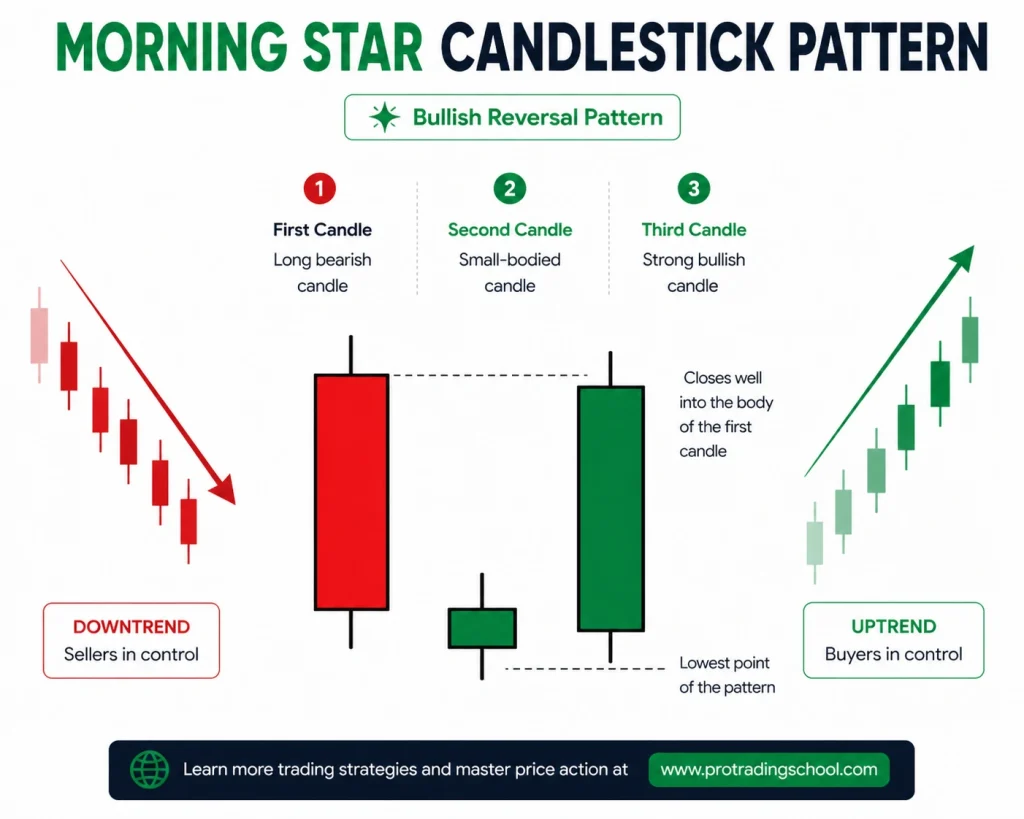
The Morning Star candlestick pattern is a powerful bullish reversal signal that forms after a downtrend and indicates a potential shift from selling pressure to buying momentum.
It consists of three candles: a strong bearish candle, followed by a small indecision candle, and then a strong bullish candle that confirms the reversal.
This pattern shows that sellers are losing control while buyers are stepping in. Traders use the Morning Star to identify high-probability buying opportunities, especially when it appears at key support levels or demand zones.
Want to learn more about this pattern? Read our complete Morning Star Candlestick Pattern: 3 Powerful Trading Strategies guide for chart examples, trading strategies, and practical tips.
Piercing Candlestick Pattern

The Piercing candlestick pattern is a bullish reversal signal that forms after a downtrend and indicates that buyers are starting to regain control.
It consists of two candles: a strong bearish candle followed by a bullish candle that opens lower and closes above the midpoint of the previous candle.
This price action shows a shift in momentum from sellers to buyers. Traders use the Piercing pattern to identify potential buying opportunities, especially when it appears at key support levels or during a pullback in an uptrend.
Three White Soldiers Candlestick Pattern
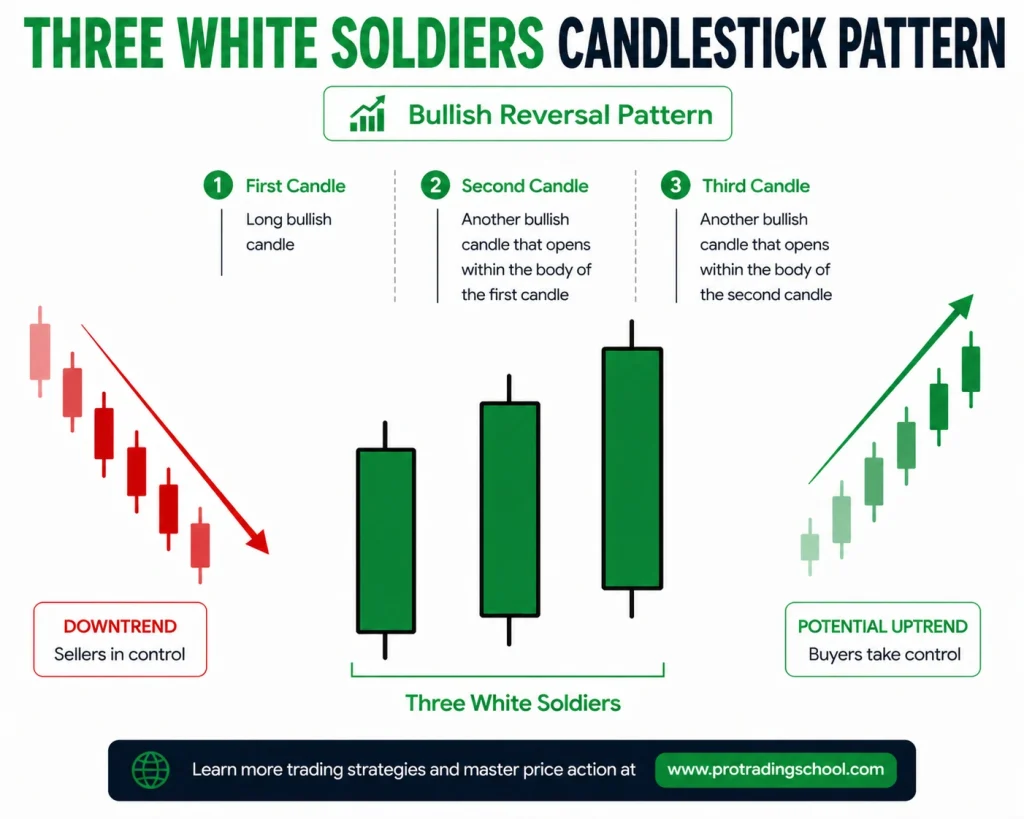
The Three White Soldiers candlestick pattern is a strong bullish reversal signal that appears after a downtrend and indicates that buyers have taken full control of the market.
It consists of three consecutive bullish candles with higher closes, showing sustained buying pressure and a clear shift in momentum.
This pattern reflects strong confidence from buyers and often marks the beginning of a new uptrend.
Traders use the Three White Soldiers pattern to identify high-probability buying opportunities, especially when it forms near key support levels or after a prolonged decline.
Want to learn more about the Three White Soldiers pattern? Check out our detailed guide on the Three White Soldiers Candlestick Pattern, where you’ll learn its meaning, psychology, trading strategies, and real chart examples.
Bullish Harami Candlestick Pattern

The Bullish Harami candlestick pattern is a bullish reversal signal that forms after a downtrend and indicates that selling pressure is weakening.
It consists of two candles: a large bearish candle followed by a smaller bullish candle that is completely contained within the body of the previous candle.
This structure shows a pause in momentum and suggests that buyers may be preparing to take control.
Traders use the Bullish Harami pattern to spot potential buying opportunities, especially when it appears at key support levels or during a pullback in an uptrend.
Learn how to trade the Bullish Harami Candlestick Pattern with proven strategies, real chart examples, and step-by-step entry rules.
Tweezer Bottom Candlestick Pattern

The Tweezer Bottom candlestick pattern is a bullish reversal signal that forms after a downtrend and indicates strong support at a specific price level.
It consists of two consecutive candles with equal or very similar lows, showing that sellers failed to push the price lower twice.
This repeated rejection of lower prices suggests that buyers are stepping in and gaining control.
Traders use the Tweezer Bottom pattern to identify potential buying opportunities, especially when it appears at key support levels or demand zones.
Want to learn how to trade this setup? Read our complete guide on the Tweezer Bottom Candlestick Pattern.
Bullish Kicker Candlestick Pattern

The Bullish Kicker candlestick pattern is a powerful bullish reversal signal that forms after a downtrend and indicates a sudden and strong shift in market sentiment.
It consists of a bearish candle followed by a bullish candle that opens significantly higher, creating a clear gap between the two candles.
This gap reflects aggressive buying pressure and a complete takeover by buyers. Traders use the Bullish Kicker pattern to identify high-probability buying opportunities, especially when it appears after a strong sell-off or near key support levels.
Ladder Bottom Candlestick Pattern
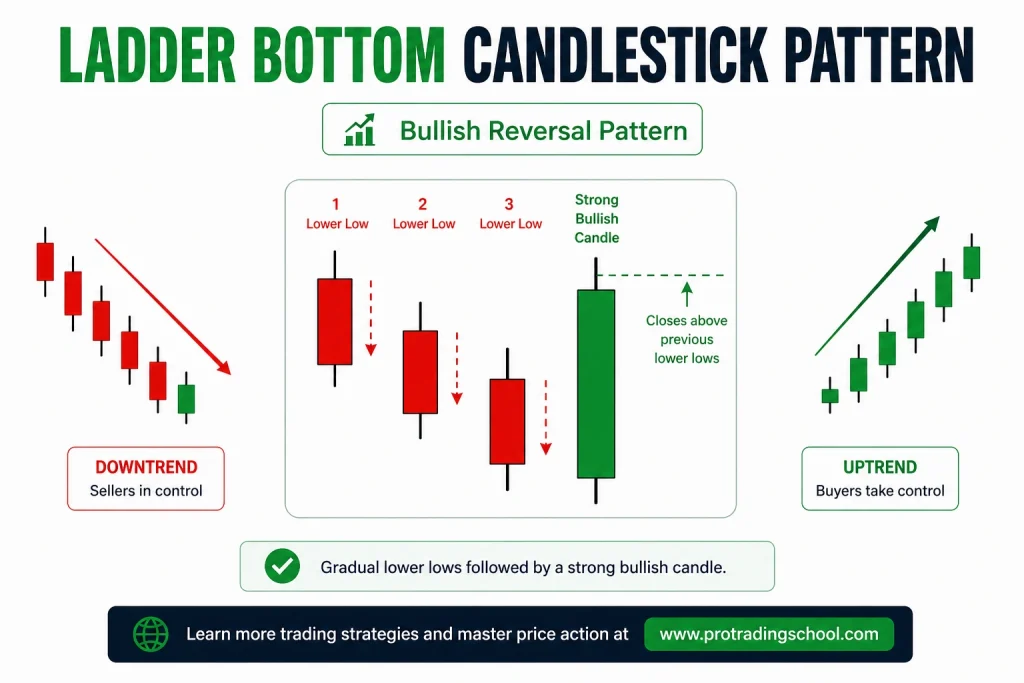
The Ladder Bottom candlestick pattern is a bullish reversal signal that forms after a downtrend and indicates that selling pressure is gradually weakening.
It consists of a sequence of bearish candles followed by a small indecision candle and then a strong bullish candle that confirms the reversal.
This structure shows that sellers are losing control step by step while buyers begin to take over.
Traders use the Ladder Bottom pattern to identify potential buying opportunities, especially when it appears near key support levels or after a prolonged decline.
Bearish Reversal Candlestick Patterns
Bearish reversal candlestick patterns signal a potential shift from an uptrend to a downtrend, indicating that sellers are beginning to take control of the market.
These patterns usually form after a price rally and often appear at key resistance levels where buying pressure starts to fade and supply increases.
By recognizing these signals, you can anticipate potential market tops and align your trades with smart money as they begin to distribute positions before a downward move.
Bearish Engulfing Candlestick Pattern
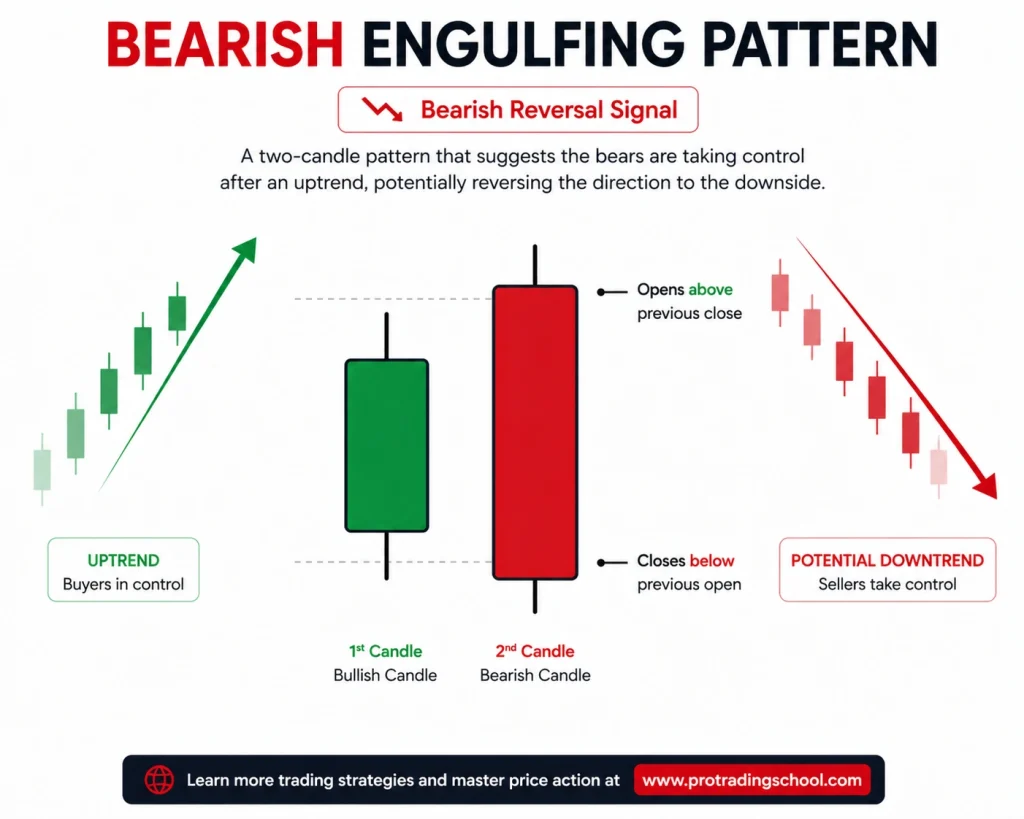
The Bearish Engulfing candlestick pattern is a strong bearish reversal signal that forms after an uptrend and indicates that sellers have taken control of the market.
It occurs when a large red candle completely overtakes the previous green candle, showing a shift in momentum from buyers to sellers.
This pattern reflects increasing selling pressure and often signals the beginning of a downward move.
Traders use the Bearish Engulfing pattern to identify potential selling opportunities, especially when it appears at key resistance levels, supply zones, or after a strong upward move.
The bearish engulfing candlestick pattern is a powerful signal that sellers are taking control after an uptrend. To learn how to trade this pattern with real chart examples and confirmation strategies, read this complete guide: Bearish Engulfing Candlestick Pattern: Strategy & Examples.
Shooting Star Candlestick Pattern
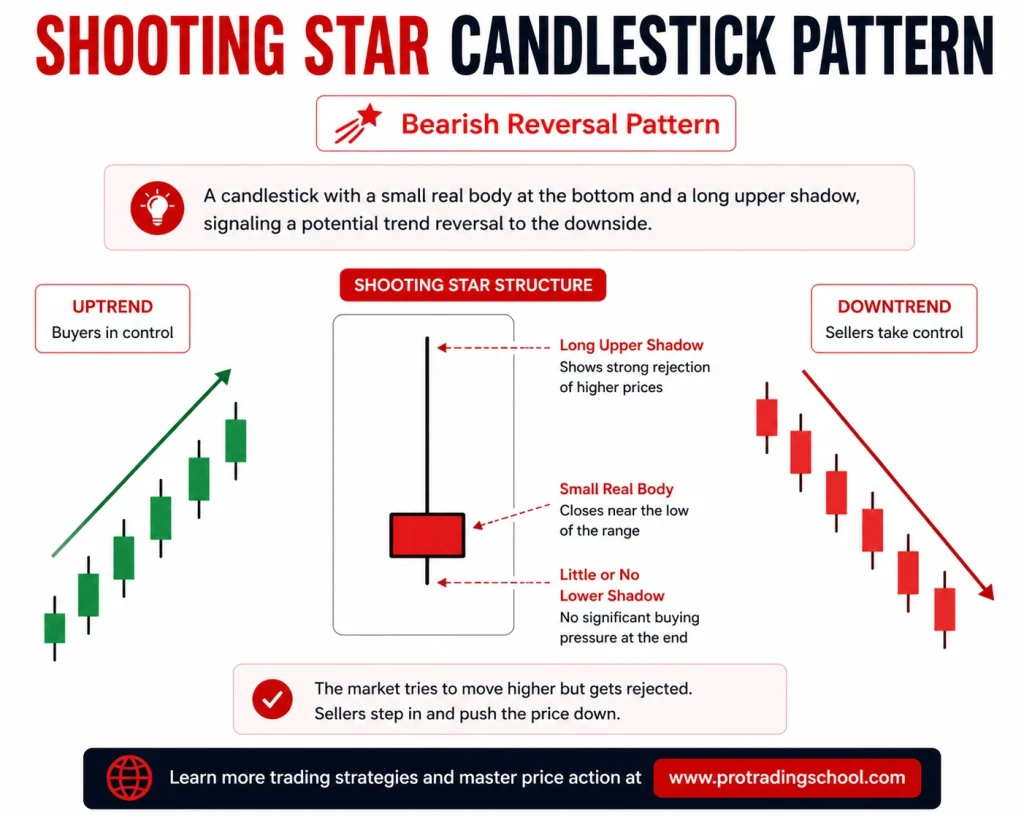
The Shooting Star candlestick pattern is a bearish reversal signal that forms after an uptrend and indicates that buying pressure is weakening.
It is characterized by a small body at the bottom and a long upper wick, showing that buyers pushed the price higher but sellers regained control before the candle closed.
This rejection of higher prices suggests a potential shift in momentum to the downside. Traders use the Shooting Star pattern to identify selling opportunities, especially when it appears at key resistance levels, supply zones, or after a strong upward move.
The shooting star candlestick pattern often appears at key resistance levels and signals that buyers are losing control as sellers step in. If you want to master this setup with real examples and proven strategies, check out our complete guide: Shooting Star Candlestick Pattern: How to Identify and Trade It (Complete Guide).
Hanging Man Candlestick Pattern

The Hanging Man candlestick pattern is a bearish reversal signal that forms after an uptrend and indicates that selling pressure is starting to increase.
It is characterized by a small body at the top and a long lower wick, showing that sellers pushed the price down during the session before buyers partially recovered.
This rejection of lower prices highlights growing weakness in the uptrend and a potential shift in momentum to the downside.
Traders use the Hanging Man pattern to identify selling opportunities, especially when it appears at key resistance levels or supply zones.
Learn how to trade the hanging man candlestick pattern with support and resistance levels, volume confirmation, and smart money concepts.
Evening Star Candlestick Pattern

The Evening Star candlestick pattern is a powerful bearish reversal signal that forms after an uptrend and indicates a shift from buying momentum to selling pressure.
It consists of three candles: a strong bullish candle, followed by a small indecision candle, and then a strong bearish candle that confirms the reversal.
This pattern shows that buyers are losing control while sellers are stepping in. Traders use the Evening Star to identify high-probability selling opportunities, especially when it appears at key resistance levels or supply zones.
The Evening Star candlestick pattern is a powerful bearish reversal formation that often appears at the top of an uptrend. If you want to learn how to trade it with confirmation techniques, indicators, chart examples, and smart money concepts, check out this complete guide to the Evening Star candlestick pattern.
Dark Cloud Cover Candlestick Pattern

The Dark Cloud Cover candlestick pattern is a bearish reversal signal that forms after an uptrend and indicates that selling pressure is starting to overcome buying momentum.
It consists of two candles: a strong bullish candle followed by a bearish candle that opens higher and closes below the midpoint of the previous candle.
This price action shows a clear rejection of higher prices and a shift in control from buyers to sellers. Traders use the Dark Cloud Cover pattern to identify potential selling opportunities, especially when it appears at key resistance levels or supply zones
We have covered the Dark Cloud Cover candlestick pattern in detail in this blog post: Dark Cloud Cover Candlestick Pattern Trading Guide. Feel free to check it out to learn how to trade this bearish reversal setup using support and resistance, supply zones, pullbacks, and other confirmation techniques.
Three Black Crows Candlestick Pattern
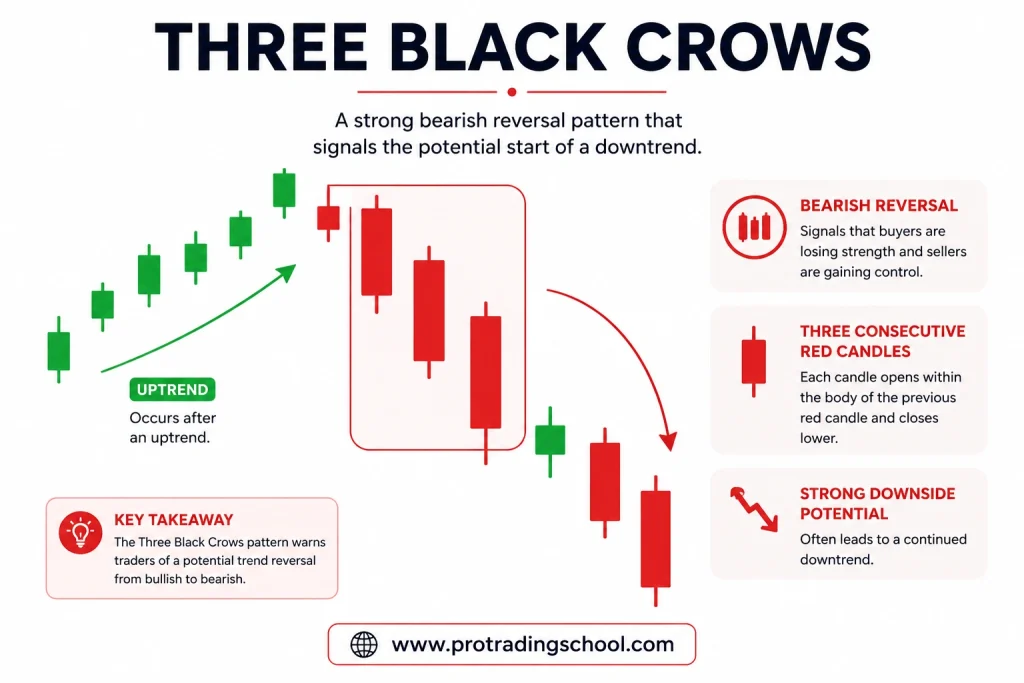
The Three Black Crows candlestick pattern is a strong bearish reversal signal that forms after an uptrend and indicates that sellers have taken full control of the market.
It consists of three consecutive bearish candles with lower closes, showing sustained selling pressure and a clear shift in momentum from buyers to sellers.
This pattern reflects growing confidence from sellers and often marks the beginning of a downtrend.
Traders use the Three Black Crows pattern to identify high-probability selling opportunities, especially when it appears near key resistance levels or after a prolonged upward move.
Bearish Harami Candlestick Pattern

The Bearish Harami candlestick pattern is a bearish reversal signal that forms after an uptrend and indicates that buying pressure is weakening.
It consists of two candles: a large bullish candle followed by a smaller bearish candle that is completely contained within the body of the previous candle.
This structure shows a pause in momentum and suggests that sellers may be starting to take control. Traders use the Bearish Harami pattern to identify potential selling opportunities, especially when it appears at key resistance levels or supply zones.
Tweezer Top Candlestick Pattern

The Tweezer Top candlestick pattern is a bearish reversal signal that forms after an uptrend and indicates strong resistance at a specific price level.
It consists of two consecutive candles with equal or very similar highs, showing that buyers failed to push the price higher twice.
This repeated rejection of higher prices suggests that sellers are stepping in and gaining control.
Traders use the Tweezer Top pattern to identify potential selling opportunities, especially when it appears at key resistance levels or supply zones.
Bearish Kicker Candlestick Pattern

The Bearish Kicker candlestick pattern is a powerful bearish reversal signal that forms after an uptrend and indicates a sudden and strong shift in market sentiment.
It consists of a bullish candle followed by a bearish candle that opens significantly lower, creating a clear gap between the two candles.
This gap reflects aggressive selling pressure and a complete takeover by sellers. Traders use the Bearish Kicker pattern to identify high-probability selling opportunities, especially when it appears after a strong rally or near key resistance levels.
Ladder Top Candlestick Pattern

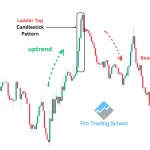
The Ladder Top candlestick pattern is a bearish reversal signal that forms after an uptrend and indicates that buying momentum is gradually weakening.
It consists of a sequence of bullish candles followed by a small indecision candle and then a strong bearish candle that confirms the reversal.
This structure shows that buyers are losing control step by step while sellers begin to take over.
Traders use the Ladder Top pattern to identify potential selling opportunities, especially when it appears near key resistance levels or after a strong upward move.
Want to learn how to trade another powerful bearish reversal pattern? Read our Ladder Top Candlestick Pattern: Trading Guide for Beginners to discover how to identify the pattern, understand its psychology, and trade it using resistance levels, supply zones, and trendlines.
Neutral Candlestick Patterns
Neutral candlestick patterns reflect a state of indecision in the market, where neither buyers nor sellers have clear control.
These patterns often appear during consolidation phases or at key levels, signaling a pause before the next move.
While they don’t indicate a direction on their own, they provide valuable insight into market sentiment and can act as early warning signs of a potential breakout when combined with context and confirmation.
Doji Candlestick Pattern (All Variations)

The Doji candlestick pattern is a neutral signal that indicates indecision in the market and a balance between buyers and sellers.
It forms when the opening and closing prices are nearly equal, creating a small or non-existent body with visible wicks.
There are several Doji variations, including the standard Doji, long-legged Doji, dragonfly Doji, and gravestone Doji, each reflecting different types of market indecision and potential reversal signals.
Traders use Doji patterns to identify possible turning points or pauses in the market, especially when they appear at key support or resistance levels.
Read this complete guide to the Doji candlestick pattern to understand its psychology, types, and trading strategies.
Spinning Top Candlestick Pattern
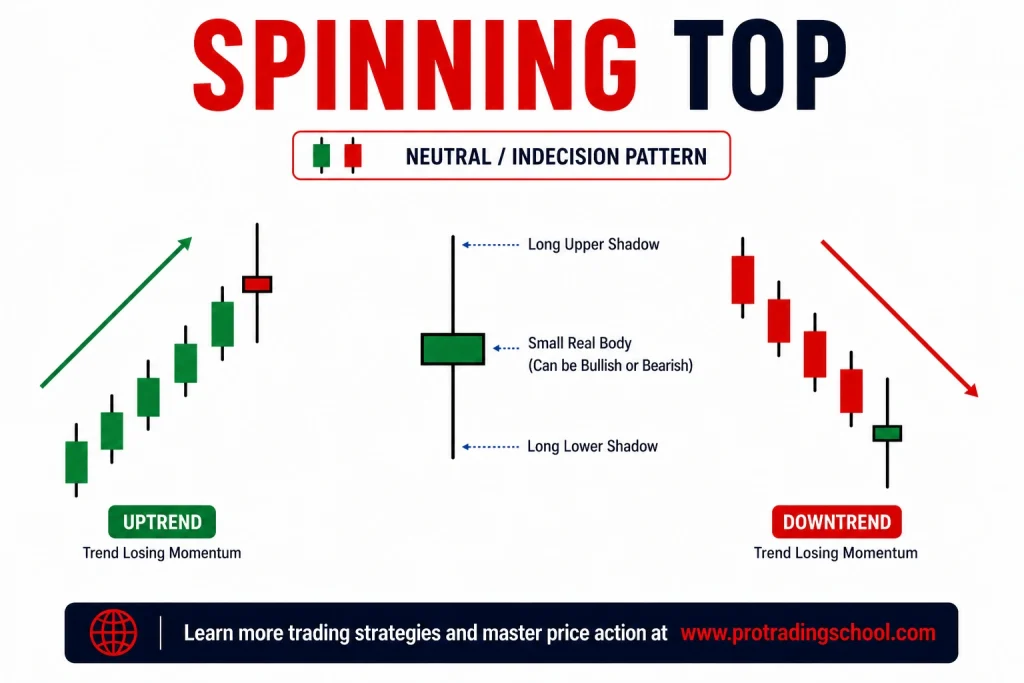
The Spinning Top candlestick pattern is a neutral signal that indicates indecision in the market and a balance between buyers and sellers.
It is characterized by a small body with both upper and lower wicks, showing that price moved in both directions before closing near its opening level.
This price action reflects hesitation and a potential slowdown in momentum. Traders use the Spinning Top pattern to identify possible reversals or continuation signals, especially when it appears at key support or resistance levels.
High Wave Candlestick Pattern

The High Wave candlestick pattern is a strong indecision signal that indicates extreme volatility and uncertainty in the market.
It is characterized by a small body with very long upper and lower wicks, showing that both buyers and sellers pushed the price aggressively in both directions before closing near the opening level.
This price action reflects a lack of clear control and often appears near potential turning points or during periods of market hesitation.
Traders use the High Wave pattern as a warning signal to avoid impulsive trades and wait for confirmation, especially when it forms at key support or resistance levels.
Continuation Candlestick Patterns
Continuation candlestick patterns indicate that the current trend is likely to continue after a brief pause or consolidation.
These patterns typically form during temporary pullbacks, where the market gathers momentum before resuming its original direction.
By identifying continuation setups, you can avoid exiting trades too early and instead align yourself with the prevailing trend, following smart money as it reinforces its positions for the next move.
Rising Three Methods Candlestick Pattern

The Rising Three Methods candlestick pattern is a bullish continuation signal that forms during an uptrend and indicates that the market is pausing before continuing higher.
It consists of a strong bullish candle, followed by a series of small bearish candles that stay within the range of the first candle, and then a final strong bullish candle that confirms the continuation.
This structure shows that sellers are unable to take control during the pullback, while buyers remain dominant.
Traders use the Rising Three Methods pattern to identify high-probability buying opportunities, especially during retracements in a strong uptrend.
Falling Three Methods Candlestick Pattern

The Falling Three Methods candlestick pattern is a bearish continuation signal that forms during a downtrend and indicates that the market is pausing before continuing lower.
It consists of a strong bearish candle, followed by a series of small bullish candles that remain within the range of the first candle, and then a final strong bearish candle that confirms the continuation.
This structure shows that buyers are unable to take control during the pullback, while sellers remain dominant.
Traders use the Falling Three Methods pattern to identify high-probability selling opportunities, especially during retracements in a strong downtrend.
Upside Tasuki Gap Candlestick Pattern

The Upside Tasuki Gap candlestick pattern is a bullish continuation signal that forms during an uptrend and indicates that buying momentum is likely to continue.
It consists of a strong bullish candle followed by another bullish candle that gaps higher, creating a clear space between the two candles, and then a small bearish candle that partially fills the gap without closing it.
This structure shows that sellers are unable to fully close the gap, while buyers remain in control. Traders use the Upside Tasuki Gap pattern to identify continuation opportunities, especially in strong trending markets.
Downside Tasuki Gap Candlestick Pattern
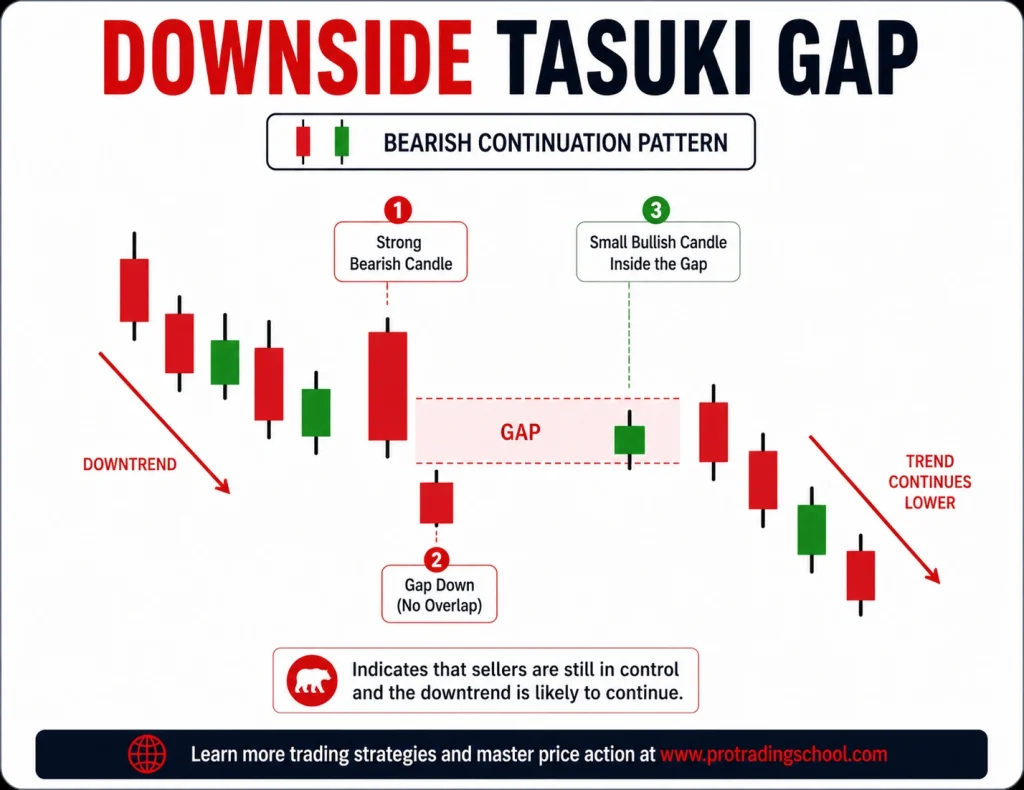
The Downside Tasuki Gap candlestick pattern is a bearish continuation signal that forms during a downtrend and indicates that selling pressure is likely to continue.
It consists of a strong bearish candle followed by another bearish candle that gaps lower, creating a clear space between the two candles, and then a small bullish candle that partially fills the gap without closing it.
This structure shows that buyers are unable to fully close the gap, while sellers remain in control.
Traders use the Downside Tasuki Gap pattern to identify continuation opportunities, especially in strong downtrends.
Mat Hold Candlestick Pattern
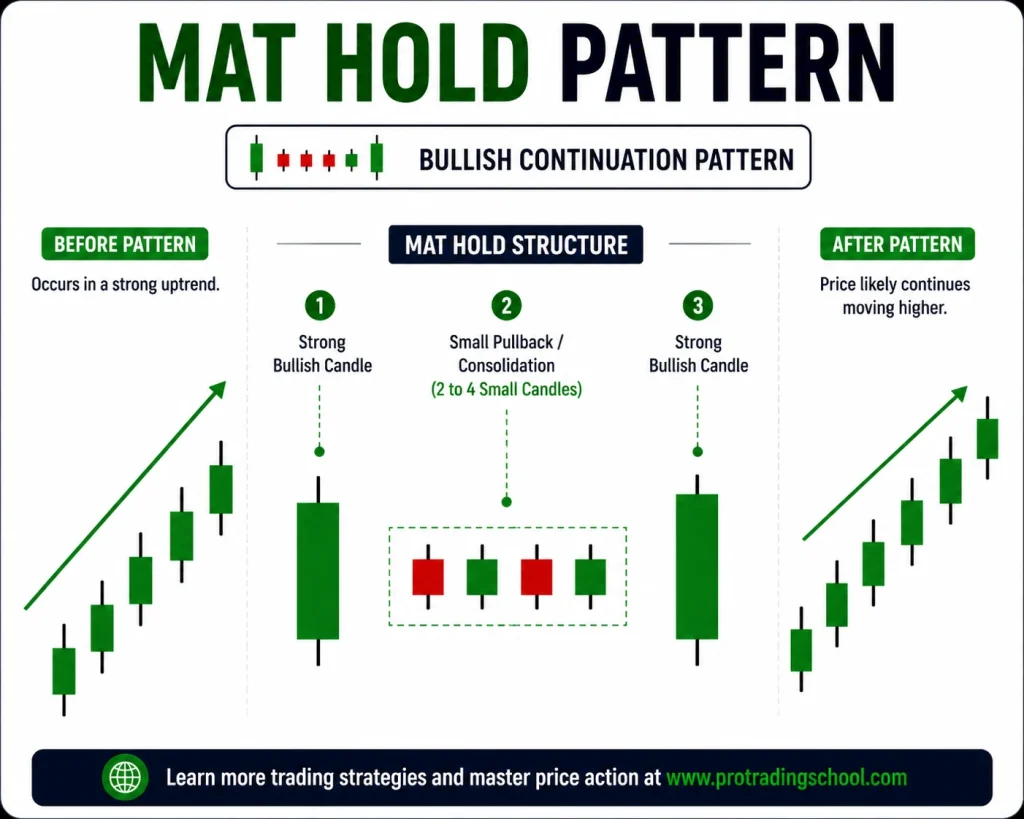
The Mat Hold candlestick pattern is a bullish continuation signal that forms during an uptrend and indicates that buying momentum is likely to continue after a brief pause.
It consists of a strong bullish candle, followed by a small gap up and a series of smaller bearish candles that remain within the range, and then a final strong bullish candle that confirms the continuation.
This structure shows that sellers are unable to reverse the trend during the pullback, while buyers remain in control.
Traders use the Mat Hold pattern to identify high-probability buying opportunities during retracements in strong uptrends.
Advanced Multi-Candle Patterns
Advanced multi-candle patterns consist of complex formations that develop over several candles, providing deeper insight into market structure and trader behavior.
These patterns combine multiple signals to reveal shifts in momentum, trend continuation, or potential reversals with higher reliability.
By understanding these setups, you can gain a more refined view of price action and align your trades with smart money as it builds positions over time.
Three Inside Up Candlestick Pattern
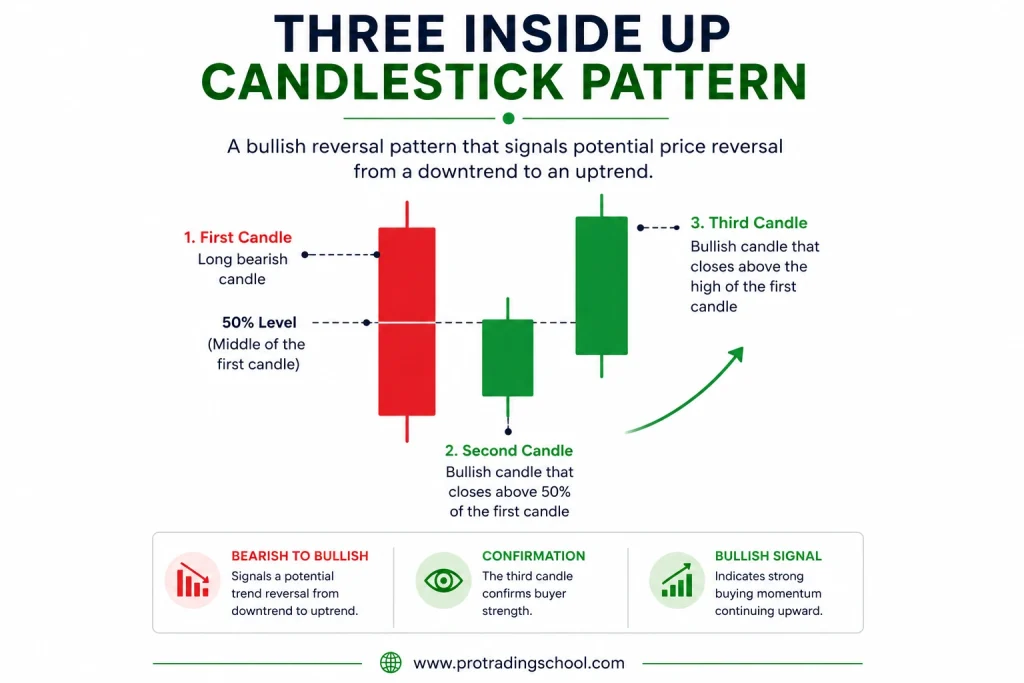
The Three Inside Up candlestick pattern is a bullish reversal signal that forms after a downtrend and indicates that buyers are starting to gain control.
It consists of three candles: a strong bearish candle, followed by a smaller bullish candle contained within the first candle, and then a strong bullish candle that closes above the first candle’s high to confirm the reversal.
This structure shows a shift in momentum from sellers to buyers. Traders use the Three Inside Up pattern to identify potential buying opportunities, especially when it appears at key support levels or after a pullback.
Three Inside Down Candlestick Pattern

The Three Inside Down candlestick pattern is a bearish reversal signal that forms after an uptrend and indicates that sellers are starting to take control.
It consists of three candles: a strong bullish candle, followed by a smaller bearish candle contained within the first candle, and then a strong bearish candle that closes below the first candle’s low to confirm the reversal.
This structure shows a clear shift in momentum from buyers to sellers. Traders use the Three Inside Down pattern to identify potential selling opportunities, especially when it appears at key resistance levels or after a strong upward move.
Three Outside Up Candlestick Pattern

The Three Outside Up candlestick pattern is a bullish reversal signal that forms after a downtrend and indicates that buyers are taking control of the market.
It consists of three candles: a bearish candle, followed by a strong bullish candle that overtakes the previous candle, and then a third bullish candle that closes higher to confirm the reversal.
This structure shows a clear shift in momentum from sellers to buyers. Traders use the Three Outside Up pattern to identify high-probability buying opportunities, especially when it appears at key support levels or after a strong decline.
Three Outside Down Candlestick Pattern

The Three Outside Down candlestick pattern is a bearish reversal signal that forms after an uptrend and indicates that sellers are taking control of the market.
It consists of three candles: a bullish candle, followed by a strong bearish candle that overtakes the previous candle, and then a third bearish candle that closes lower to confirm the reversal.
This structure shows a clear shift in momentum from buyers to sellers. Traders use the Three Outside Down pattern to identify high-probability selling opportunities, especially when it appears at key resistance levels or after a strong upward move.
Stick Sandwich Candlestick Pattern
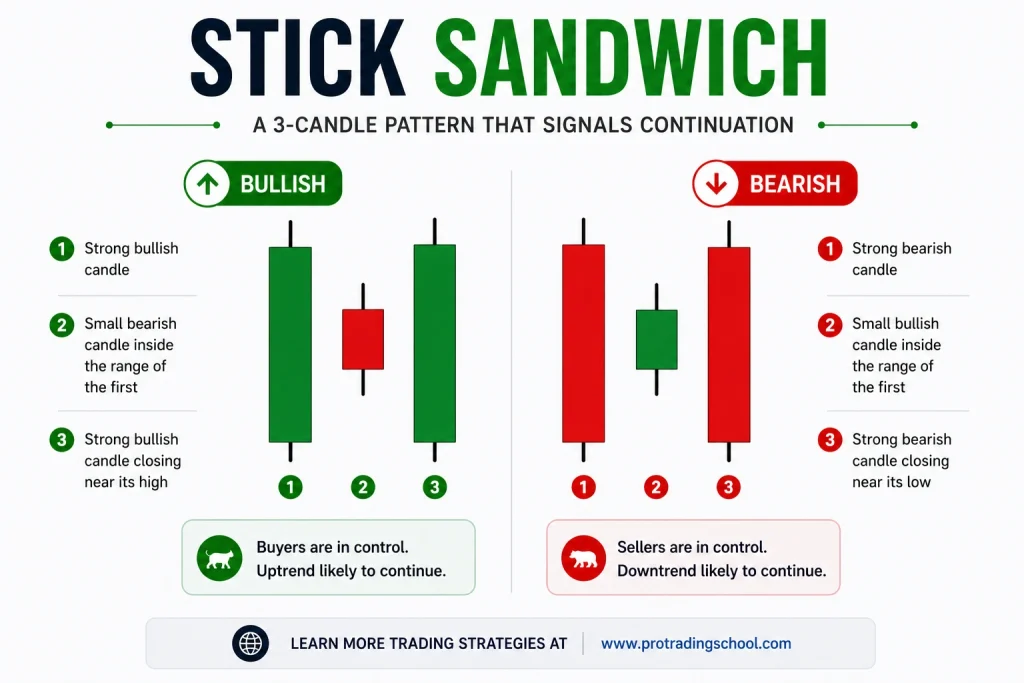
The Stick Sandwich candlestick pattern is a potential reversal signal that forms after a downtrend or uptrend and indicates a strong price level acting as support or resistance.
It consists of three candles where the first and third candles close at the same price level, while the middle candle moves in the opposite direction.
This structure shows that the market tested a level and failed to break it, highlighting a possible shift in momentum.
Traders use the Stick Sandwich pattern to identify key support or resistance zones and potential reversal opportunities.
Conclusion
Candlestick patterns are essential tools in technical analysis that help traders understand market psychology and anticipate potential price movements.
By learning how to recognize bullish, bearish, and continuation patterns, you can improve your timing, identify high-probability setups, and avoid common trading mistakes.
This candlestick patterns cheat sheet provides a practical reference you can use across all markets, including forex, stocks, and cryptocurrencies.
However, no pattern should be used in isolation — combining candlestick patterns with key support and resistance levels, market structure, and confirmation signals will significantly increase your trading accuracy and consistency.








Looking to learn trading
Thanks for the great job that you did in publishing this book, it’s so important to the forex trader as well as those who are willing to learn Forex
Thats great depth of insight. Thank you so much that you’re giving out such knowledge for free
Very good information. Thank you for your hard work and no price walls.
Thanks for the great job that you did in publishing this book, it’s so important to the forex trader as well as those who are willing to learn Forex