
The Inverted Hammer Candlestick Pattern is a bullish reversal candlestick pattern that appears at the end of a downtrend and signals a potential shift in market direction from bearish to bullish.
The pattern is characterized by a small real body near the bottom of the candle and a long upper wick, showing that buyers attempted to push prices higher after a period of selling pressure.
The long upper shadow reflects a battle between buyers and sellers during a specific time period.
Although sellers initially controlled the market, buyers stepped in aggressively and pushed the price upward, indicating that bearish momentum may be weakening.
This candlestick pattern becomes more reliable when it forms near a key support level, a bullish institutional zone, or after a liquidity sweep.
Traders often use additional confirmation tools such as volume, RSI divergence, or bullish candlestick confirmation before entering a trade.
If you want to learn more bullish and bearish formations, check out this complete candlestick patterns cheat sheet covering 33 powerful chart patterns used by professional traders.
Table of Contents
Key Takeaways
- The Inverted Hammer Candlestick Pattern is a bullish reversal pattern that forms after a downtrend.
- The pattern consists of a small real body and a long upper wick with little or no lower shadow.
- It shows that buyers attempted to regain control after strong selling pressure.
- The inverted hammer signals a potential trend reversal from bearish to bullish.
- The pattern becomes more powerful when it forms at a key support level or bullish institutional zone.
- Volume confirmation can increase the reliability of the setup.
- Traders often combine the inverted hammer with RSI divergence, liquidity sweeps, and market structure analysis.
- Waiting for bullish confirmation after the pattern can help reduce false signals.
- The inverted hammer can be used in forex, stocks, cryptocurrencies, and indices across multiple time frames.
- Risk management and proper stop-loss placement remain essential when trading the pattern.
How Does the Inverted Hammer Look?
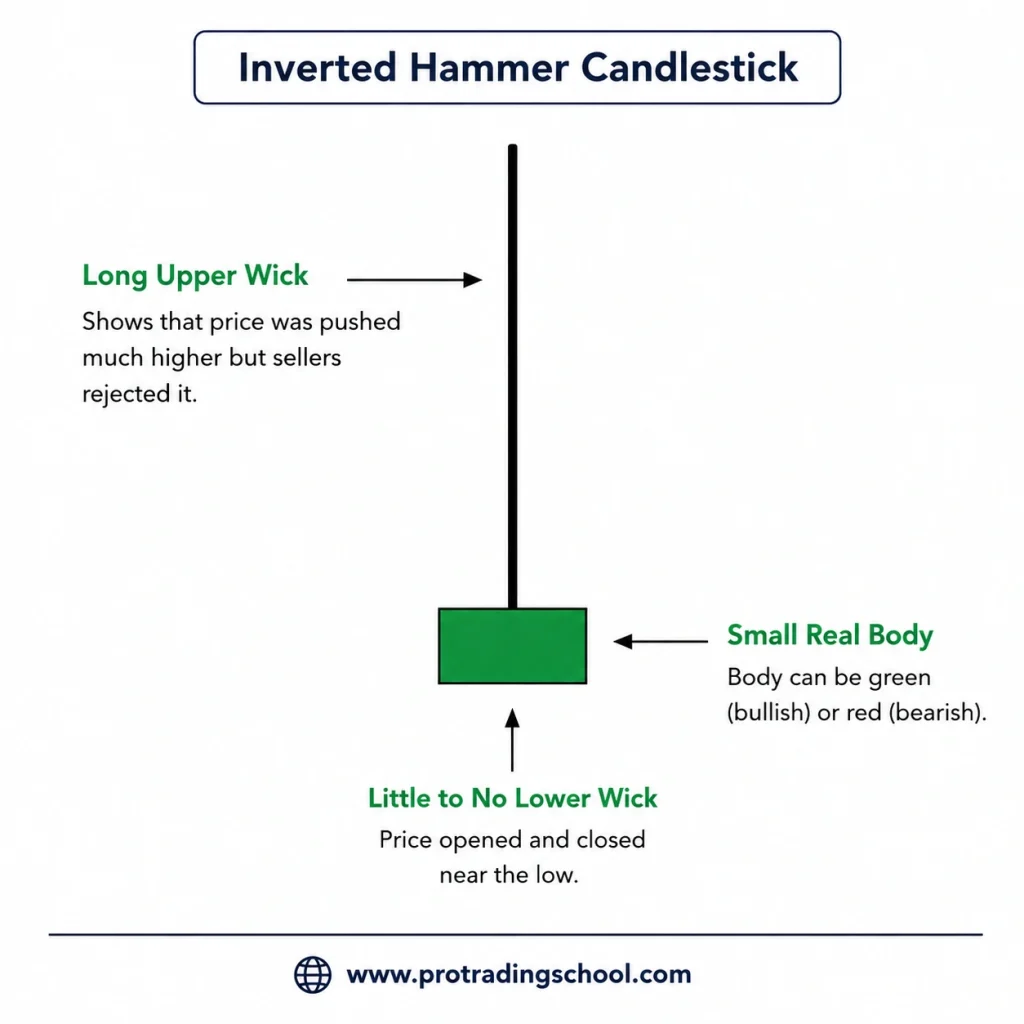
The Inverted Hammer has a distinctive structure that makes it easy to recognize on a price chart.
The pattern forms with a small real body near the bottom of the candle and a long upper wick that reflects strong buying pressure during the trading session.
To be considered a valid inverted hammer candlestick pattern, the upper shadow should generally be at least twice the size of the real body. The candle also has little or no lower shadow.
The inverted hammer can appear as:
- A green bullish candle or a red bearish candle on modern red-and-green charts
- A white candle or a black candle on traditional black-and-white candlestick charts
The color of the candle is less important than the anatomy of the pattern itself. What matters most is the long upper wick and the small body near the bottom of the candlestick, as these elements reveal the shift in momentum between sellers and buyers.
Main Characteristics of the Inverted Hammer Pattern
-Small real body near the bottom of the candle
-Long upper wick
-Little or no lower shadow
-Upper wick should be at least twice the size of the body
-Appears after a downtrend
-Signals potential bullish reversal pressure
This candlestick structure shows that buyers were able to push prices significantly higher during the session, even if sellers managed to close the candle near the opening price.
This early sign of buyer strength is what makes the inverted hammer an important bullish reversal signal for many traders.
Inverted Hammer Candlestick Pattern Chart Example

In this chart example, you can clearly identify an Inverted Hammer Candlestick Pattern forming at the end of a downtrend.
Before the pattern appeared, the market was moving lower, showing strong bearish momentum and continuous selling pressure.
As price reached this key support level and briefly broke below it, the inverted hammer pattern formed and sent an early warning signal that buyers were beginning to enter the market.
The long upper wick reveals that buyers attempted to push prices higher during the trading session, showing the first signs of weakening bearish control.
The next candle and the third candle play an important role in confirming the setup because they created what we call a liquidity sweep.
Normally, traders wait for another candle to close above the inverted hammer to confirm the pattern.
However, the liquidity sweep is an even stronger signal. The fact that the third candle closed back above the support level further confirmed the bullish signal generated by the inverted hammer pattern.
This type of setup becomes more reliable when:
- The market is in a clear downtrend
- The pattern forms near a strong support level
- Volume increases during the reversal
- The confirmation candle closes strongly bullish
- The setup aligns with the higher time frame direction
The inverted hammer pattern alone is a warning signal, but the confirmation candle helps traders validate that bullish momentum is entering the market. This is why many professional traders wait for confirmation before entering a buy trade.
The Psychology Behind the Inverted Hammer Candlestick Pattern Formation
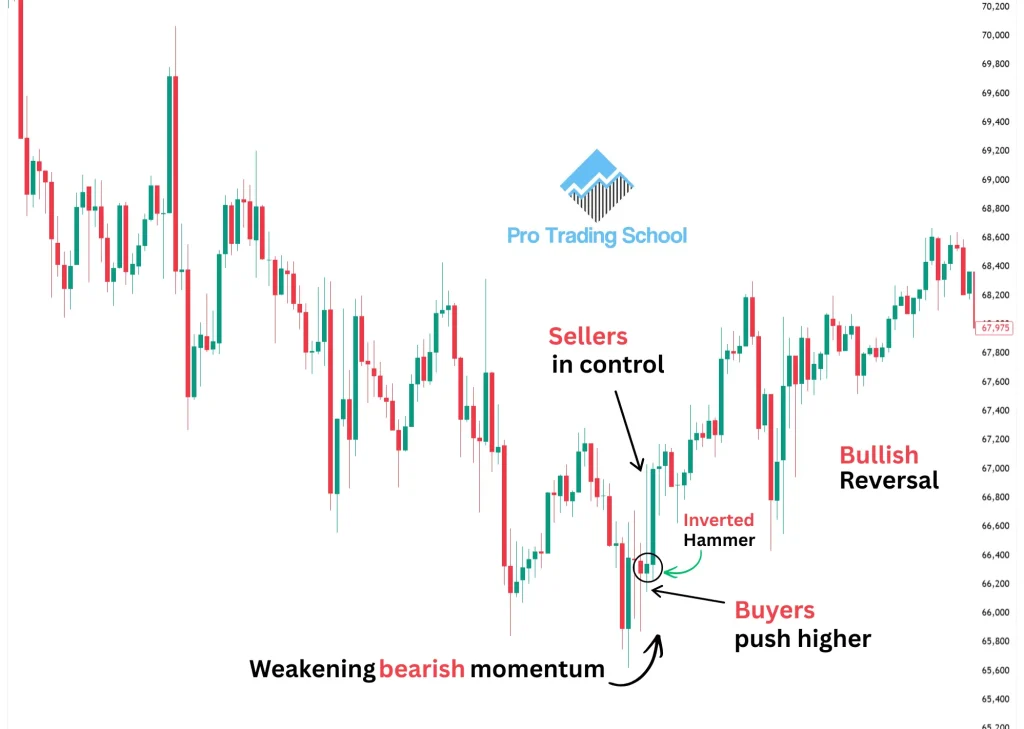
The Inverted Hammer Candlestick Pattern reflects a psychological battle between sellers and buyers during a specific trading session.
When the inverted hammer forms, sellers are still in control at the beginning of the session because the market is already in a downtrend.
However, buyers suddenly step in and push the price strongly upward, creating the long upper wick.
This aggressive bullish reaction shows that buying pressure is starting to enter the market after a prolonged decline.
Even though sellers manage to regain partial control and force the candle to close near its opening price, the important message is that buyers were finally strong enough to challenge bearish momentum. This change in behavior often signals that sellers are losing strength.
When this conflict between buyers and sellers occurs after an extended downtrend, especially near a key support level, a bullish institutional zone, or after a liquidity sweep, it becomes an early warning sign that the market sentiment may be shifting from bearish to bullish.
The psychology behind the inverted hammer can be summarized in three stages:
- Sellers dominate the market during the downtrend.
- Buyers suddenly enter aggressively and push prices higher.
- Sellers manage to close the candle lower, but the strong bullish reaction reveals weakening bearish momentum.
This shift in momentum is why many traders consider the inverted hammer a potential bullish reversal signal, particularly when combined with confirmation tools such as:
- Bullish engulfing patterns
- Volume increase
- RSI divergence
- Break of market structure
- Support and resistance analysis
The stronger the rejection from the lower prices, the more meaningful the inverted hammer pattern becomes.
What Does the Red Inverted Hammer Indicate?
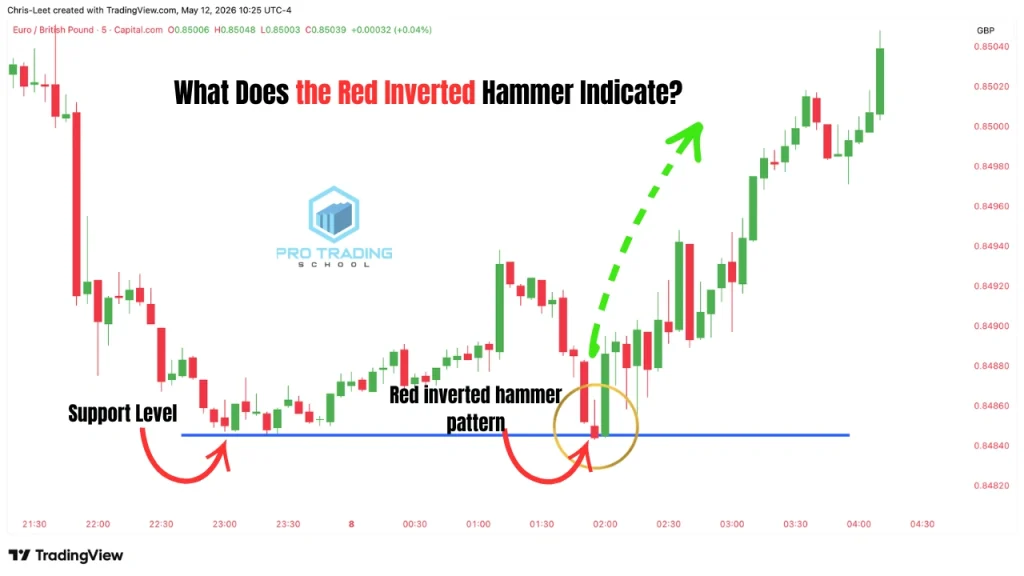
A red Inverted Hammer indicates that buyers attempted to take control during the trading session, but sellers managed to regain dominance before the candle closed. This is why the candle closes below its opening price, creating the red color on the chart.
Even though sellers technically won the battle during that session, the most important signal is the strong bullish reaction that formed the long upper wick.
This upper shadow shows that buyers were aggressive enough to push the market significantly higher during the session, which can be an early warning sign that bearish momentum is weakening.
When a red inverted hammer forms after an extended downtrend, especially near:
- A key support level
- A bullish institutional zone
- A liquidity sweep
- A higher time frame support area
it can signal a potential bullish trend reversal.
The color of the candle is less important than the psychology behind the pattern. What matters most is:
- The long upper wick
- The location of the pattern
- The overall market context
- The confirmation candle that follows
In many cases, traders prefer waiting for a bullish confirmation candle after the red inverted hammer before entering a buy trade.
This confirmation helps validate that buyers are starting to gain stronger control over the market.
This is why professional traders always analyze the location of the pattern within the overall trend before making trading decisions.
Inverted Hammer vs Shooting Star
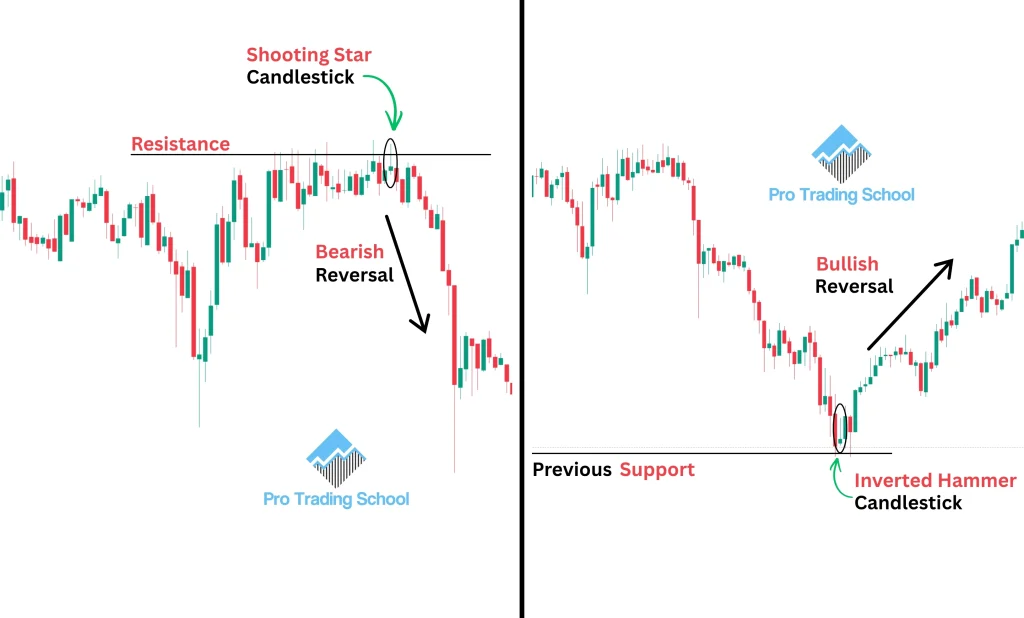
The Inverted Hammer Candlestick Pattern that forms at the top of an uptrend is not considered an inverted hammer anymore. Instead, it is known as a Shooting Star Candlestick Pattern or a bearish pin bar.
This is because the candle at the top of an uptrend signals a potential bearish trend reversal, while the inverted hammer at the bottom of a downtrend signals a potential bullish trend reversal.
Although both patterns share the same anatomy:
- Small real body
- Long upper wick
- Little or no lower shadow
Their meaning changes completely depending on where they form within the market structure.
Why Do They Have Different Meanings?
Candlestick patterns are based on market psychology and context. The same candle can send different signals depending on whether it forms:
- At the end of a downtrend
- At the top of an uptrend
When the pattern forms after a bearish trend, it reflects buyers attempting to regain control from sellers, which creates bullish reversal potential.
However, when the same pattern forms after a bullish trend, it reflects rejection from higher prices and aggressive selling pressure entering the market near resistance. In this case, the candle becomes bearish and is classified as a shooting star pattern.
This is why professional traders always analyze:
- Trend direction
- Market structure
- Support and resistance
- Institutional zones
- Liquidity sweeps
before trading any candlestick pattern.
Read this complete guide to the shooting star candlestick pattern to understand its psychology, structure, and trading strategies.
How to Trade the Inverted Hammer Candlestick Pattern
This bullish reversal candlestick pattern can be traded using different technical analysis strategies depending on the market structure, trend direction, and confirmation signals.
Professional traders rarely trade the pattern alone. Instead, they combine it with support and resistance, market structure, institutional zones, liquidity sweeps, and confirmation candles to increase the probability of success.
In this section, we will cover the best inverted hammer trading strategies step by step so you can understand exactly how to use this candlestick pattern to identify high-probability trade entries in the financial markets.
Trading the Inverted Hammer at a Support Level During a Downtrend
This strategy consists of trading the inverted hammer during a downtrend when the pattern forms near a key support level.
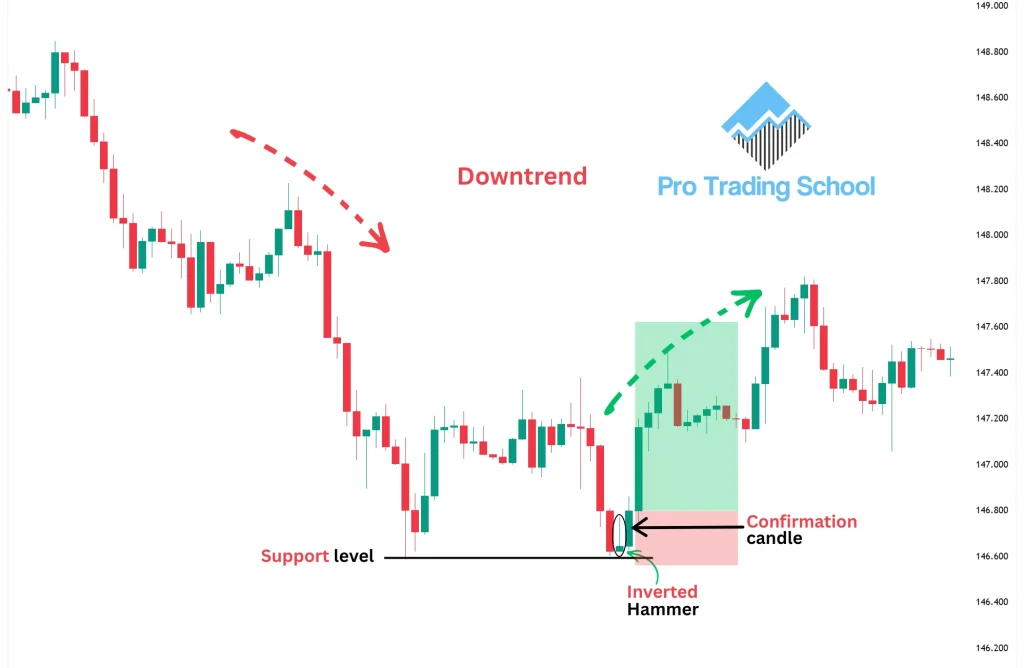
In this chart example, the market was clearly trending downward, which means sellers were controlling the market and pushing prices lower.
After the bearish move, price reached a strong support level and reacted upward, confirming that buyers were defending the area.
The market then retraced back toward the support level and formed an Inverted Hammer Candlestick Pattern.
What happens at this stage is very important.
The support level signals that sellers may no longer have full control of the market. They attempted to break below the support area, but failed to maintain bearish momentum.
The formation of the inverted hammer becomes an early warning signal that buyers are starting to enter the market aggressively.However, professional traders usually wait for an additional confirmation before entering a trade.
In this setup, the confirmation comes from the next bullish candle closing above the high or upper wick of the inverted hammer. This strong bullish close confirms that buyers are taking control and that a potential trend reversal may begin.
How to Enter the Trade
To execute this setup properly:
- Enter the trade after the confirmation candle closes above the inverted hammer wick
- Place the stop loss below the support level
- Target the next resistance level or key market structure level
As shown in the example, the market reversed upward and reached the target successfully.
Why This Strategy Works
This inverted hammer strategy works because it combines:
- Trend exhaustion
- Support level rejection
- Buyer reaction
- Candlestick confirmation
- Market psychology
The combination of these factors creates a higher-probability bullish reversal setup compared to trading the candlestick pattern alone.
Trading the Inverted Hammer at Demand Zones
Trading the Inverted Hammer Candlestick Pattern at strong demand zones can provide traders with a significant edge in the market.
This strategy combines candlestick analysis with institutional price action concepts to identify high-probability bullish reversal setups.
Why Demand Zones Matter
A demand zone is considered an institutional buying area where large market participants previously entered the market aggressively and pushed prices higher. When price retraces back into a well-defined demand zone, traders watch closely for signs that buyers may step in again.
This is where the inverted hammer pattern becomes extremely powerful.
When the inverted hammer forms inside a demand zone, it signals that buyers are reacting to the area and attempting to regain control of the market after a bearish retracement. The long upper wick reflects strong buying pressure and rejection from lower prices.
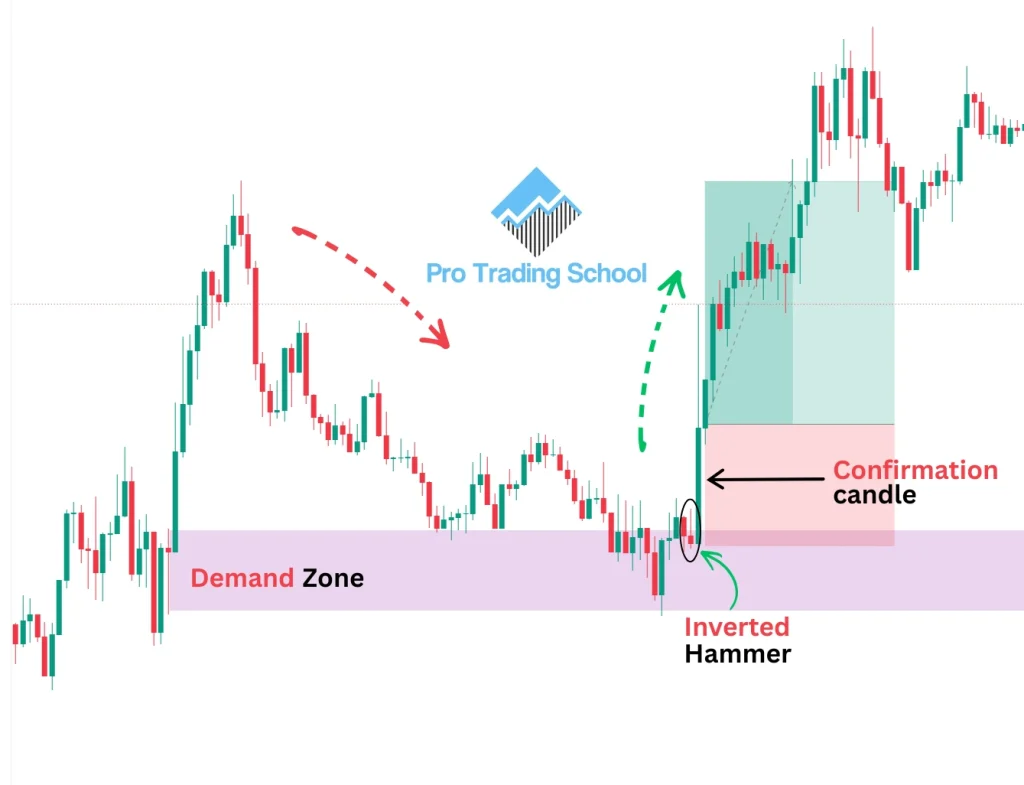
In this chart example, the market formed a strong bullish demand zone before retracing back into the area. Once price returned to the zone, an inverted hammer candlestick pattern appeared.
This reaction is very important because it validates the strength of the demand zone. The pattern shows that buyers are actively defending the area and trying to reverse the market upward.
The next bullish candle that closes above the high or upper wick of the inverted hammer acts as the confirmation signal. This confirmation indicates that buyers are gaining momentum and that a bullish reversal may begin.
How to Trade the Setup
Once the confirmation candle closes above the inverted hammer wick:
- Enter the buy trade at the close of the confirmation candle
- Place the stop loss below the demand zone
- Target the next resistance level or key market structure level
As shown in the example, the market moved upward and reached the target successfully.
Why This Strategy Is Powerful
This strategy works effectively because it combines:
- Institutional demand zones
- Bullish rejection
- Candlestick confirmation
- Market structure
- Buyer momentum
Instead of trading the inverted hammer alone, traders use the pattern as confirmation that institutional buyers may be entering the market again. This creates a stronger and more reliable bullish trading setup.
Advantages and Disadvantages of the Inverted Hammer Candlestick Pattern
| Advantages | Disadvantages |
| The Inverted Hammer can provide early warning signs of a bullish trend reversal. | The pattern can generate false signals when traded alone without confirmation. |
| Easy to identify because of its distinctive anatomy with a long upper wick and small body. | Not every inverted hammer leads to a market reversal. |
| Works well when combined with support levels, demand zones, and liquidity sweeps. | Weak setups often appear during choppy or sideways market conditions. |
| Can help traders enter trades near the beginning of a new bullish move. | Beginners often mistake the pattern for a guaranteed reversal signal. |
| Can be used on multiple markets including forex, stocks, indices, and cryptocurrencies. | Requires additional confirmation such as volume, market structure, or bullish candles. |
| Effective across different time frames from scalping to swing trading. | Trading against the higher time frame trend increases the probability of failure. |
| Provides clear stop-loss placement below support or below the candle structure. | Poor risk-to-reward setups can reduce long-term profitability. |
| Combines well with technical analysis tools such as RSI divergence and institutional zones. | Emotional trading after consecutive losses can lead traders to miss valid opportunities. |
| Helps traders understand market psychology and the battle between buyers and sellers. | The same candle anatomy can have different meanings depending on location in the trend. |
| Confirmation candles can improve the accuracy of the setup. | Requires patience and discipline to wait for confirmation before entering trades. |
Mistakes to Avoid When Trading the Inverted Hammer Candlestick Pattern
Many traders lose money with the inverted hammer setup not because the pattern does not work, but because they misuse it or ignore important trading principles.
Avoiding the following mistakes can help you improve your decision-making and trade the pattern more professionally.
1. Trading the Inverted Hammer Pattern Alone
One of the most common mistakes is placing trades based only on the inverted hammer candlestick pattern without considering the overall market context.
The inverted hammer is only one piece of information. To make a high-probability trading decision, you still need additional confirmation factors such as:
- Market structure
- Trend direction
- Support and resistance levels
- Demand zones
- Liquidity sweeps
- Higher time frame analysis
For example, you may spot an inverted hammer pattern at a support level on the 5-minute chart during a downtrend. Before taking the trade, you should switch to a higher time frame such as the 30-minute or 1-hour chart to analyze the bigger picture.
If the higher time frame is still trending strongly downward, the setup may simply be a temporary pullback rather than a real bullish reversal. Trading against the higher time frame trend increases the risk of failure.
Professional traders always combine candlestick patterns with market context instead of relying on a single signal.
2. Treating the Inverted Hammer as a Holy Grail
Another dangerous mistake is believing that the inverted hammer is a magical pattern that guarantees winning trades.
The reality is that the market can move unpredictably at any time. Even the best-looking setup can fail because no candlestick pattern works 100% of the time.
This is why risk management is essential.
Whenever you trade an inverted hammer setup:
- Always place a stop loss
- Never risk more than a small percentage of your account per trade
- Many professional traders risk no more than 1% to 2% per position
Protecting your capital is more important than chasing a single trade opportunity. A disciplined trader survives losing trades and stays consistent over the long term.
3. Ignoring the Risk-to-Reward Ratio
Another major mistake is ignoring the reward-to-risk ratio before entering the trade.
Sometimes you may find a nearly perfect setup:
- The inverted hammer anatomy is valid
- The pattern forms at a strong demand zone
- The higher time frame aligns with the setup
- The confirmation candle closes above the wick
- Market conditions look ideal
However, you still need to evaluate whether the trade offers enough potential reward compared to the amount you are risking.
Professional traders often look for at least a 2:1 reward-to-risk ratio. This means the potential reward should be at least twice the size of the possible loss.
This principle is extremely important because profitability in trading depends not only on your win rate, but also on:
The size of your winners
The size of your losses
With a solid reward-to-risk ratio, traders can remain profitable even if they lose many trades over time.
4. Losing Confidence After Consecutive Losses
One of the biggest psychological mistakes is being afraid to take the next valid setup after a series of losing trades.
Sometimes you may take a perfect inverted hammer setup and lose. Then you find another strong setup, but it fails again. After multiple losses, fear and self-doubt begin affecting your decisions.
This is where many traders make a critical mistake.
You may later find another high-quality setup with:
- Strong technical confirmation
- Higher time frame alignment
- Excellent market structure
- A powerful 5:1 reward-to-risk ratio
but because of emotional fear from previous losses, you avoid taking the trade.
In many cases, this missed trade could have recovered previous losses and generated significant profit.
Professional traders understand that losing trades are part of the game. Instead of focusing emotionally on individual outcomes, they focus on:
-Long-term probabilities
-Discipline
-Consistency
-Risk management
-Following their trading plan
The goal is not to win every trade. The goal is to execute high-probability setups consistently over time.
Conclusion
The Inverted Hammer Candlestick Pattern can be a powerful bullish reversal signal when traded in the right market conditions.
However, the best results come from combining the pattern with support and resistance, demand zones, higher time frame analysis, and proper risk management.
Like all candlestick patterns, the inverted hammer is not a guarantee, but when used correctly, it can help traders identify high-probability trading opportunities.
Frequently Asked Questions About the Inverted Hammer Candlestick Pattern
Is an Inverted Hammer Bullish?
Yes, the Inverted Hammer Candlestick Pattern is generally considered a bullish reversal pattern when it forms at the end of a downtrend.
The pattern signals that buyers are starting to challenge sellers after a bearish move. However, traders usually wait for additional confirmation before entering a trade, such as a bullish candle closing above the inverted hammer wick.
Can an Inverted Hammer Be Red?
Yes, an inverted hammer can be either red or green. A red inverted hammer means the candle closed below its opening price, while a green inverted hammer closed above its opening price.
Both versions can remain valid bullish reversal signals as long as the candle forms in the right market conditions and has the correct anatomy with a long upper wick and a small real body.
How Reliable Is an Inverted Hammer?
The inverted hammer can be a reliable reversal signal when combined with proper technical analysis. The pattern becomes more effective when it forms:
- Near a strong support level
- Inside a bullish demand zone
- After a liquidity sweep
- With volume confirmation
- In alignment with the higher time frame trend
Like all candlestick patterns, the inverted hammer is not guaranteed to work every time. This is why risk management and confirmation are essential.
What Timeframe Is Best for an Inverted Hammer?
The inverted hammer can work on all time frames, including:
- 1-minute charts for scalping
- 5-minute and 15-minute charts for day trading
- 1-hour and 4-hour charts for swing trading
- Daily and weekly charts for long-term trading
However, higher time frames generally produce stronger and more reliable signals because they contain more market data and reduce market noise.










Your the best trader I have gone across. I love your teachings and most exspecialy your accent. I understand you very well. But still facing difficulties though.
I’ll love to meet you physically. from Cameroon
You are the best bro.Thank you for the knowledge you are imparting in both the begginers and those who are already profitable.
I am first time to watch you..so you have seemed professional technical analysis. Please. Where can I find your best books about stock trading?