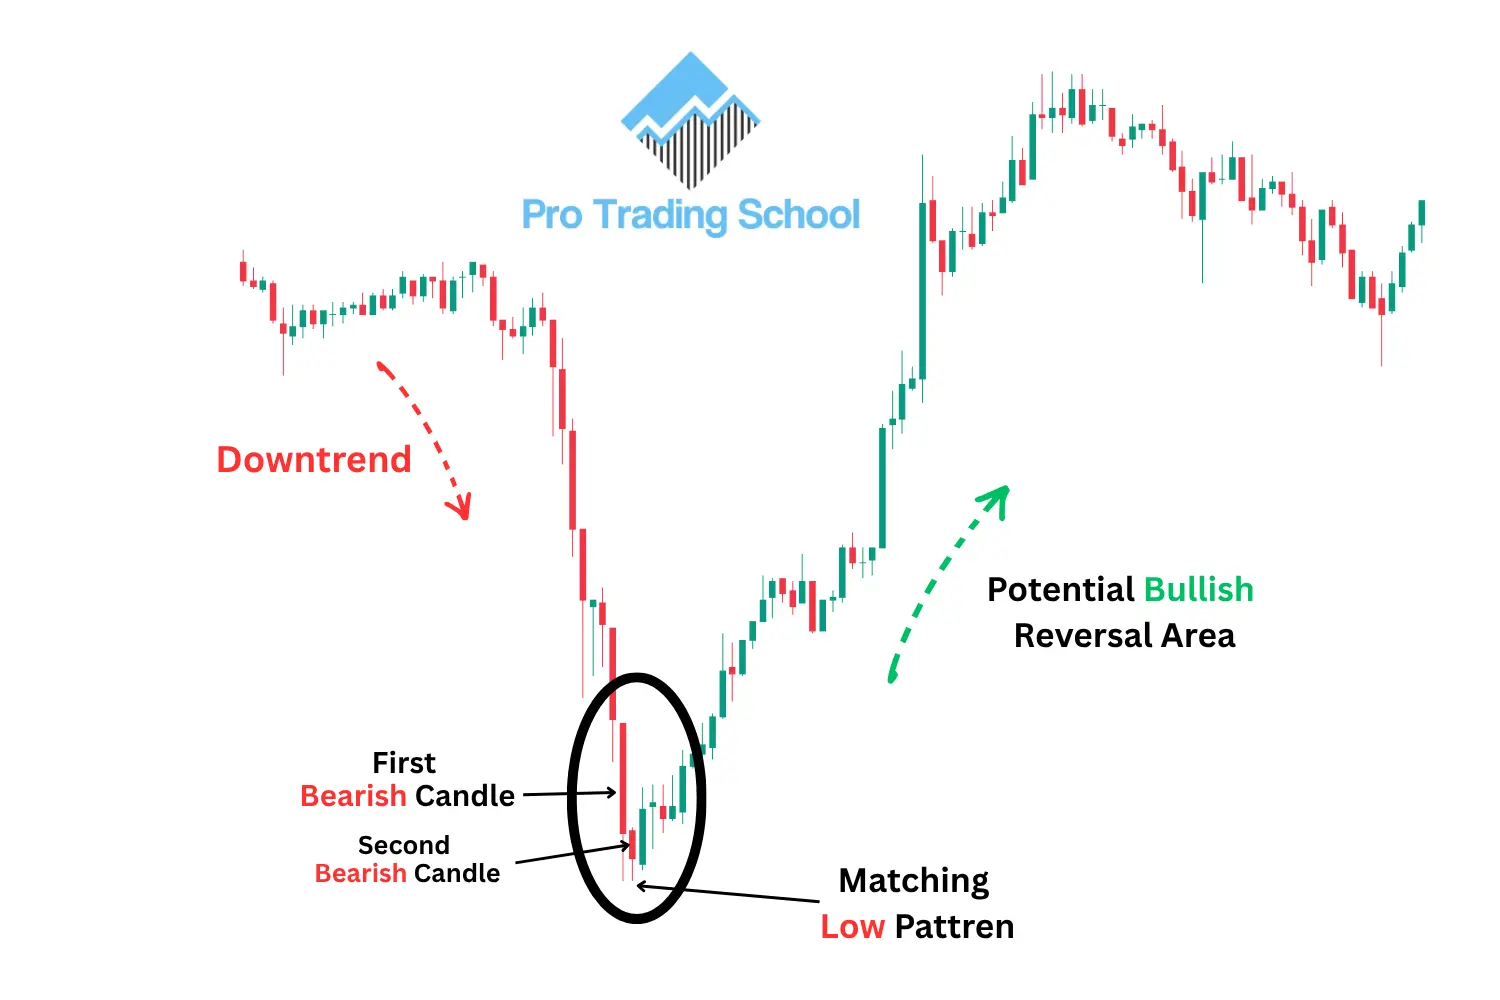
The Matching Low is a two-candlestick bullish reversal pattern that typically forms at the end of a downtrend.
It consists of two bearish candles that close at approximately the same price level, creating a clear area of support.
The pattern suggests that selling pressure is beginning to weaken. Although sellers attempt to continue pushing the price lower, they fail to achieve a meaningful close below the previous candle.
This inability to break lower may signal that buyers are starting to step in, increasing the possibility of a bullish reversal.
Matching Low Candlestick Pattern Example
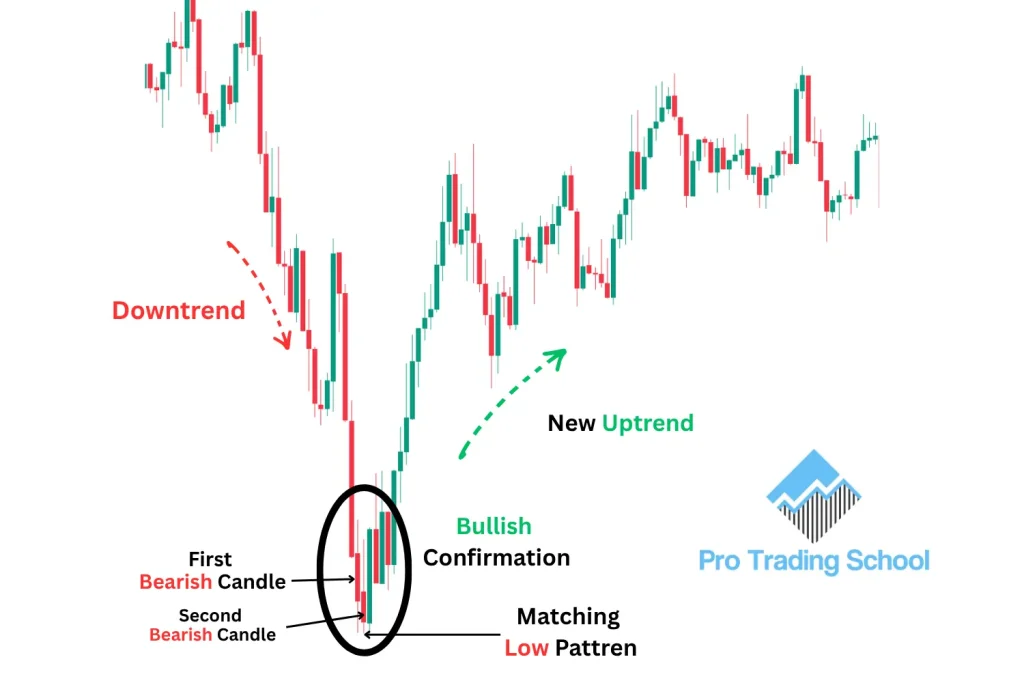
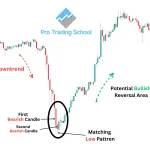
The chart example above shows how the Matching Low candlestick pattern appears in a real market. As you can see, the market was initially trending downward, with sellers clearly in control.
The first bearish candle formed during the downtrend and closed near its low. This was followed by a second bearish candle that also experienced selling pressure but failed to close significantly below the previous candle.
Instead, both candles closed at approximately the same price level, forming the Matching Low pattern.
This inability to achieve a lower close suggests that selling pressure is weakening and that buyers are beginning to resist further price declines. As a result, the probability of a bullish reversal increases.
In this example, the next candle was a strong bullish candle, confirming the pattern and providing additional evidence that buyers were taking control. The market subsequently reversed and began moving upward.
A common misconception is that the two candles must have exactly the same closing price. In reality, their closing prices do not need to be perfectly identical. They simply need to be at approximately the same level, creating a recognizable matching low area.
Matching Low Candlestick Psychology
Identifying the Matching Low pattern is the first step, but understanding the psychology behind its formation is what makes it useful for traders.
Take a look at the chart below.
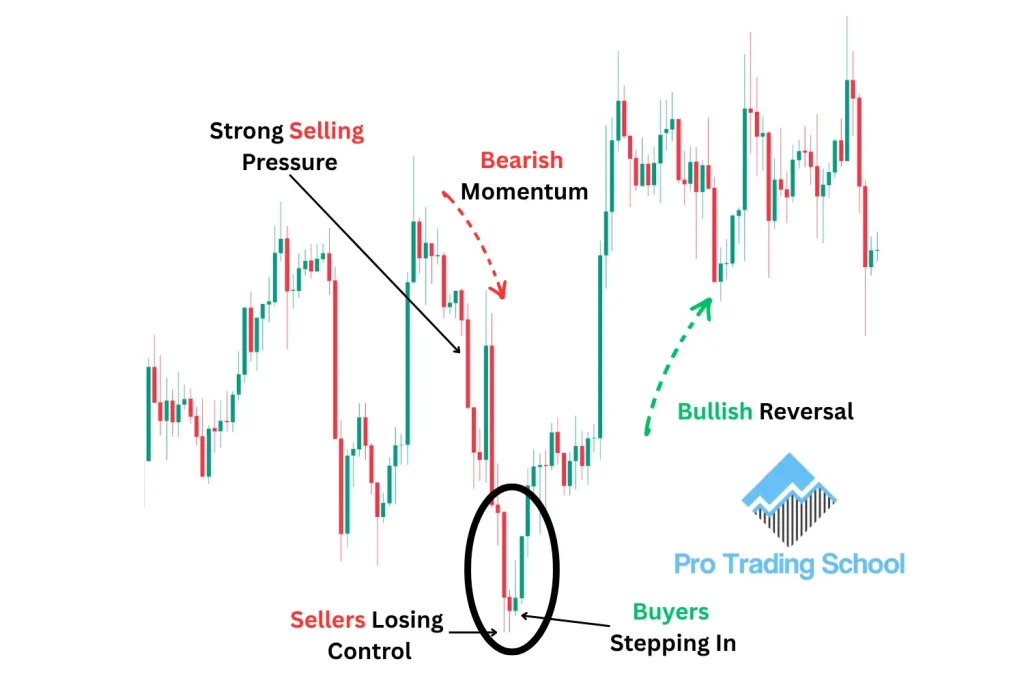
Before the pattern forms, the market is in a strong downtrend, showing that sellers are clearly in control. The first bearish candle continues this movement and confirms that selling pressure is still present.
The second candle provides the first sign of a possible change. Although sellers attempt to push the price lower, the candle closes at approximately the same level as the previous one.
This shows that sellers are struggling to maintain the same downward momentum and that buyers are beginning to defend this price area.
This change in market behavior is what makes the Matching Low significant. During a strong downtrend, we normally expect sellers to continue producing lower prices. When they suddenly fail to do so, it can be an early indication that the bearish trend is losing strength.
In the example above, the third and fourth candles are bullish, confirming that buyers are becoming stronger and increasing the probability of a trend reversal.
Understanding this psychology helps traders use the Matching Low pattern more effectively. Rather than treating it as an automatic buy signal, traders can look for additional confirmation from support levels, demand zones, trendlines, or other technical analysis tools before entering a trade.
Want to learn the bearish version of this pattern? Check out our Matching High Candlestick Pattern: Meaning & Strategy guide to learn how traders use the pattern to identify potential bearish reversals.
Trading the Matching Low at a Key Support Level
One effective way to trade the Matching Low candlestick pattern is to combine it with a key support level.
Instead of trading the pattern wherever it appears, waiting for it to form around an important support area can provide additional confirmation for the setup.
Take a look at the chart example below.
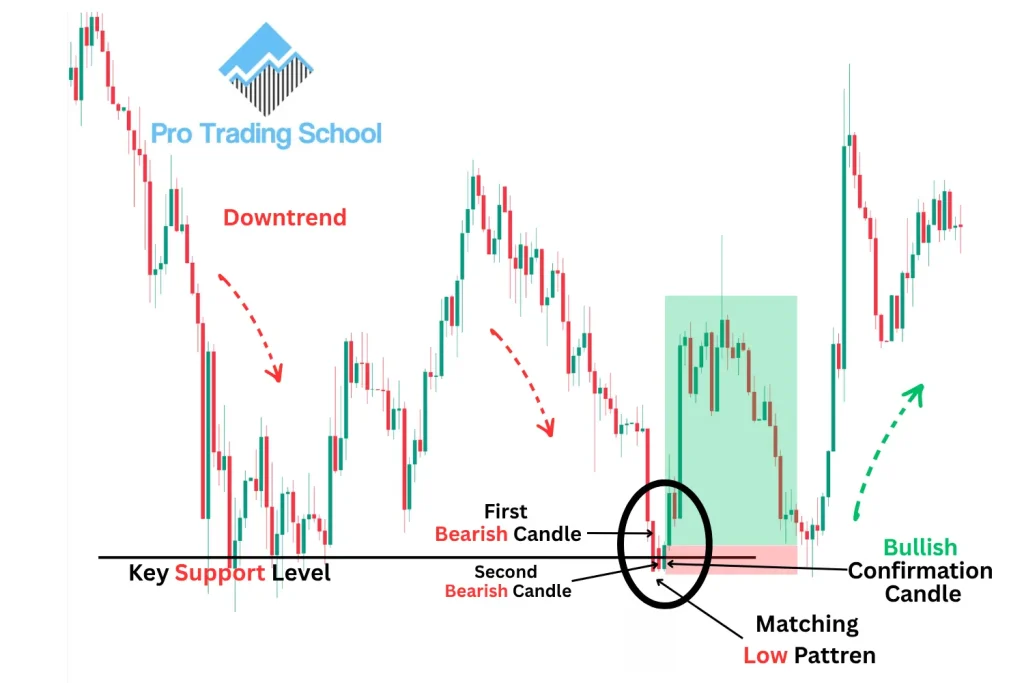
As you can see, the market was initially trending downward before reaching an area that had been tested several times.
Each time the price reached this area, buyers stepped in and pushed the market higher, creating a well-established support level.
The price eventually returned to this support level, where a Matching Low pattern formed. The first candle was bearish, followed by another bearish candle that closed at approximately the same price.
A strong bullish candle then appeared, providing additional confirmation that buyers were defending the support level.
After the bullish confirmation candle closes, a trader could enter a long position. The stop-loss can be placed below the Matching Low formation or below the support level, giving the trade enough room in case of a minor price fluctuation.
For the profit target, traders can use the next significant resistance level. Another approach is to use a predetermined risk-to-reward ratio, such as 2:1 or higher.
In this particular example, the market moved strongly upward after the entry and provided a potential risk-to-reward ratio of more than 5:1.The strength of this strategy comes from combining two different forms of technical analysis.
The support level identifies an area where buyers have previously entered the market, while the Matching Low provides a potential reversal signal when the price returns to that area. This approach can also be applied to other bullish reversal candlestick patterns.
Important Note
Before entering a trade, always check the higher timeframe for additional context. The timeframe you use will depend on your trading style.
For example, if you trade on the 15-minute chart, you could analyze the 1-hour chart to understand the broader market direction.
Ideally, the setup should be aligned with the higher-timeframe market structure. A Matching Low may look attractive on the trading timeframe, but if the higher timeframe shows strong bearish momentum, the setup is trading against the dominant market direction and may have a lower probability of success.
For this reason, use the Matching Low at support as a setup rather than a standalone buy signal.
Support, candlestick confirmation, higher-timeframe analysis, and proper risk management should all be considered before entering a trade.
Matching Low at a Demand Zone
Another way to trade the Matching Low candlestick pattern is to combine it with a demand zone.
This adds an important element of confluence, as the candlestick pattern forms in an area where buyers have previously shown strong interest.
A demand zone is an area on the chart from which the price previously made a strong bullish move.
Traders generally interpret this as an area where buying pressure significantly exceeded selling pressure. When the market returns to the zone, traders look for signs that buyers are stepping in again.
This is where the Matching Low pattern can become particularly useful. Instead of entering a trade immediately when the price reaches the demand zone, traders can wait for the pattern to provide additional confirmation.
Take a look at the chart example below.
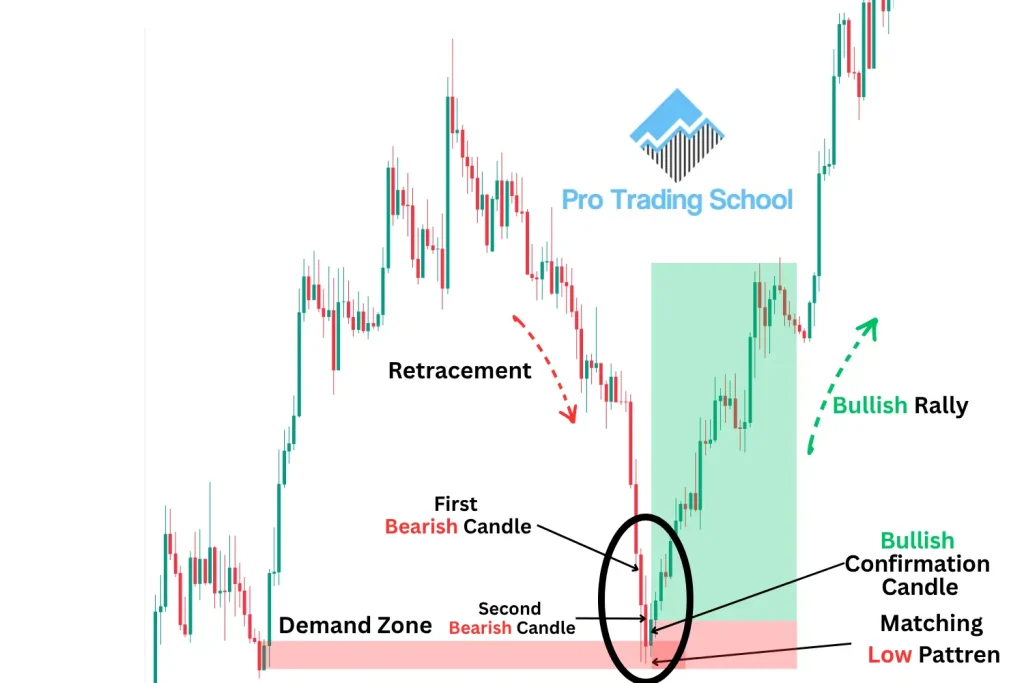
As you can see, the market initially made a strong bullish move, leaving behind a clearly identifiable demand zone. After moving higher, the price eventually retraced toward this area.
Once the price returned to the demand zone, a Matching Low pattern formed. The first bearish candle reached the zone and experienced rejection.
It was followed by a second bearish candle that closed at approximately the same price level. This suggests that selling pressure was struggling to push the market significantly lower within the demand zone.
The next bullish candle provided additional confirmation of the setup. After this candle closed, a trader could enter a long position and place a stop-loss below the demand zone or below the recent swing low.
The profit target could be placed at the next significant resistance level, depending on the market structure and the desired risk-to-reward ratio.
As the chart shows, the price subsequently moved strongly upward from the demand zone, providing a successful example of the setup.
Important Note
The Matching Low pattern is not a guaranteed reversal signal. Even when it forms at a well-defined demand zone, the setup can still fail. No candlestick pattern or trading strategy works every time.
For this reason, proper risk management is essential. Traders should define their risk before entering a position, use an appropriate stop-loss, and avoid risking too much capital on a single trade. Over the long run, consistent risk management is just as important as identifying high-quality trading setups.
Matching Low Candlestick Pattern Advantages and Disadvantages
Like any candlestick pattern, the Matching Low has both advantages and limitations. Understanding them can help traders determine when the pattern is worth trading and when additional confirmation may be necessary.
| Advantages | Drawbacks |
|---|---|
| Easy to identify on a price chart | Does not guarantee a bullish reversal |
| Can provide an early signal that selling pressure is weakening | Can produce false signals during strong downtrends |
| Works well when combined with key support levels | Should not be traded based on the pattern alone |
| Can be combined with demand zones and other technical analysis tools | The two closing prices are not always perfectly identical, which can make identification subjective |
| Provides clear areas for planning entries and stop-loss placement | Often requires additional bullish confirmation before entry |
| Can be used across different markets and timeframes | Lower timeframes may produce more noise and unreliable setups |
Conclusion
The Matching Low is a bullish reversal pattern that can help traders identify when selling pressure is weakening and a potential reversal may occur.
For better results, avoid trading the pattern alone. Combine it with key support levels, demand zones, and higher-timeframe analysis.
Most importantly, always use proper risk management, as no candlestick pattern works every time.
Frequently Asked Questions About the Matching Low Candlestick Pattern
Is the Matching Low pattern bullish or bearish?
The Matching Low is a bullish reversal candlestick pattern. It typically appears after a downtrend and suggests that sellers are losing momentum while buyers are beginning to defend a specific price level.
How do you identify a Matching Low pattern?
A Matching Low consists of two consecutive bearish candles that form after a downward price movement. The two candles reach the same or approximately the same low, showing that sellers have failed to push the market significantly lower.
Is the Matching Low a reliable candlestick pattern?
The Matching Low can provide useful reversal signals, but it is not reliable enough to be traded on its own. Its effectiveness can improve when it forms at an important support level or demand zone and is supported by additional confirmation.
Does the Matching Low pattern need confirmation?
Yes. Traders can wait for a bullish candle to form after the Matching Low before considering an entry. A strong bullish candle provides additional evidence that buyers may be taking control of the market.
What is the difference between a Matching Low and a Tweezer Bottom?
Both patterns can signal a potential bullish reversal and involve two candles reaching approximately the same low.
In the approach used in this article, the Matching Low consists of two bearish candles, while a Tweezer Bottom commonly consists of a bearish candle followed by a bullish candle.
The exact definitions can vary between candlestick references, so traders should use consistent identification rules.
Where should you place a stop-loss when trading a Matching Low?
A stop-loss can generally be placed below the Matching Low formation, the recent swing low, or the support or demand zone associated with the setup.
The exact placement should depend on the market structure and the trader’s risk-management strategy.
Can the Matching Low pattern fail?
Yes. Like all candlestick patterns, the Matching Low can produce false signals. A market may briefly form the pattern before continuing its downtrend.
This is why confirmation, market context, and proper risk management are important when trading the setup.


Thanks for this interesting article, this is my first time reading about the matching low candlesticks pattern. I will defiantly backtest using it as explained in the article,