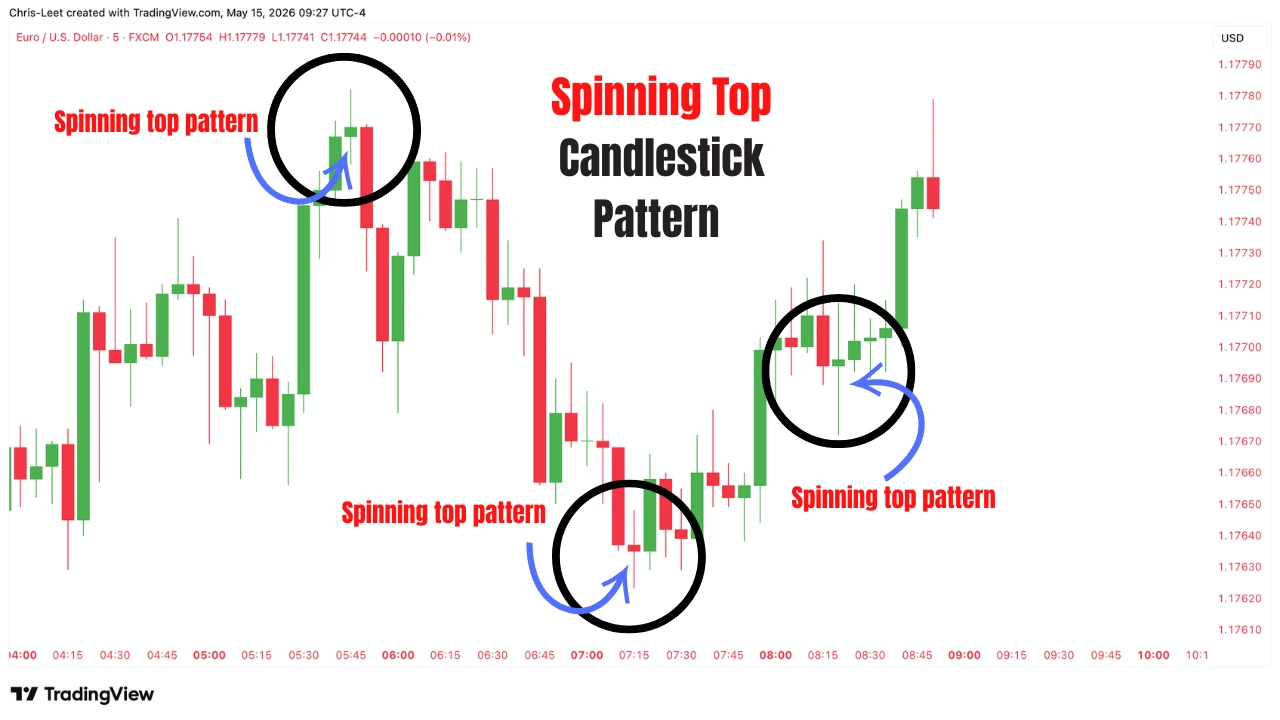
The spinning top candlestick pattern is a neutral candlestick formation characterized by a small real body positioned near the center of the candle, with an upper wick and a lower wick on both sides.
This pattern reflects market indecision because neither buyers nor sellers were able to take full control during the trading session. Price moved higher and lower, but eventually closed near the opening price.
At first glance, the spinning top may look similar to a Doji candlestick pattern. However, there is an important difference between the two patterns.
A doji candle forms when the opening and closing prices are almost identical, showing a nearly perfect balance between bulls and bears.
In contrast, a spinning top has a small real body, which means one side still managed to gain a slight advantage before the session closed.
If buyers close the session slightly above the opening price, the pattern forms a bullish spinning top (green candle).
If sellers close the market slightly below the opening price, it creates a bearish spinning top (red candle).
Even though one side technically wins the battle, the small body and long shadows reveal hesitation, weak momentum, and uncertainty in the market.
Key Takeaways
- The spinning top candlestick pattern is a neutral price action signal that reflects market indecision.
- It has a small real body with upper and lower shadows on both sides.
- The pattern shows that buyers and sellers both pushed price during the session, but neither side gained strong control.
- A green spinning top means buyers closed slightly above the opening price.
- A red spinning top means sellers closed slightly below the opening price.
- Unlike a doji candle, the spinning top has a visible real body.
- This candlestick formation becomes more powerful when it appears near key support and resistance levels, supply and demand zones, or after a strong trend.
- Traders often wait for confirmation from the next candle before entering a trade.
The Anatomy of the Spinning Top Candlestick
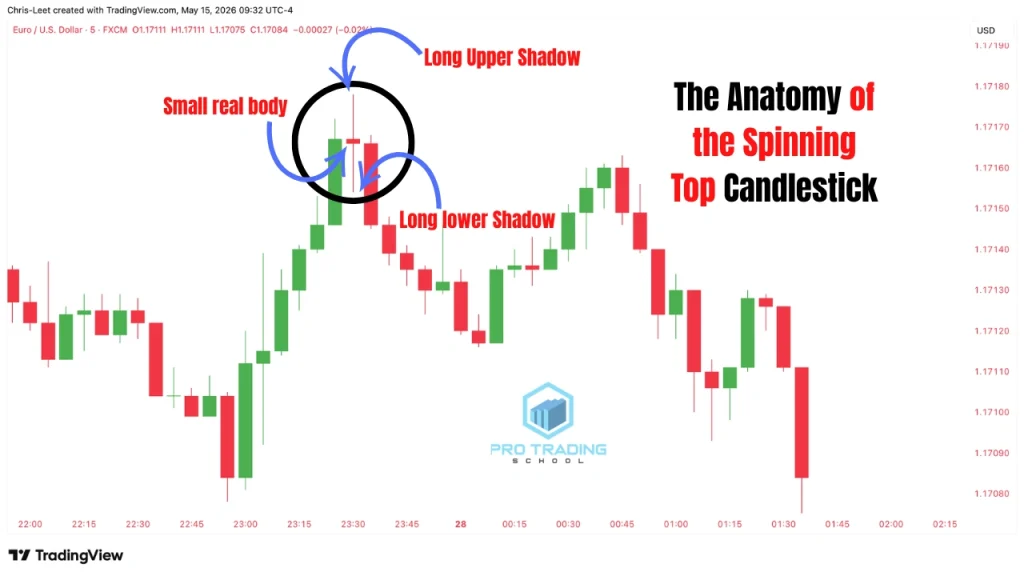
The spinning top candle has a unique structure that reflects hesitation and uncertainty in the market. Understanding its anatomy can help you identify the pattern more accurately on the chart.
Small Real Body
The most important characteristic of this formation is the small real body located near the center of the candle.
This small body shows that the opening and closing prices were relatively close to each other, indicating weak momentum from both buyers and sellers.
Long Upper Shadow
The upper wick shows that buyers pushed the market higher during the session. However, they failed to maintain control before the candle closed.
Long Lower Shadow
The lower wick indicates that sellers also managed to push price lower during the session, but they were unable to keep the market down.
When both shadows are relatively long and the body remains small, the candle reflects indecision, volatility, and a temporary balance between bullish and bearish pressure.
Spinning Top Candlestick Pattern Example

As you can see in the chart example above, we have multiple spinning top candlestick patterns.
The first one is a green spinning top that forms at the top of the market and reverses price downward.
The second one is a red spinning top candlestick pattern that forms at the bottom of the market and reverses price upward.
And the third one forms during an uptrend and pushes the market higher as a continuation signal.
As you can see, the color of the spinning top is not the most important factor. The pattern can act as a bullish signal, bearish signal, reversal signal, or continuation signal depending on the market context.
This chart example is only used to illustrate how the spinning top candlestick pattern looks on a real chart. It is not recommended to trade it on its own.
For higher-probability setups, traders should always combine the spinning top candlestick pattern with other factors of confluence such as support and resistance levels, moving averages, supply and demand zones, trend analysis, and confirmation candlestick patterns.
In the next sections of this blog post, we will cover several powerful strategies that can be used to trade the spinning top candlestick pattern effectively.
If you want to learn more about the most important bullish and bearish candlestick formations used by traders, check out our complete guide on the 33 Candlestick Patterns Cheat Sheet, where we break down the most powerful candlestick patterns with simple explanations and chart examples.
Types of the Spinning Top Candlestick

The spinning top pattern can appear in two forms: a bullish spinning top and a bearish spinning top.
Both patterns reflect indecision in the market, but the candle color shows which side slightly gained control before the session closed.
Green Spinning Top
A green spinning top forms when the market opens, moves lower, then pushes higher before closing above the opening price.
This price action shows that buyers managed to win the battle during that trading session. However, the long upper and lower shadows reveal that sellers were still active, creating hesitation and volatility in the market.
Even though the candle closes bullish, the pattern mainly reflects uncertainty rather than strong bullish momentum.
Red Spinning Top
A red spinning top forms when the market opens, fluctuates higher and lower during the session, and finally closes below the opening price.
The long shadows show that both buyers and sellers were fighting for control, but sellers eventually gained a slight advantage before the candle closed.
Like the bullish variation, this pattern signals indecision and market hesitation rather than strong bearish strength.
Is the color of the Spinning Top important?
The color of the spinning top candle is less important than the psychology behind the pattern.
What matters most is the clear sign of indecision between buyers and sellers. When this candlestick appears under specific market conditions — such as near a key support or resistance level, a supply and demand zone, or after an extended trend — it can provide high-probability buy or sell opportunities.
In the next sections, you will learn how traders use the spinning top pattern to identify potential reversals and continuation setups.
Is the Spinning Top Bullish or Bearish?
The spinning top candlestick pattern can be bullish or bearish depending on the overall market context. It can also act as either a reversal signal or a continuation pattern based on where it appears on the chart.
This is why professional traders never trade the spinning top candle in isolation. The location of the pattern is far more important than the candle itself.
Spinning Top as a Bearish Reversal Signal
Look at the chart example below:
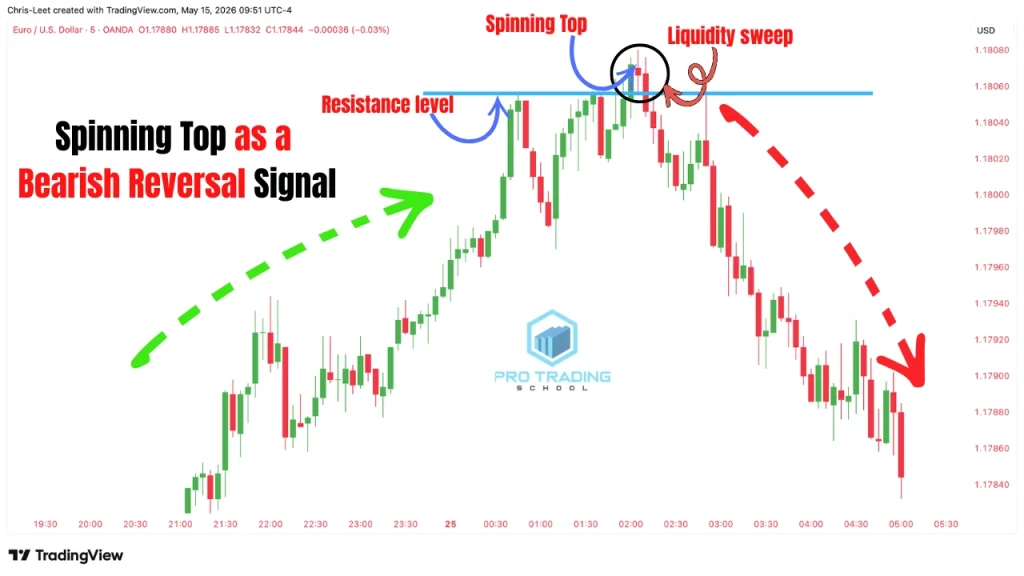
As you can see, the market was trending higher before reaching a strong resistance level. Price failed to continue moving upward, and a spinning top candle formed at the level.
After the formation of the spinning top, the market closes back below the resistance level, creating what we call a liquidity sweep.
Combining the spinning top candlestick pattern with a liquidity sweep can provide a high-probability trading setup.
Spinning Top as a Bearish Continuation Signal
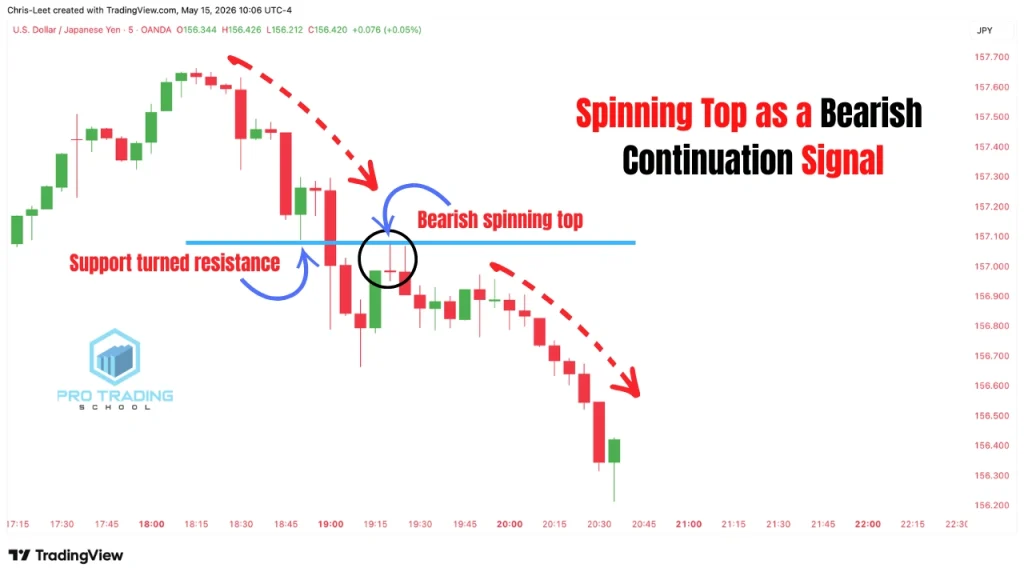
Look at another chart example above
In this example, the market was already trending downward. Price broke below a strong support level and then started retracing back upward.
Once the broken support turned into new resistance, a spinning top candle formed at the level.
This formation signals hesitation from buyers during the retracement phase. Sellers defended the resistance level, and the spinning top reflected the end of bullish momentum inside the pullback.
In this case, the pattern acts as a bearish continuation signal because it suggests that the downtrend may continue after the temporary retracement ends.
When the spinning top forms at a key level during a pullback in a trending market, it can provide high-probability continuation setups for trend-following traders.
Spinning Top vs Doji Candlestick Pattern
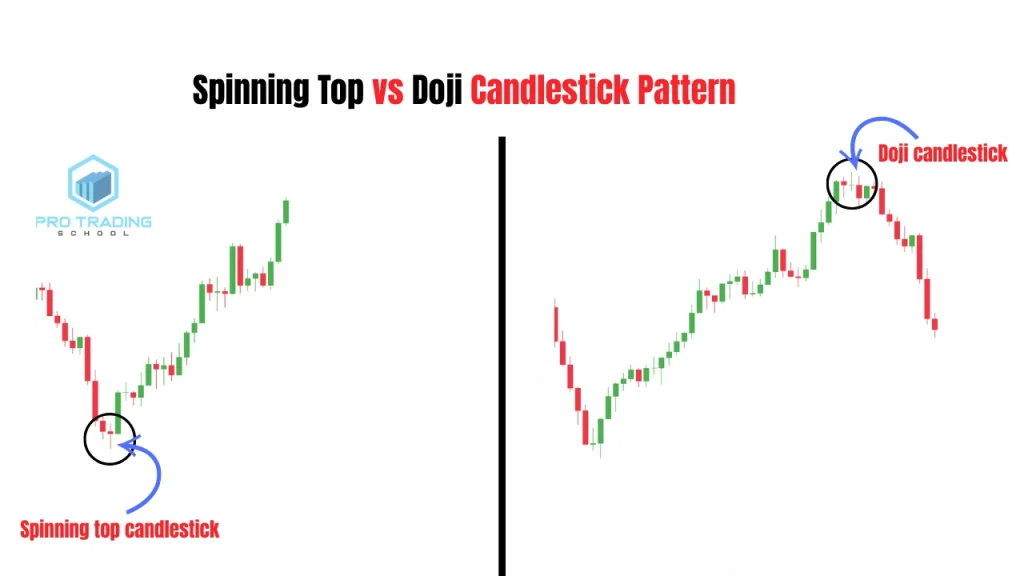
The spinning top and the doji candlestick are both neutral candlestick patterns that reflect market indecision.
Because they look similar on the chart, many beginner traders confuse them. However, there are important differences between the two formations.
Spinning Top Candlestick
A spinning top candle has a small real body that can be either bullish (green) or bearish (red).
This small body shows that one side slightly gained control before the trading session closed. If the candle closes above the opening price, buyers technically win the session. If it closes below the opening price, sellers gain a slight advantage.
However, the long upper and lower shadows reveal that both buyers and sellers were active during the session, creating hesitation and uncertainty in the market.
Even though one side wins the battle, the pattern still reflects indecision because the victory is weak and lacks strong momentum.
Doji Candlestick
The doji candlestick pattern reflects an even stronger balance between buyers and sellers.
The market opens, moves higher and lower during the session, and then closes almost exactly at the opening price. This creates a candle with an extremely small body or no visible body at all.
Unlike the spinning top, the doji indicates that neither buyers nor sellers were able to gain control by the end of the session.
This perfect balance often signals:
-market hesitation
-a temporary pause in momentum,
-or a potential trend reversal depending on the market context.
What Is the Main Difference Between a Spinning Top and a Doji?
The main difference is the size of the real body.
- A spinning top has a small visible body.
- A doji has almost no real body because the opening and closing prices are nearly identical.
Both candlestick patterns indicate indecision, but the doji generally reflects a stronger level of equilibrium between bulls and bears.
If you want to learn more about patterns similar to the spinning top, check out the doji candlestick pattern.
Spinning Top vs Pin Bar Candlestick
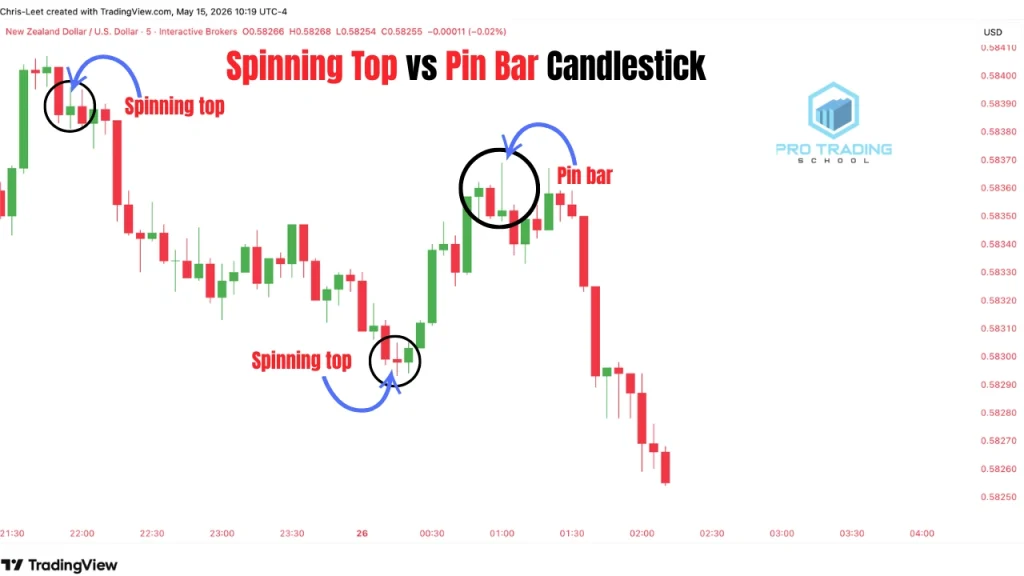
The spinning top and the pin bar are both popular candlestick patterns used in price action trading. However, they have completely different structures and market meanings.
Understanding the difference between these two candles can help traders avoid confusion and identify stronger trading opportunities.
Spinning Top Candlestick
The spinning top candle has a small real body located near the center of the candle, with upper and lower shadows on both sides.
This structure reflects indecision and uncertainty in the market because both buyers and sellers pushed price during the session, but neither side gained strong control.
Depending on the market context, the spinning top can act as:
- a bullish signal,
- a bearish signal,
- a continuation pattern,
- or a reversal pattern.
This is why traders always analyze the location of the spinning top before making trading decisions.
Pin Bar Candlestick
The pin bar candlestick has a completely different anatomy.
Unlike the spinning top, the pin bar has:
- a small body positioned near one end of the candle,
- and one long dominant wick.
This structure reflects a strong rejection of price and a shift in momentum between buyers and sellers.
Bearish Pin Bar
If the small body forms near the bottom of the candle with a long upper wick, the pattern is considered a bearish pin bar.
This formation shows that buyers pushed the market higher, but sellers aggressively rejected the move and took control before the candle closed.
When this bearish rejection candle appears at the end of an uptrend or near a strong resistance level, it can signal a potential bearish reversal.
It can also act as a bearish continuation signal when it forms during a downtrend after a retracement to a resistance level or a broken support level that turned into resistance.
Bullish Pin Bar
If the small body forms near the top of the candle with a long lower shadow, the pattern becomes a bullish pin bar.
This structure indicates that sellers pushed price lower during the session, but buyers regained control and forced the market back upward before the candle closed.
When the bullish pin bar appears at the end of a downtrend or near a key support level, it can signal a bullish reversal.
The pattern can also act as a continuation signal during an uptrend when price retraces back to a support level or a broken resistance level that turned into support.
Main Difference Between a Spinning Top and a Pin Bar
The main difference between the two patterns is the message behind the candle structure.
- The spinning top reflects indecision and balance between buyers and sellers.
- The pin bar reflects strong rejection and a shift in market control.
This is why pin bars are generally considered stronger directional signals than spinning tops, especially when they form at important market levels.
If you want to learn more about powerful candlestick reversal patterns, check out pin bar strategies that work.
How to Trade the Spinning Top Candlestick Pattern
There are many strategies that can be used to trade the spinning top candlestick pattern, but you need to understand that the spinning top is only a candlestick signal. On its own, it is not enough to make a trading decision.
Like most candlestick patterns, the spinning top becomes more reliable when combined with other technical analysis tools such as support and resistance levels, market structure, trend analysis, volume, and confirmation candlesticks.
In this section, we will cover three different trading strategies that can be used with the spinning top candlestick pattern to identify potential market reversals and continuation setups.
Trading the Spinning Top with Support and Resistance
The first strategy consists of trading the spinning top candlestick pattern with support and resistance levels.
Look at the chart example below. As you can see, the market is trending upward. Price breaks above a resistance level and then pulls back.
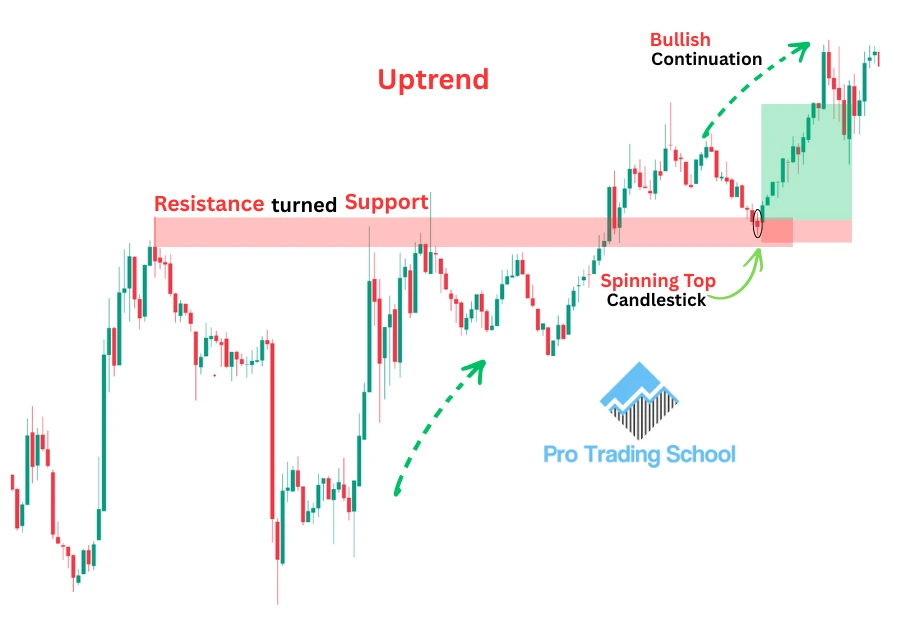
Once the market retraces back to the broken resistance level, a clear spinning top candlestick pattern appears.
This pattern indicates the end of the retracement and the potential beginning of a new impulsive move in the direction of the uptrend.
In this setup, you can place your entry at the close of the spinning top candle, a stop-loss below the pattern, and target the next resistance level.
Now look at another chart example. Here, the market is trending downward, which means sellers are in control.
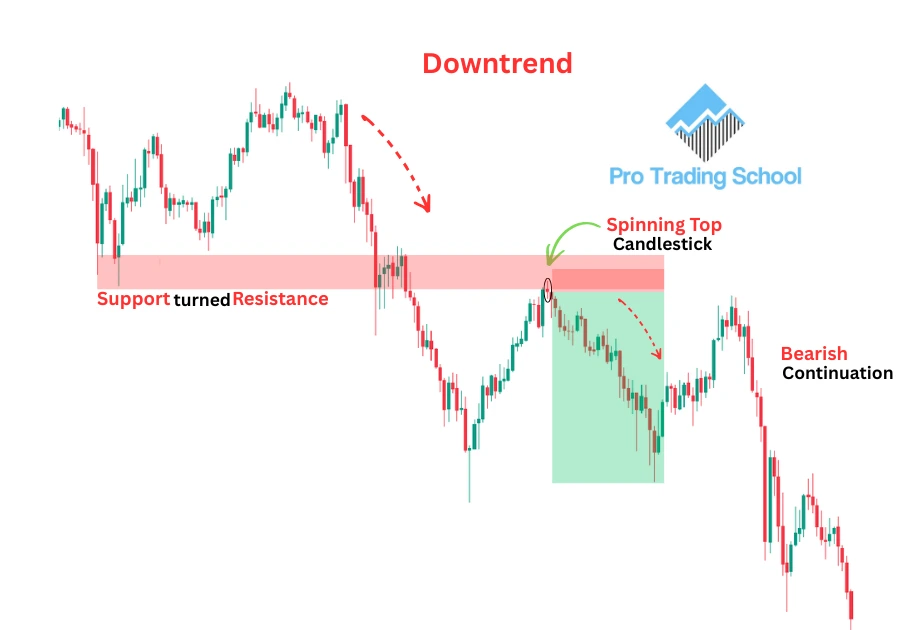
The market breaks below a support level and then retraces back to it. Once price reaches the broken support level, a spinning top candlestick pattern forms.
This setup signals the end of the pullback and the potential beginning of a new bearish move in line with the downtrend.
In this case, you can place your entry at the close of the spinning top candle, a stop-loss above the pattern, and target the next support level.
Look at what happened next — the market moved downward and reached the target as expected.
Trading the Spinning Top with Moving Averages
This strategy is based on two moving averages: the 50 exponential moving average (EMA) and the 200 exponential moving average (EMA).
The 200 EMA is used to identify the overall market trend and give an idea about the higher time frame direction, while the 50 EMA acts as a dynamic support or resistance level.
Look at the chart example below. As you can see, the market is trending downward below the 200 exponential moving average.
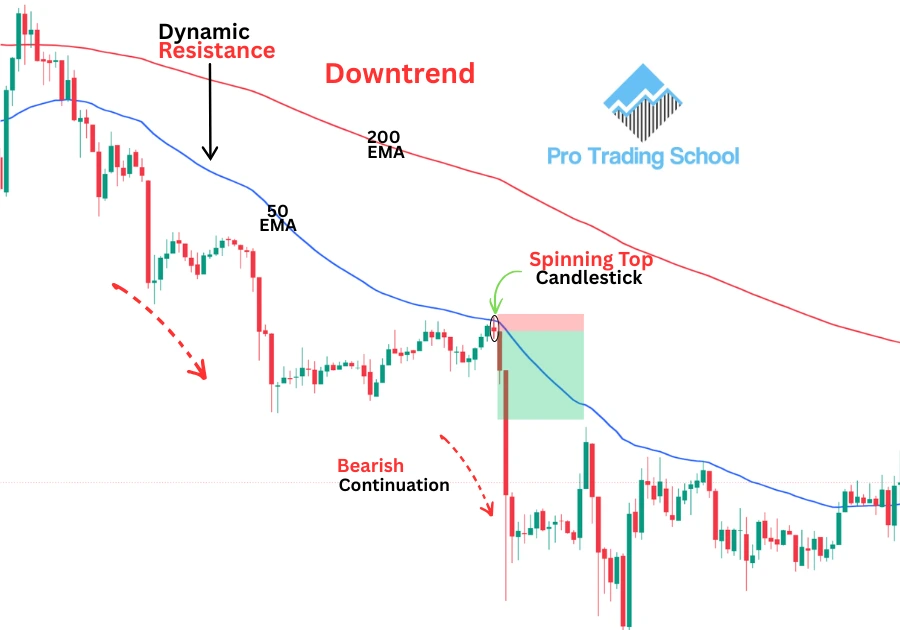
When price trades below the 200 EMA, it is a strong indication that the market is in a downtrend.
Now look at what happened next. The market retraced back toward the 50 exponential moving average, which acted as a dynamic resistance level. Once price reached the 50 EMA, a spinning top candlestick pattern appeared.
This spinning top pattern acts as a potential continuation signal in line with the downtrend. In this setup, you can place your entry at the close of the spinning top candle, a stop-loss above the pattern, and target the next support level.
The same concept can also be applied during an uptrend.

When the market trades above the 200 exponential moving average, the 50 EMA can act as a dynamic support level.
If a spinning top candlestick pattern forms at the 50 EMA, it may signal the end of the pullback and the continuation of the bullish trend.
Trading the Spinning Top Pattern with Supply and Demand Zones
This strategy combines the power of supply and demand zones with the spinning top candlestick pattern.
All you need to do is identify and draw your supply or demand zones, then wait for the spinning top candle to form at one of these important areas.
Look at the chart example below.
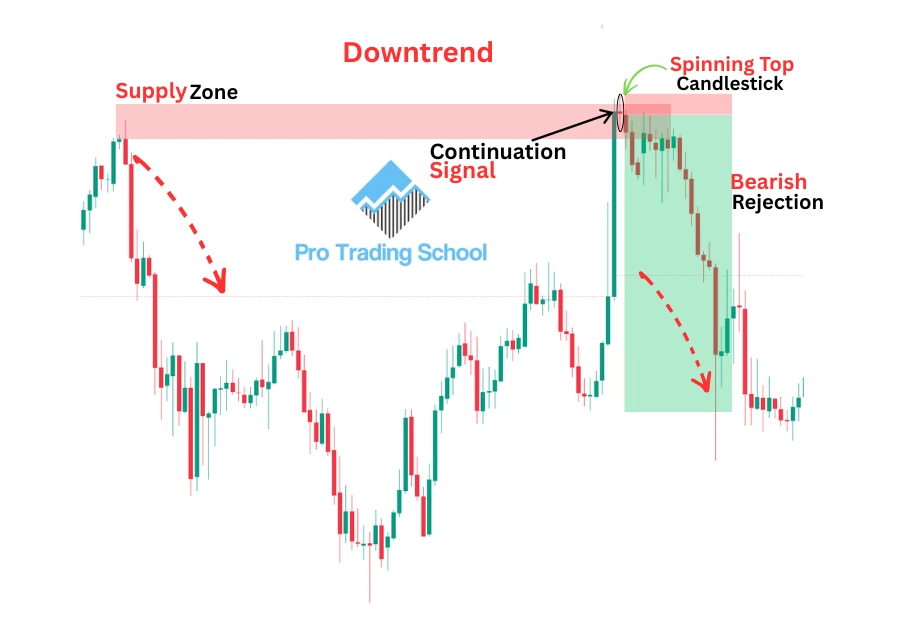
As you can see, the market formed a strong supply zone. Once price retraced back to retest the zone, a spinning top candlestick pattern appeared.
This pattern signals that the supply zone is still valid and that a new bearish move is likely to occur.
In this setup, you can place your entry at the close of the spinning top candle, a stop-loss above the supply zone, and target the next support level.
Look at what happened next — the market moved downward and reached the target as expected.
Trading the Spinning Top During a Range-Bound Market
During a range-bound market, the market is in equilibrium. Price moves between support and resistance levels, and the best trading opportunities are usually located near these boundaries.
This is where the spinning top candlestick pattern can become very useful.
Look at the chart example below:
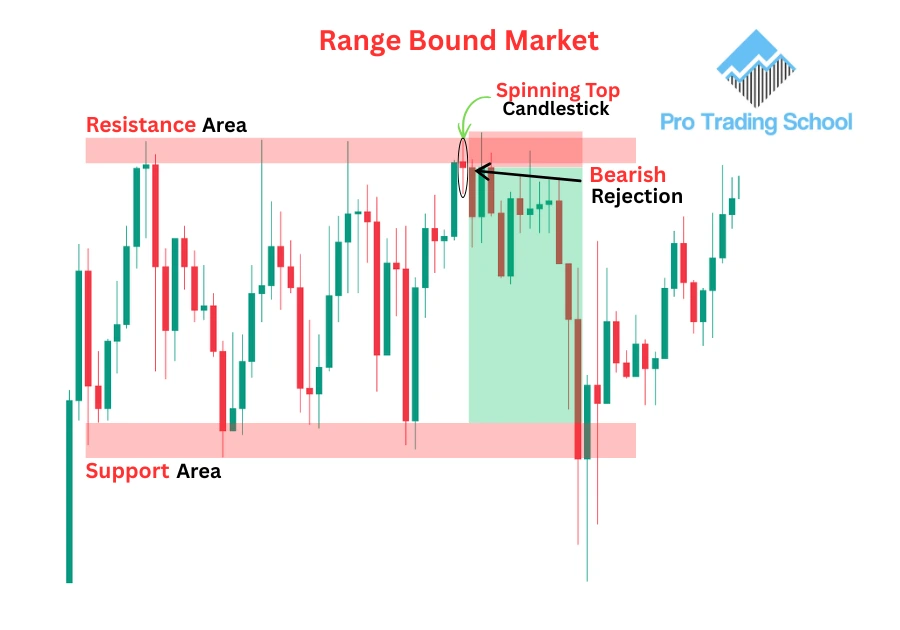
As you can see, the market is clearly trading inside a range between a support level and a resistance level.
Once price moved toward the resistance level, a spinning top candlestick pattern appeared. This pattern indicates that the market was rejected from the resistance zone and that price is likely to move downward toward the support level.
In this setup, you can place your entry at the close of the spinning top candle, a stop-loss above the pattern, and target the next support level.
Look at what happened next — the market moved downward and reached the target as expected.
Pros and Cons of the Spinning Top Candlestick Pattern
Like any candlestick pattern in trading, the spinning top candlestick pattern comes with both advantages and limitations.
Understanding the pros and cons of the spinning top pattern is important because it helps traders know when the setup is reliable and when additional confirmation is needed.
In the table below, we will break down the main advantages and disadvantages of trading the spinning top candlestick pattern.
| Pros of the Spinning Top Candlestick Pattern | Cons of the Spinning Top Candlestick Pattern |
| Helps identify market indecision between buyers and sellers | Weak signal when traded alone |
| Can be used in trending and range-bound markets | Requires confirmation from other tools or candlesticks |
| Easy to recognize on trading charts | Can produce false signals |
| Works well with support and resistance levels | Meaning depends heavily on market context |
| Can improve trade timing when combined with confluence | Appears very frequently, leading to low-quality setups |
| Useful with moving averages and supply and demand zones | Not reliable in choppy market conditions |
| Can signal potential reversals or trend continuations | Beginners may misinterpret the pattern |
| Suitable for multiple time frames and markets | Risky without proper risk management |
Conclusion
The spinning top candlestick pattern is a valuable signal that reflects hesitation and balance between buyers and sellers.
Even though the pattern may appear simple, its real strength comes from the market context in which it forms.
When combined with support and resistance levels, moving averages, supply and demand zones, trend analysis, and confirmation candles, the spinning top candlestick pattern can help traders identify high-probability reversal and continuation opportunities.
However, traders should avoid using the spinning top pattern as a standalone signal. Like all candlestick formations, it works best when supported by multiple factors of confluence and proper risk management.
The key is not just recognizing the spinning top on the chart, but understanding the psychology behind the pattern and how the market reacts around important price levels.










Thank you for the insights you provided. They are really nuggets to me, and has opened my understanding to reading the candles.
As a beginner, thank you Pro Trading School. This is very informative, now I know and understand the different types of candlestick and their language..
I love to learn more.