The Evening Star candlestick pattern is a powerful bearish reversal signal that appears at the top of an uptrend and indicates a potential shift in market control from buyers to sellers.
In simple terms, it shows that buying pressure is weakening, momentum is fading, and sellers are gradually stepping in to take control of the market. When this transition happens, it often marks the beginning of a potential downward move.
This pattern is widely used by traders to anticipate trend reversals and identify high-probability selling opportunities.
However, it becomes significantly more reliable when combined with other confluence factors such as key resistance levels, liquidity zones, market structure breaks, or volume confirmation.
When correctly identified in the right context, the Evening Star can serve as an early warning signal that the bullish trend is losing strength and that a new bearish phase may be starting.
Table of Contents
Key Takeaways
- The Evening Star candlestick pattern is a bearish reversal signal that appears after an uptrend and suggests a possible shift from buyers to sellers.
- It reflects a loss of bullish momentum, where buying pressure weakens and sellers begin to take control of the market.
- The pattern is most powerful when it forms at a key resistance level or after a strong impulsive bullish move.
- It should not be traded in isolation — its accuracy increases when combined with confluence factors such as market structure shifts, liquidity zones, or volume confirmation.
- When properly identified, the Evening Star can help traders anticipate the start of a potential downtrend early, improving entry timing for sell opportunities.
- Like all candlestick patterns, its effectiveness depends on context, not just the shape itself.
The Anatomy of the Evening Star Candlestick Pattern

The Evening Star candlestick pattern is formed by a sequence of three consecutive candles, each one reflecting a gradual shift in market sentiment from bullish confidence to bearish control.
The first candle is a strong bullish candle, showing that buyers are still fully in control and pushing the price higher with conviction.
The second candle is a small-bodied candle, often a doji or a weak candle. This candle represents market hesitation and indecision, where buying pressure starts to fade and the market pauses after the previous upward move.
The third candle is a strong bearish candle, which confirms the reversal. It typically closes below the midpoint of the first bullish candle, signaling that sellers have taken control and momentum has shifted to the downside.
The Psychology Behind the Evening Star Candlestick Pattern

The Evening Star candlestick pattern sends a clear message when it appears at the end of an uptrend: the balance of power in the market is changing.
Understanding the psychology behind this formation is essential because it helps you interpret what the market is really doing, not just what the candles look like.
At the beginning, the market is in a clear uptrend, meaning buyers are fully in control and pushing prices higher with confidence.
This bullish environment is then reinforced by the first candle of the pattern — a strong bullish candle — which confirms that buyers are still dominant and the trend appears intact.
The situation starts to change with the second candle, usually a small-bodied candle or doji. This candle reflects uncertainty and indecision in the market.
Buyers are no longer pushing aggressively, and sellers are beginning to step in quietly. At this stage, neither side has full control, which signals that the bullish momentum is weakening.
Finally, the third candle — a strong bearish candle closing below the midpoint of the first candle — confirms a decisive shift in sentiment.
This move shows that sellers have taken control, overpowering buyers and signaling that the market is likely transitioning into a bearish reversal phase.
In short, the Evening Star is not just a pattern — it is a story of buyer exhaustion, indecision, and eventual seller dominance unfolding step by step on the chart.
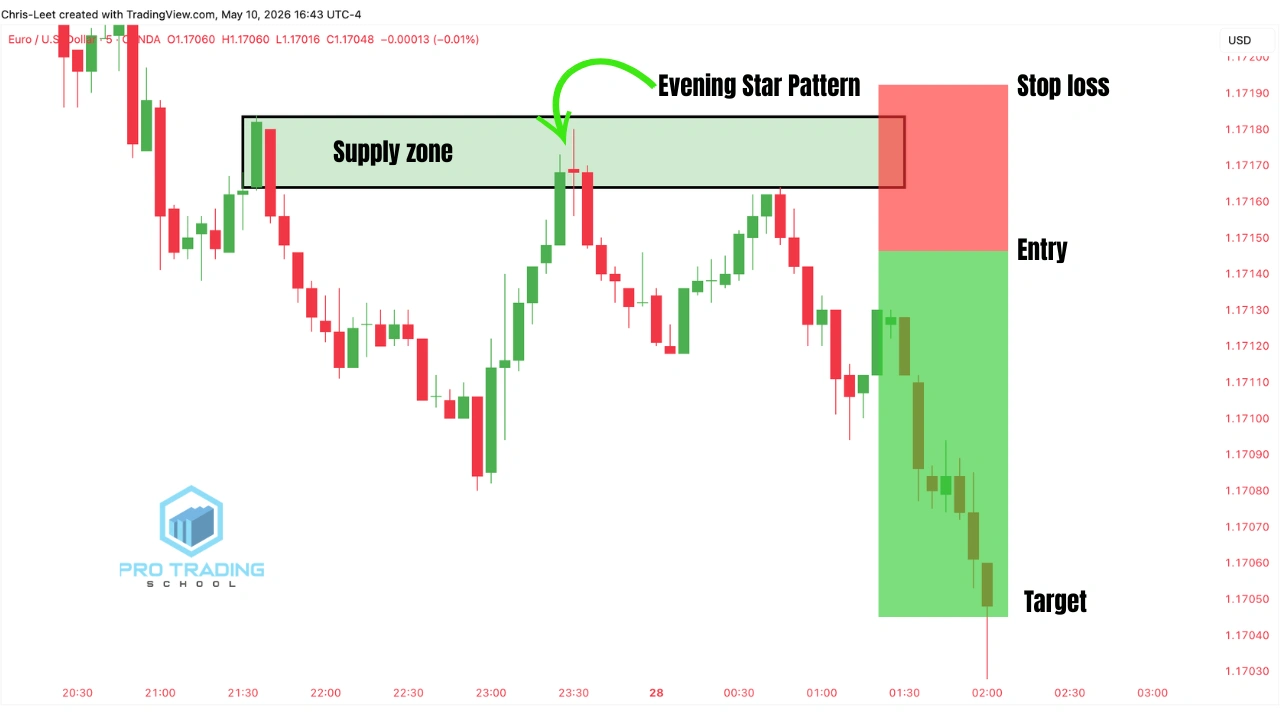
Evening Star Candlestick Pattern Example

As you can see in the chart above, this is a clear example of an Evening Star candlestick pattern forming after a sustained uptrend, right into a well-defined resistance level.
In this situation, the market had been moving upward with strong bullish momentum. However, price reaches the resistance area and fails to break it on multiple attempts.
This repeated rejection is an early sign that buyers are losing strength and momentum is fading.
The appearance of the Evening Star pattern at this level confirms that shift in sentiment. The sequence of candles reflects a clear transition: bullish control weakens, hesitation appears, and finally sellers step in with enough strength to take over.
This often signals that a market reversal may be starting, especially when combined with a strong resistance zone.
However, the Evening Star is not a holy grail. Like any candlestick pattern, it has limitations and can produce false signals if used in isolation.
That’s why context is essential — market structure, resistance levels, and overall trend must always be considered.
This example is for educational purposes only, designed to help you visually recognize the pattern and understand how it behaves in real market conditions, so you can identify it more easily on your own charts.
If you want to learn more reversal and continuation formations, check out this complete candlestick patterns cheat sheet covering 33 powerful chart patterns used by professional traders.
How to trade using the evening star pattern?
To trade the Evening Star candlestick pattern effectively, it should never be used alone. Professional traders combine it with other technical analysis tools to increase the probability of success and filter out weak setups.
Some of the most common confluence factors used with the Evening Star include:
- Key resistance levels
- Fibonacci retracement levels
- Trendlines
- Moving averages
- Bollinger Bands
When these elements align with the Evening Star formation, the setup becomes much stronger and more reliable.
In this section, we will break down several Evening Star trading strategies step by step, so that by the end of this article, you will have a clear understanding of how traders use this pattern in real market conditions.
1-Trading the Evening Star After a Retest of Key Resistance
Look at this chart example
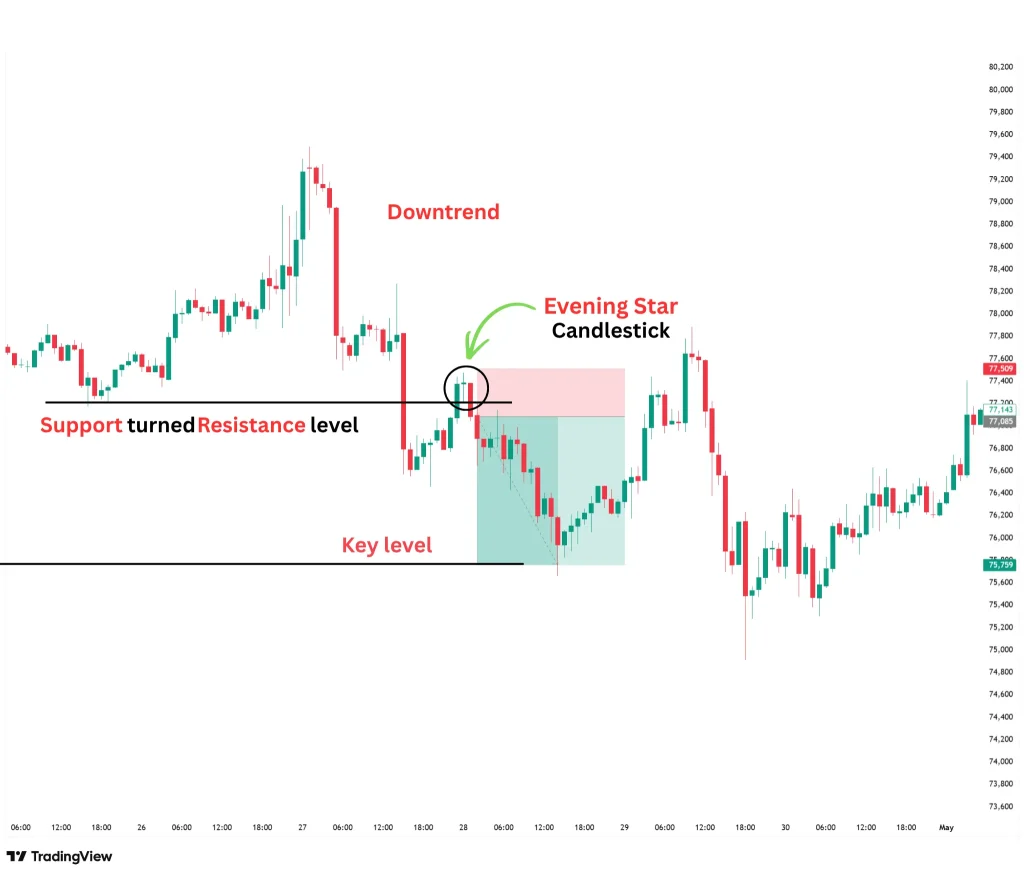
As you can see, the market is in a downtrend. Price breaks a previous support level, then pulls back to retest it. Once broken, this level now acts as a new resistance zone.
When price retraces back into this resistance, an Evening Star candlestick pattern forms. This is a strong confirmation that the pullback is losing momentum and that the market is ready to resume its downward move.
This sequence often signals the end of the retracement phase and the beginning of a new bearish continuation.
How to take this trade
- First, check the higher time frame (HTF) to confirm that the overall market structure is aligned with your setup on the trading time frame.
- If the higher time frame is also bearish, this adds strong confluence to your idea.
- Enter the trade at the close of the third bearish candle of the Evening Star pattern.
- Place your stop loss above the resistance level / high of the pattern.
Target the next key support level where price is likely to react.
2-The Evening Star Candlestick Pattern with the 50% and 61.8% Fibonacci Retracements
Look at this chart example

As you can see, the market is in a strong downtrend, meaning sellers are clearly in control. After the impulsive bearish move, the market begins to retrace upward as buyers temporarily step in.
To measure this pullback, you draw the Fibonacci retracement tool from the start of the bearish impulse to its end. This helps you identify key reaction zones, especially the 50% and 61.8% retracement levels, where price often reacts.
When price reaches these Fibonacci levels, the market enters a critical decision area. In this example, an Evening Star candlestick pattern forms directly at the Fibonacci zone, confirming that the retracement is losing strength.
This combination signals that the pullback is likely over and that the market is ready to resume its bearish trend, starting a new move downward.
How to take this trade
- Place your entry at the close of the third candle of the Evening Star pattern for confirmation.
- Set your stop loss above the high of the pattern or above the Fibonacci resistance zone.
- Target the next key support level, where price is likely to react or consolidate.
- Always confirm with the higher time frame trend before taking the trade, to ensure alignment and increase probability of success.
3-The Evening Star with the 50 Moving Average
Look at this chart example

As you can see, the market is in a downtrend, and the 50 moving average (yellow line) is acting as a dynamic resistance level. In this type of environment, price tends to pull back into the moving average and often gets rejected before continuing lower.
This creates a clear trading opportunity: we wait for the market to retrace back into the 50 moving average and watch for price action confirmation. If a clear Evening Star candlestick pattern forms at this level, it becomes a strong signal that sellers are stepping back in and rejecting the pullback.
In this example, when price retests the moving average, it gets rejected and forms a clean Evening Star pattern. This confirms the end of the retracement phase and signals the potential start of a new bearish move downward.
How to take this trade
- First, confirm that the higher time frame trend is also bearish, in line with your setup.
- Enter the trade at the close of the Evening Star pattern forming near the 50 moving average.
- Place your stop loss above the moving average and the high of the pattern.
- Set your target at the next key support level.
- Always aim for at least a 2:1 risk-to-reward ratio to ensure long-term profitability.
4-Trading the Evening Star with Trendlines
Now look at this chart example below:

As you can see, the market is in a clear downtrend, allowing us to draw a well-respected bearish trendline connecting the lower highs.
As price retraces upward to retest the trendline, the market begins to lose bullish momentum. At the trendline resistance, a well-formed Evening Star candlestick pattern appears, signaling that sellers are stepping back into the market.
This formation indicates that the retracement toward the trendline is likely ending and that the market may be preparing to resume its bearish move downward.
How to trade this setup:
- First, check the higher time frame trend to ensure that it aligns with your trading setup.
- If the higher time frame is also bearish, this adds stronger confirmation to the trade.
- Enter the trade at the close of the third candle of the Evening Star pattern.
- Place your stop loss above the trendline resistance and the high of the pattern.
- Set your target at the next key support level, where price is likely to react.
5-Trading the Evening Star with Bollinger Bands
This strategy combines two powerful elements: the upper Bollinger Band and the Evening Star candlestick pattern.
The upper Bollinger Band often acts as a dynamic resistance level. When price reaches this area and an Evening Star pattern forms, it can signal that bullish momentum is weakening and that sellers are beginning to take control.
To use this strategy, first apply the Bollinger Bands indicator to your chart based on the timeframe you are trading. Then wait for price to move upward and either touch or slightly reject from the upper Bollinger Band.
Look at the chart example below:

As you can see, price moves higher and reaches the upper Bollinger Band. At this area, a clear Evening Star candlestick pattern forms and gets rejected, signaling a potential bearish move.
This rejection from the upper band, combined with the Evening Star formation, provides a strong indication that the market may reverse or continue lower.
How to trade this setup
- Enter the trade at the close of the third candle of the Evening Star pattern.
- Place your stop loss above the high of the setup and the upper Bollinger Band rejection area.
- Set your target at the next key support level.
- As always, confirm the setup with the higher time frame trend before taking the trade.
Want to learn the bullish version of this pattern? Check out our Morning Star Candlestick Pattern: 3 Powerful Trading Strategies guide.
Pros and Cons of the Evening Star Candlestick Pattern
The Evening Star candlestick pattern is not a holy grail, and it should never be used in isolation. On its own, it is just a signal — not a guarantee.
For better accuracy, it must be combined with other confluence factors such as key resistance levels, liquidity zones, Fibonacci retracements, moving averages, or clear market structure shifts.
In addition, always analyze the higher time frame direction to ensure that your setup is aligned with the broader market trend. This alignment significantly increases the probability of a successful trade.
Critical reminder:
Even the most perfect-looking Evening Star setup in trading history can fail. No pattern works 100% of the time. That is why proper risk management is essential, including always using a stop loss and never risking too much on a single trade.
The table below summarizes the main pros and cons of the Evening Star candlestick pattern, helping you understand both its strengths and limitations.
| Pros | Cons |
| Provides a clear bearish reversal signal after an uptrend | Can produce false signals in choppy or sideways markets |
| Can also act as a bearish continuation signal during pullbacks in a downtrend | Requires confirmation (not reliable in isolation) |
| Helps identify trend exhaustion early | Less effective without proper market structure context |
| Works well at key resistance zones, supply areas, or Fibonacci levels | Entry timing can be subjective for beginner traders |
| Can be combined with tools like moving averages, Fibonacci, or structure shifts for higher accuracy | Appears frequently, but not all setups are high-probability trades |
| Offers clear risk management levels (stop above pattern high) | Performance depends heavily on overall trend and location in the market |
Frequently Asked Questions About the Evening Star Candlestick Pattern
Is the Evening Star bullish or bearish?
The Evening Star candlestick pattern is a bearish signal. It can act as both a bearish reversal pattern and a bearish continuation pattern, depending on the market context.
When the Evening Star forms at the top of an uptrend, especially near a key resistance level, it often signals a potential bearish reversal, indicating that buyers are losing control and sellers may take over.
However, when the pattern appears during a downtrend after a retracement toward a resistance area, it can act as a bearish continuation signal, suggesting that the pullback is ending and the market is likely to continue moving lower.
What is a good stop loss for the Evening Star pattern?
A good stop loss for the Evening Star candlestick pattern depends on the market conditions and the volatility of the asset you are trading.
Some markets move very aggressively, making extremely tight stop losses risky because price fluctuations can easily stop you out before the trade moves in your direction. Other markets move more slowly, allowing for tighter and more controlled stop loss placement.
In general, the safest approach is to place your stop loss above a key resistance level or above the high of the Evening Star pattern. This helps protect your trade while also giving the market enough room to fluctuate naturally.
By placing the stop loss above a significant level, you create a clear invalidation point: if price breaks above that resistance area, it is a strong sign that the bearish setup may no longer be valid.
Can the Evening Star pattern fail?
Yes, the Evening Star candlestick pattern can fail, even when it forms in the right market conditions and appears perfectly structured.
Like all trading patterns, the Evening Star is not a holy grail. No candlestick pattern works 100% of the time, which is why proper risk management is essential in trading.
That is also why traders should always use a stop loss in case the market moves against the setup unexpectedly.
In the long run, successful trading is not about winning every Evening Star trade. What truly matters is your money management — how much you make when the setup works in your favor compared to how much you lose when it fails.
A trader can still be profitable even with losing trades, as long as losses are controlled and winning trades are allowed to grow properly.
Conclusion
The Evening Star candlestick pattern is a powerful bearish signal that can help traders identify potential market reversals and bearish continuation opportunities.
It reflects a shift in momentum from buyers to sellers and can provide high-probability setups when used in the right market conditions.
However, the Evening Star is not a holy grail and should never be traded alone. For better accuracy, it should always be combined with other factors of confluence such as resistance levels, trendlines, Fibonacci retracements, moving averages, or higher time frame analysis.
Most importantly, always use proper risk management and a stop loss, because even the strongest setups can fail. In trading, long-term success comes from discipline, consistency, and managing risk correctly, not from winning every trade.










outstanding teaching keep it up thank you so deeply God bless you