
A hanging man candlestick pattern is a bearish reversal signal that forms at the end of an uptrend, indicating that selling pressure is increasing and a potential downward trend may begin.
Anatomy of the Hanging Man Pattern
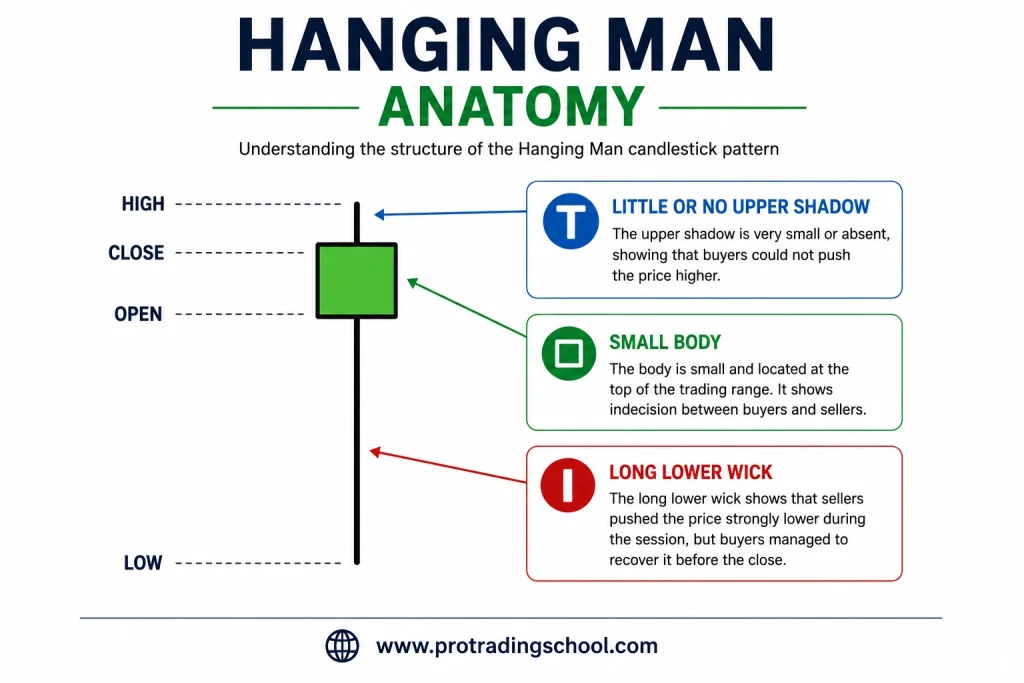
The hanging man candlestick has three key components that reveal the underlying market behavior:
1. The Long Lower Wick
The lower wick is long and shows that sellers were able to push the price significantly lower during the session.
This reflects a conflict between buyers and sellers:
- Sellers drove the market down aggressively
- Buyers stepped in and pushed the price back up before the close
This rejection of lower prices signals hidden selling pressure and potential weakness in the uptrend.
2. The Small Body
The body represents the difference between the opening and closing prices.
In a hanging man pattern:
- The body is small
- It is located near the top of the candle
- It can be bullish (green) or bearish (red)
This shows that although buyers managed to recover the price, they are no longer in full control of the market.
3. Little or No Upper Shadow
The hanging man has little to no upper wick, meaning the price did not move significantly above the opening level.
This indicates that:
- Buyers were unable to push the price higher
- The market mostly traded between the open and close after rejecting lower prices
This lack of upward momentum further confirms the loss of bullish strength.
Key Takeaway
The long lower wick shows strong selling pressure, while the small body and weak upper movement indicate that buyers are losing control — creating a warning signal of a potential bearish reversal.
Psychology Behind the Hanging Man Pattern
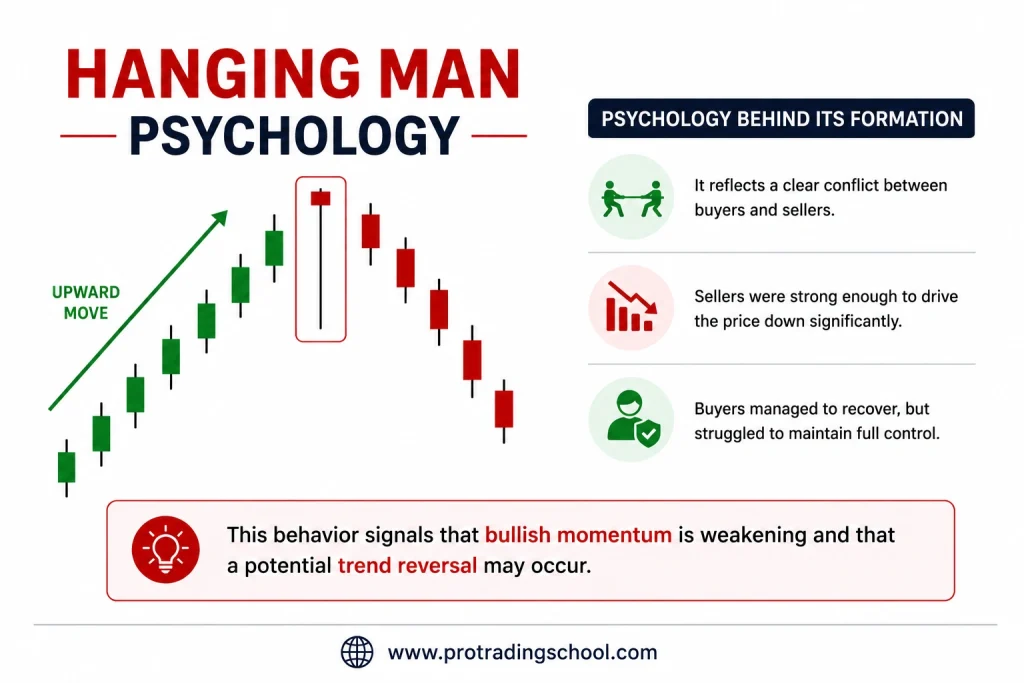
The hanging man candlestick reveals the battle between buyers and sellers during a specific time period.
It forms during an uptrend and typically opens near the high, sometimes moving slightly higher at the beginning of the session. This creates the impression that buyers are still in control.
However, the key moment comes next.
During the same session, the market drops sharply, forming a long lower wick. This move shows that sellers are stepping in aggressively and attempting to reverse the trend — this is the most important part of the pattern.
Later, buyers push the price back up, and the candle closes near its opening price or slightly above it.
What This Means
This price action reflects a clear conflict between buyers and sellers:
- Sellers were strong enough to drive the price down significantly
- Buyers managed to recover, but struggled to maintain full control
This behavior signals that bullish momentum is weakening and that a potential trend reversal may occur.
Pro Insight
Even though the candle closes near the top, the long lower wick reveals that sellers have already entered the market.
This hidden selling pressure is often an early warning that the uptrend is losing strength and may reverse soon.
If you want to learn more bullish and bearish formations, check out this complete candlestick patterns cheat sheet covering 33 important chart patterns used in technical analysis.
Hanging Man Candlestick Pattern Example
The chart example below shows exactly how the hanging man candlestick pattern forms in real market conditions.
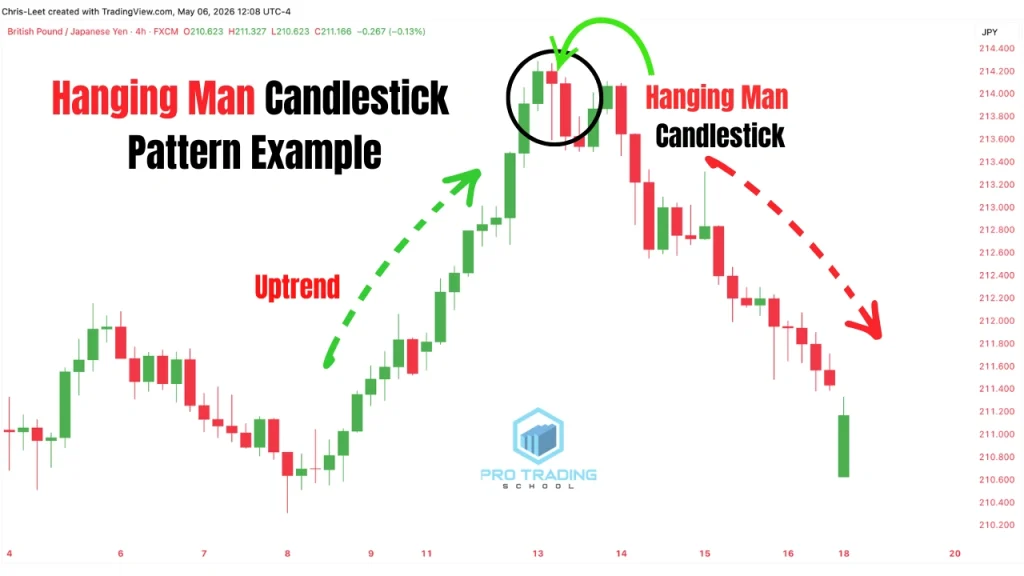
As you can see in the chart above, the market was trending upward, which means that buyers were in control of the market.
Then, a hanging man candlestick pattern appears.
The formation of this pattern signals that buyers are starting to lose momentum.
The long lower wick shows that sellers were strong enough to push the market sharply downward during the session, even though buyers managed to recover part of the move before the candle closed.
This reflects increasing selling pressure and weakening bullish strength.
As you can see, after the formation of the hanging man candlestick pattern, the market started moving downward as buyers lost control and sellers took over.
However, this chart example is only meant to show how the pattern appears on a real chart.
Trading the hanging man pattern alone is not enough to make trading decisions.
So keep reading, because in the next sections of this guide, you will learn exactly how to identify, confirm, and trade this high-probability candlestick pattern correctly.
If you want to learn another powerful bearish reversal candlestick pattern, make sure to check out our complete guide on the Shooting Star candlestick pattern. This pattern is very similar to the hanging man pattern and can help you spot potential market reversals with more confidence.
How to Trade the Hanging Man Candlestick Pattern (Step-by-Step)
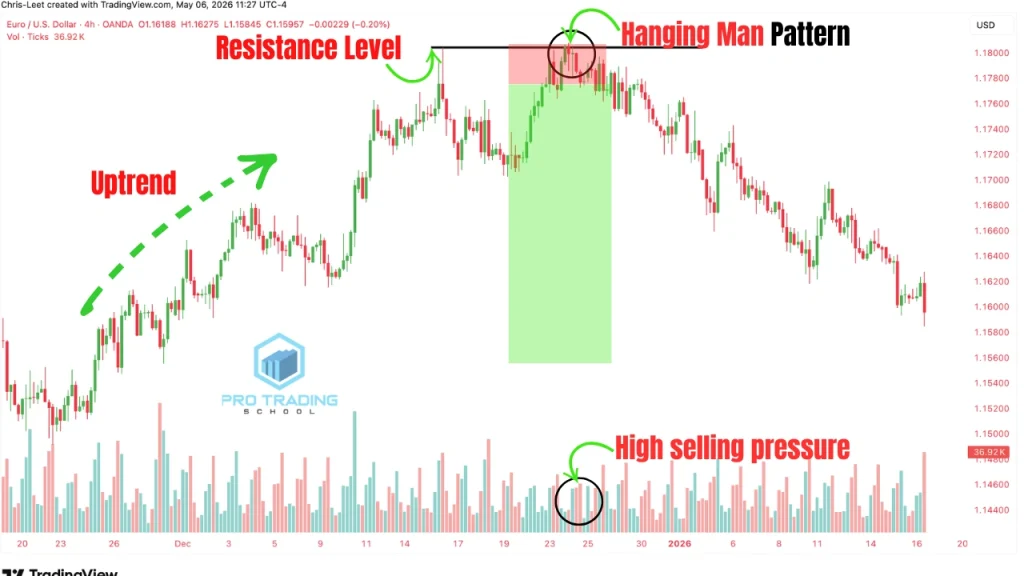
To trade the hanging man candlestick pattern effectively, follow these structured steps:
1. Identify the Trend
The hanging man is a bearish reversal pattern, and it should only be traded at the end of an uptrend.
An uptrend is defined by a series of:
- Higher highs
- Higher lows
This structure shows that buyers are in control of the market.
However, when a hanging man forms, it signals that this dominance is weakening and that buyers are starting to lose confidence, increasing the probability of a trend reversal.
2. Identify a Key Resistance Level
The hanging man should never be traded alone.
It is only a warning signal and must appear under the right market conditions.
The best condition:
- At a key resistance level after an uptrend
This indicates:
- Buyers pushed the market up
- Price reached a strong level
- Buyers failed to break above it
This failure shows that buyers are losing strength.
When the market retraces back to retest the resistance level and a hanging man forms, it confirms that selling pressure is increasing and a reversal is likely.
3. Confirm the Hanging Man Pattern
Before entering a trade, you must confirm that the candle is a valid hanging man.
A valid hanging man has:
- A small body at the top
- A long lower wick
- Little or no upper shadow
This structure confirms that sellers were active during the session.
4. Use Volume as a Confluence Factor
Volume adds an extra layer of confirmation.
If the hanging man forms with:
- Increased selling volume
This indicates strong participation from sellers.
This increases the probability of a bearish reversal.
5. Perform Top-Down Analysis
Even if everything looks perfect on your trading timeframe, you must always analyze the higher timeframe.
Why this matters:
A setup that looks bearish on a lower timeframe may only be a small retracement on a higher timeframe.
Without this step, you risk getting trapped.
| Trading Timeframe | Higher Timeframe to Check |
| 1 Minute | 15 Minutes |
| 5 Minutes | 30 Minutes |
| 15 Minutes | 1 Hour |
| 1 Hour | Daily |
| 4 Hours | Weekly |
Always align your trade with the higher timeframe trend.
6. Entry Strategies
Once all conditions are met, you have two entry options:
Aggressive Entry
Enter immediately at the close of the hanging man candle.
Why it’s aggressive:
- No confirmation
- Higher risk of false signals
- Early entry before market confirmation
Conservative Entry (Recommended)
Wait for the next candle to:
- Close below the low (wick) of the hanging man
Why this is better:
- Confirms seller strength
- Reduces false signals
- Increases trade probability
7. Stop Loss and Target
- Stop Loss: Above the hanging man or above the resistance level
- Target: The next support level
The hanging man is not a signal to enter blindly — it’s a warning that requires confirmation.
To avoid false setups and improve your consistency, use the checklist below to validate every trade before execution.
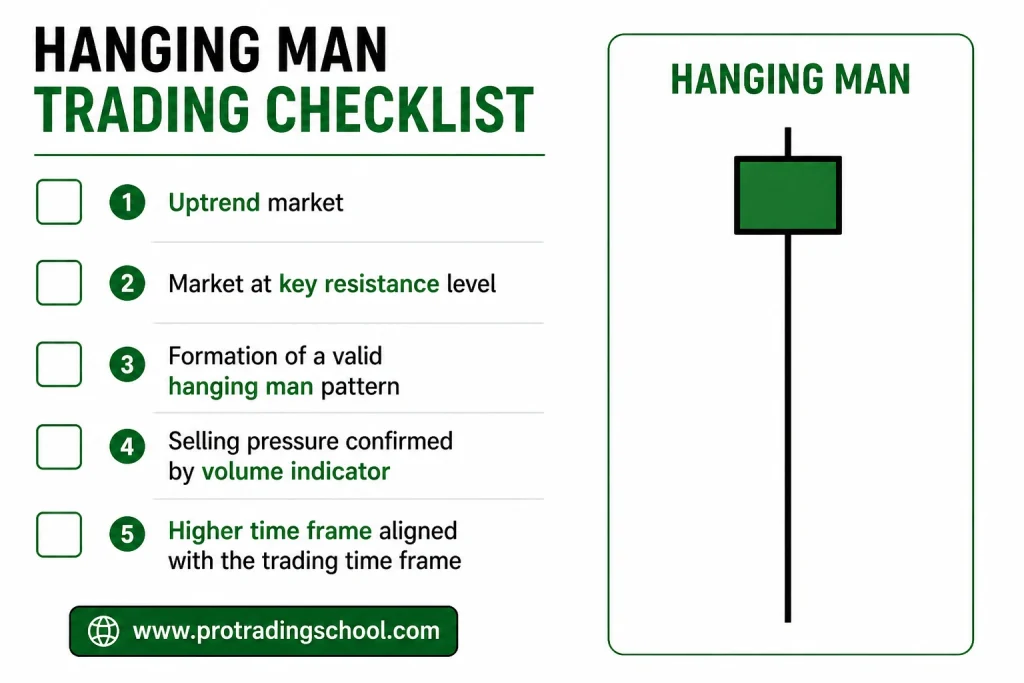
If most of these conditions are met, the setup is considered high probability.
The Hanging Man Candlestick Pattern in Combination With Bollinger Bands
Bollinger Bands are a technical indicator traders use to measure market volatility and identify whether the market is potentially overbought or oversold.
The indicator consists of:
- an upper band,
- a middle band,
- and a lower band.
There are many ways traders use Bollinger Bands.
But in this strategy, we will focus mainly on:
- the upper band as a potential overbought area,
- and the lower band as a potential oversold area.
The idea behind this setup is simple.
We wait for the market to reach the upper Bollinger Band after a strong uptrend.
Then, we look for a hanging man candlestick pattern to form near that area.
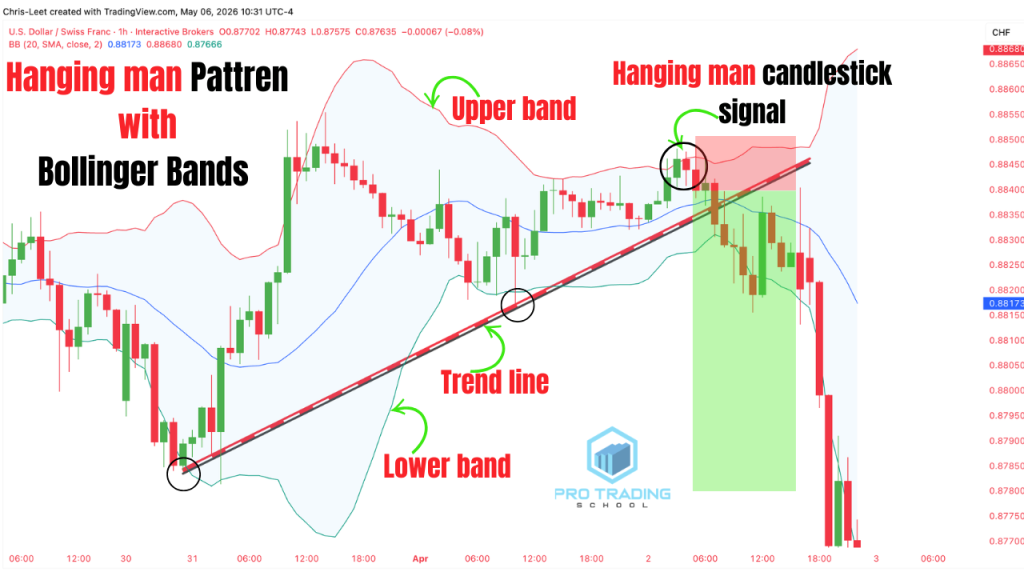
Why is this important?
Because when price reaches the upper band, it often signals that the market has become overextended to the upside.
And when a hanging man forms at the same time, it shows that buyers are beginning to lose momentum and that selling pressure is entering the market.
This combination creates a strong warning that a bearish reversal may occur.
Confirmation Entry
The hanging man alone is not enough.
We still need confirmation before entering the trade.
One confirmation method is to wait for the next candle to close below the low of the hanging man pattern.
This confirms that sellers are gaining control and that the market may start moving lower.
At this point, traders can look for a short-selling opportunity.
Trend Line Confirmation
Another powerful confirmation technique is the trend line breakout.
As you can see in the chart above, you can draw a trend line connecting the higher lows during the uptrend.
If the market breaks below the trend line after the hanging man forms, this becomes an additional confirmation that the bullish trend is weakening.
The breakout of the trend line signals a potential trend reversal and increases the probability of the trade.
This allows traders to enter the market with more confidence instead of relying on the candlestick pattern alone.
Key Takeaway
The combination of:
- the hanging man candlestick pattern,
- the upper Bollinger Band,
- and a trend line breakout
creates a powerful bearish reversal setup.
The Bollinger Bands help identify an overextended market.
The hanging man reveals weakening buyer strength.
And the trend line breakout confirms that momentum may be shifting from buyers to sellers.
The Hanging Man Candlestick Pattern With RSI Divergence
The hanging man candlestick pattern becomes even more powerful when combined with RSI divergence.
This combination helps traders identify high-probability bearish reversal opportunities with more precision.
What Is the RSI Indicator?
RSI stands for Relative Strength Index.
It is a technical indicator created by J. Welles Wilder Jr. and is used to measure the speed and strength of price movements on a scale from 0 to 100.
Generally:
- when the RSI moves above 70, the market is considered overbought,
- and when the RSI drops below 30, the market is considered oversold.
However, in this strategy, we will not rely on overbought and oversold levels alone.
Instead, we will focus on RSI divergence.
What Is RSI Divergence?
A bearish RSI divergence occurs when:
- the market continues moving upward and forms higher highs,
- while the RSI indicator starts moving downward and forms lower highs.
This creates a contradiction between price action and momentum.
In simple words:
Price is still going up…
but momentum is weakening.
And this often becomes an early warning that buyers are losing strength and that a bearish reversal may be approaching.
Why the Hanging Man Makes the Setup Stronger
The RSI divergence alone is not enough.
We still need confirmation from price action.
This is where the hanging man candlestick pattern becomes extremely powerful.
When a hanging man forms during a bearish RSI divergence, it signals that:
- buyers are struggling to maintain control,
- selling pressure is increasing,
- and the market may be preparing for a downward reversal.
The long lower wick of the hanging man reveals that sellers were already able to push the market lower during the session.
This adds strong confirmation to the divergence signal.
How to Trade the Setup
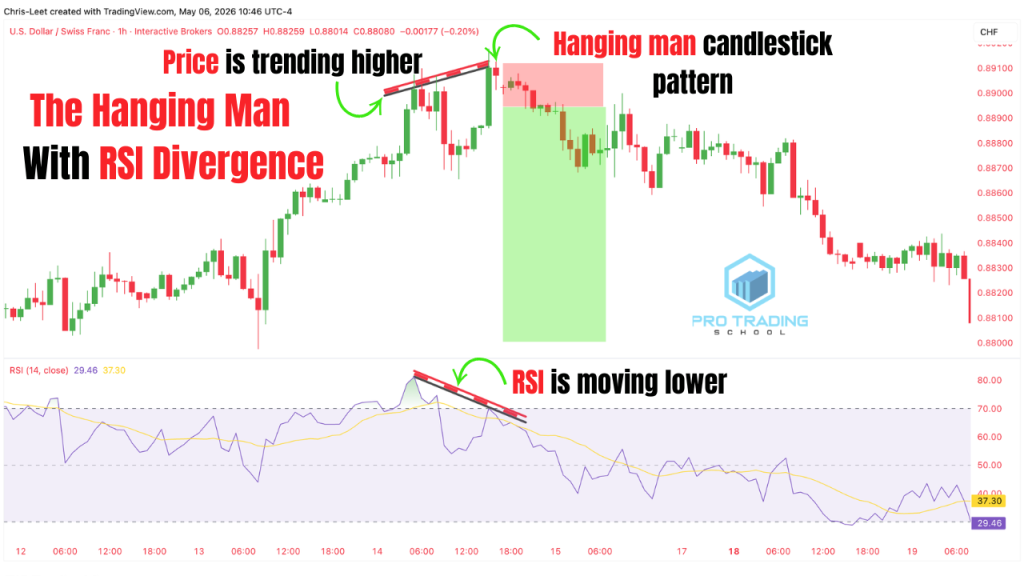
The strategy is simple:
- Identify a strong uptrend
- Wait for the RSI to form a bearish divergence
- Look for a hanging man candlestick pattern near a key resistance level
- Wait for confirmation:
- either a bearish candle closing below the hanging man,
- or another bearish confirmation signal
Once confirmation appears:
- enter the trade,
- place the stop loss above the hanging man,
- and target the next support level.
The chart above shows exactly how to combine RSI divergence with the hanging man candlestick pattern to identify high-probability sell setups.
As you can see:
- the market continues pushing upward,
- while the RSI starts moving lower,
- creating a clear bearish divergence.
Then, a hanging man candlestick forms at the top of the trend.
This signals weakening bullish momentum and increasing seller activity.
And shortly after the confirmation candle appears, the market reverses to the downside exactly as expected.
How to Trade the Hanging Man Candlestick Pattern With a Supply Zone
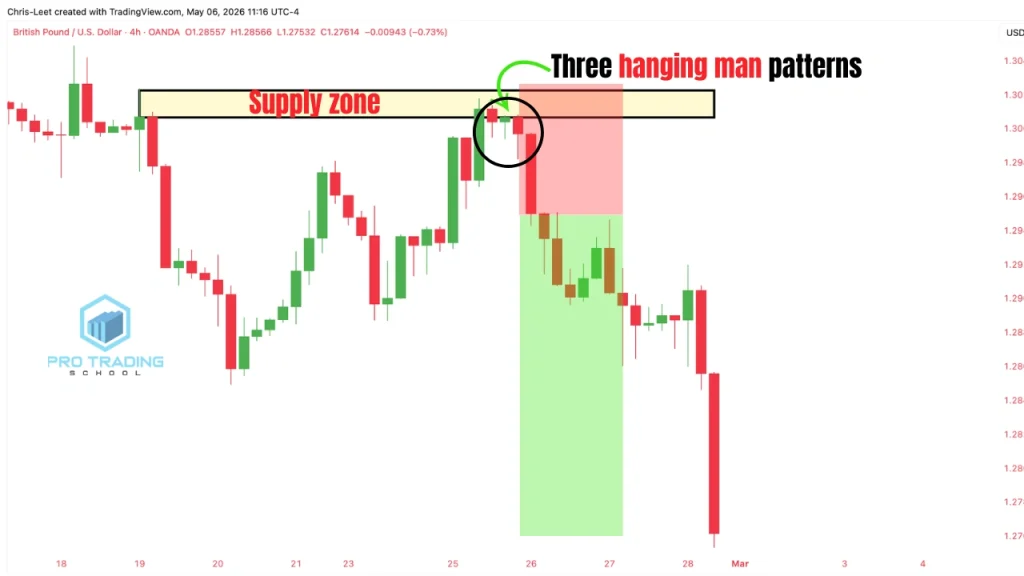
To combine the hanging man candlestick pattern with a supply zone, we first identify the strong bearish move and draw the supply zone, as shown in the chart above.
Then we patiently wait for the market to retrace back toward the zone.
Now pay close attention to what happens next.
As you can see, once the market reaches the supply zone, three consecutive hanging man candlestick patterns form.
This is very important.
Why?
Because it shows that buyers and sellers are fighting for control at a major institutional area.
The repeated formation of hanging man patterns signals that buyers are struggling to continue pushing the market higher.
Among the three patterns, the last hanging man is the most important one because it represents the final rejection before the market reverses.
The safest way to enter the trade is to wait for confirmation.
As shown in the chart, the confirmation comes when a strong bearish candle breaks below the low of the last hanging man.
At this point:
- sellers are gaining control,
- bullish momentum is weakening,
- and the probability of a bearish move increases significantly.
This is where traders can look for a short-selling opportunity.
You can place:
your entry after the close of the bearish confirmation candle,
your stop loss above the supply zone or above the hanging man,
and your target at the next support level.
Why This Strategy Works
This strategy works because it combines two powerful bearish concepts:
- the supply zone,
- and the hanging man candlestick pattern.
The supply zone reveals an area where institutions previously sold aggressively.
The hanging man confirms that buyers are weakening during the retest of that zone.
And the bearish confirmation candle validates that sellers are taking control of the market again.
Instead of relying on the candlestick pattern alone, this approach allows traders to trade with market context and institutional logic, which greatly increases the probability of the setup.
Pros and Cons of the Hanging Man Candlestick Pattern
The hanging man candlestick pattern is not a magic signal that works every single time.
Like every trading pattern, it has its strengths and weaknesses.
Understanding both sides is essential before using it in real market conditions.
The table below highlights the main pros and cons of the hanging man candlestick pattern.
| Pros | Cons |
| Easy to identify on charts | Can produce false signals |
| Provides early bearish reversal signals | Weak when traded alone |
| Works on all financial markets | Requires confirmation before entry |
| Can be used on multiple timeframes | Less reliable on lower timeframes |
| Works well with confluence factors | Requires patience and discipline |
| Offers strong risk-to-reward opportunities | Not a complete trading strategy |
| Helps identify weakening buyers | Can fail during strong bullish trends |
| Beginner-friendly candlestick pattern | Market noise can create fake setups |
What Is the Difference Between the Hanging Man and the Hammer Pattern?
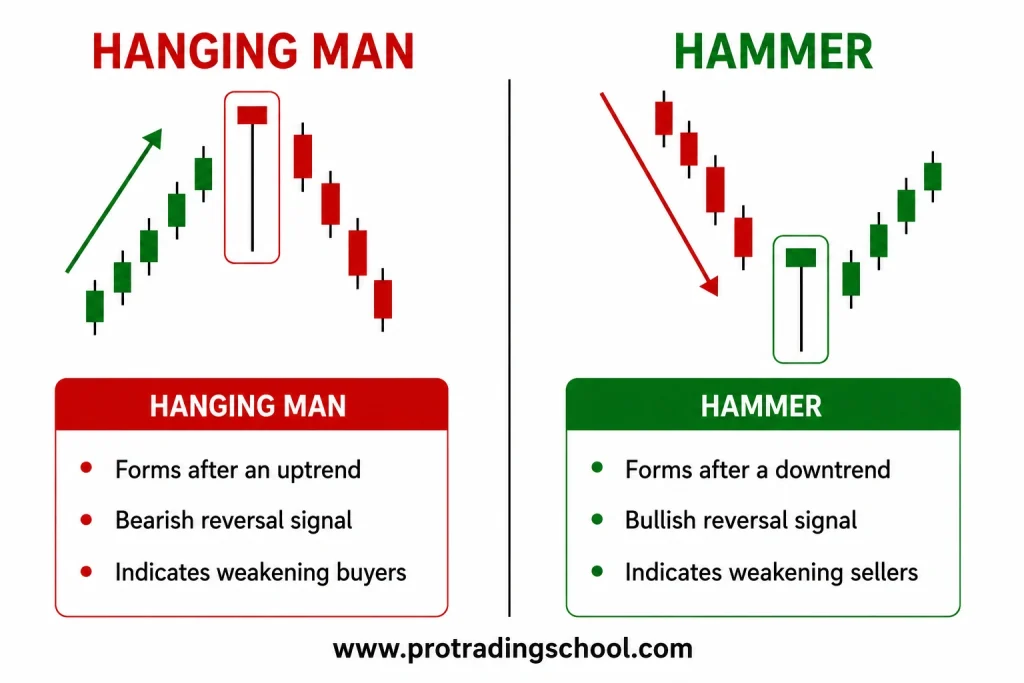
The hanging man and the hammer candlestick patterns have a very similar appearance.
Both patterns have:
- a small body near the top,
- a long lower wick,
- and little or no upper shadow.
However, the most important difference between them is not the shape…
It is the location where the pattern forms.
The Hanging Man Pattern
The hanging man is a bearish reversal candlestick pattern that forms at the end of an uptrend.
It signals that buyers are beginning to lose strength and may no longer be able to keep pushing the market higher.
During the session, sellers manage to push the price strongly downward, creating the long lower wick.
Even though buyers recover part of the move before the close, the pattern reveals hidden selling pressure and weakening bullish momentum.
When the hanging man forms near:
- a resistance level,
- a supply zone,
- or another key bearish area,
it can provide a high-probability sell signal.
The Hammer Pattern
The hammer is a bullish reversal candlestick pattern.
It has almost the same anatomy as the hanging man pattern.
But what makes it different is the market context and where it appears on the chart.
The hammer forms at the end of a downtrend.
It signals that sellers are losing control and that buyers may be preparing to reverse the market upward.
During the session:
- sellers push the market aggressively lower,
- but buyers step in strongly and recover the price before the close.
This rejection of lower prices shows increasing buying pressure.
When the hammer forms near:
- a support level,
- a demand zone,
- or another key bullish area,
it becomes one of the strongest bullish reversal candlestick signals and should be taken seriously.
You can also check out our detailed guide on the Hammer Candlestick Pattern to learn how traders identify bullish reversal opportunities in the market.
Key Difference
The main difference between the hanging man and the hammer is the trend direction and location of the pattern.
Hanging Man
- Forms after an uptrend
- Bearish reversal signal
- Indicates weakening buyers
Hammer
- Forms after a downtrend
- Bullish reversal signal
- Indicates weakening sellers
Even though both patterns look nearly identical, their meaning completely changes depending on where they appear in the market structure.
Conclusion
The hanging man candlestick pattern is a powerful bearish reversal signal when used in the right market context.
However, the pattern should never be traded alone.
Combining it with:
- key resistance levels,
- supply zones,
- volume,
- RSI divergence,
- and confirmation signals
can significantly improve the quality of your trading setups.
Remember:
The goal is not to trade every hanging man pattern.
The goal is to trade only the high-probability setups supported by strong market confluence and proper risk management.










Good mornings Chris
Thank you for all the effort and info much appreciated.
Unbeatable school of trade have ever met.
With simple clear analysis and well explosive explanations.
Well done sir.