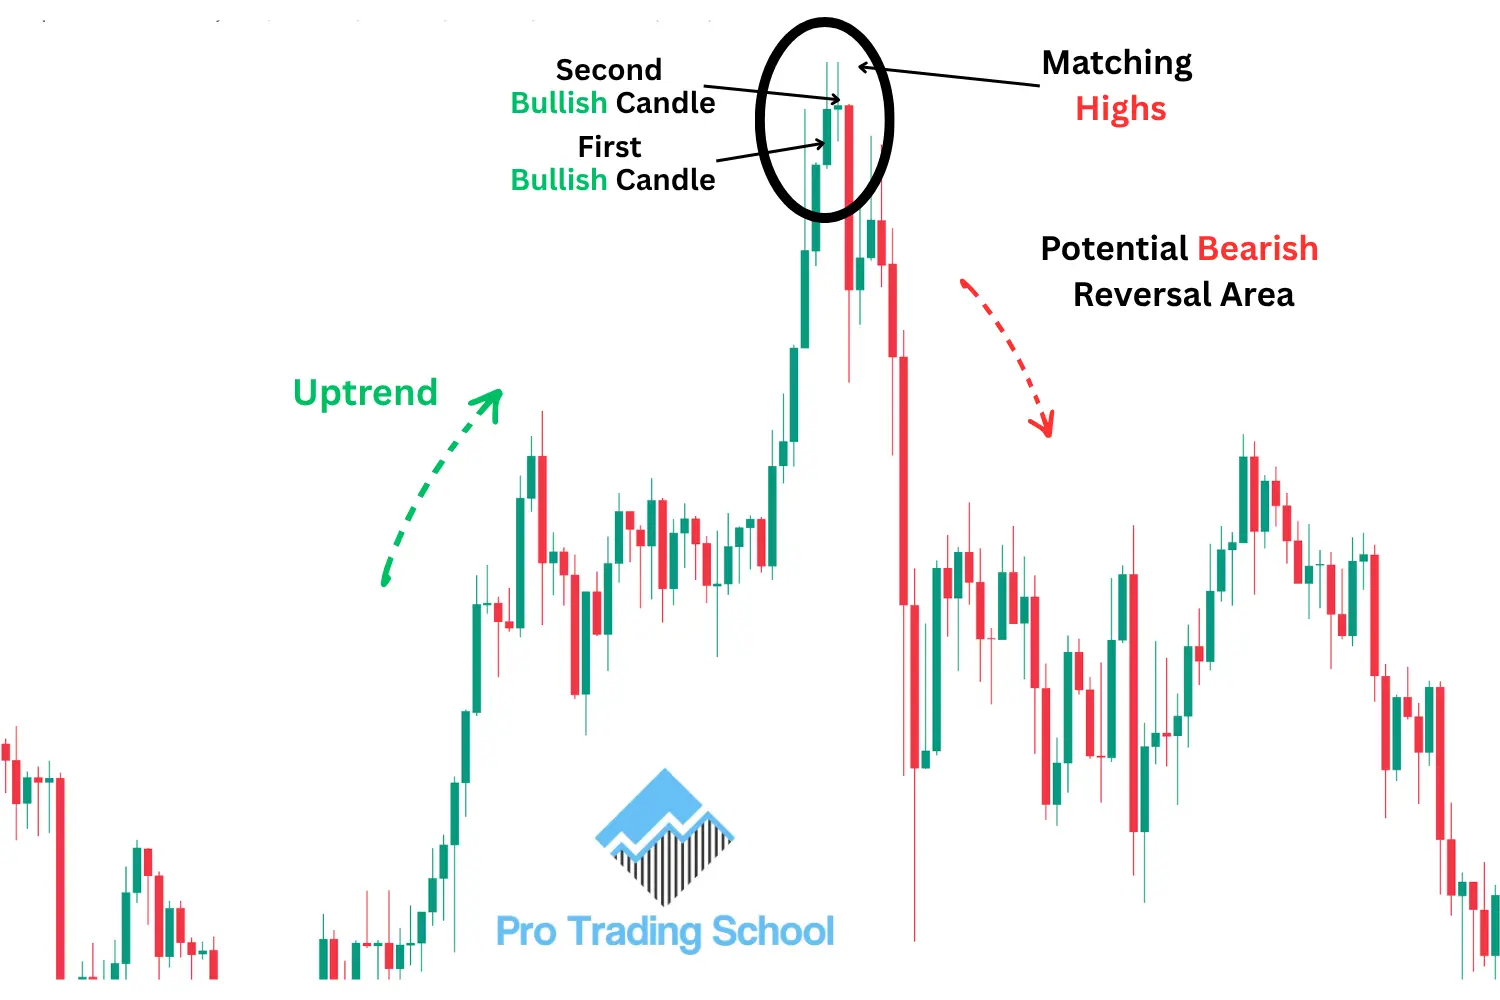
The Matching High candlestick pattern is a bearish reversal pattern that typically forms at the end of an uptrend.
It consists of two bullish candlesticks that reach approximately the same high, showing that buyers attempted to push the price higher twice but failed to break through the same price level.
The first candle is a bullish candle that forms as buyers continue to drive the market upward. The second candle is also bullish, but its high matches or comes very close to the high of the first candle.
When the Matching High pattern appears after an uptrend, it suggests that the market has tested the same price level twice and been rejected.
This indicates that buying pressure may be weakening and that sellers are beginning to defend the level.
As a result, the Matching High can warn traders that the existing uptrend is losing momentum and that a bearish reversal or price correction may follow, particularly when the pattern forms near an important resistance or supply zone.
In this guide, you will learn what the Matching High candlestick pattern is, how to identify it, the psychology behind its formation, and practical ways to trade it using resistance levels.
Matching High Candlestick Pattern Example
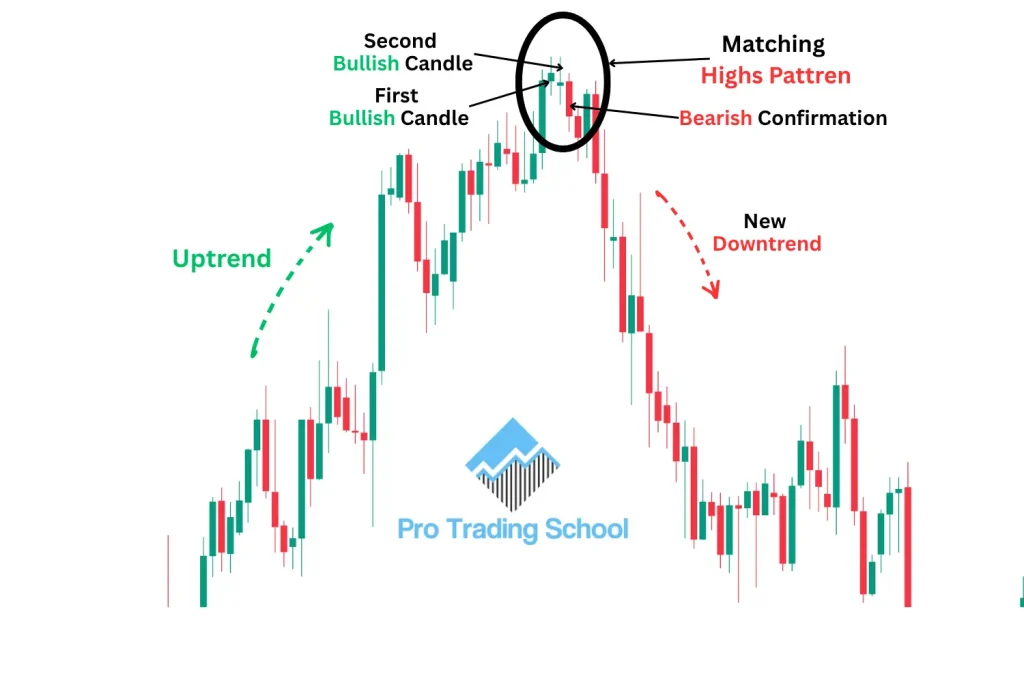
In the chart example above, you can clearly see a Matching High candlestick pattern forming at the end of an uptrend.
First, the market moves upward, showing that buyers are in control and successfully pushing prices higher.
Then, a Matching High pattern forms. In this example, the pattern consists of two Doji candlesticks.
As you may already know, a Doji represents indecision in the market, showing that neither buyers nor sellers were able to take full control during the trading session.
What is particularly important here is that the highs of both candles are approximately equal. The market reaches the same price level twice but fails to break above it.
Some explanations of the Matching High pattern focus on matching closing prices. However, in this article, we focus on the matching highs themselves: the key idea is that price tests approximately the same high twice and gets rejected both times.
This repeated rejection tells us something important about market psychology. Buyers tried twice to push the price above the same level but failed. This suggests that buying pressure is weakening and sellers are beginning to defend that price level.
Since the pattern forms after an uptrend, this failure can warn us that the bullish move is losing momentum and that a bearish reversal may follow.
And that is exactly what happens in this example. After forming the Matching High pattern, the market reverses and moves downward.
However, the formation of a Matching High pattern alone is not enough to justify a trade. Traders should look for additional confirmation by combining the pattern with other technical analysis tools, such as support and resistance levels, trendlines, or supply and demand zones.
If you want to explore more candlestick formations, check out our 33 Candlestick Patterns Cheat Sheet (Simple Visual Guide) to learn the most important bullish and bearish patterns and how to identify them on a chart.
Matching High Candlestick Psychology
Knowing the anatomy of the Matching High candlestick pattern is important because it helps you identify the pattern correctly on a price chart.
However, understanding the psychology behind the Matching High pattern is even more valuable because it explains what is actually happening between buyers and sellers and why a bearish reversal may occur.
Look at the chart below, which illustrates the market psychology behind the formation of the Matching High pattern.
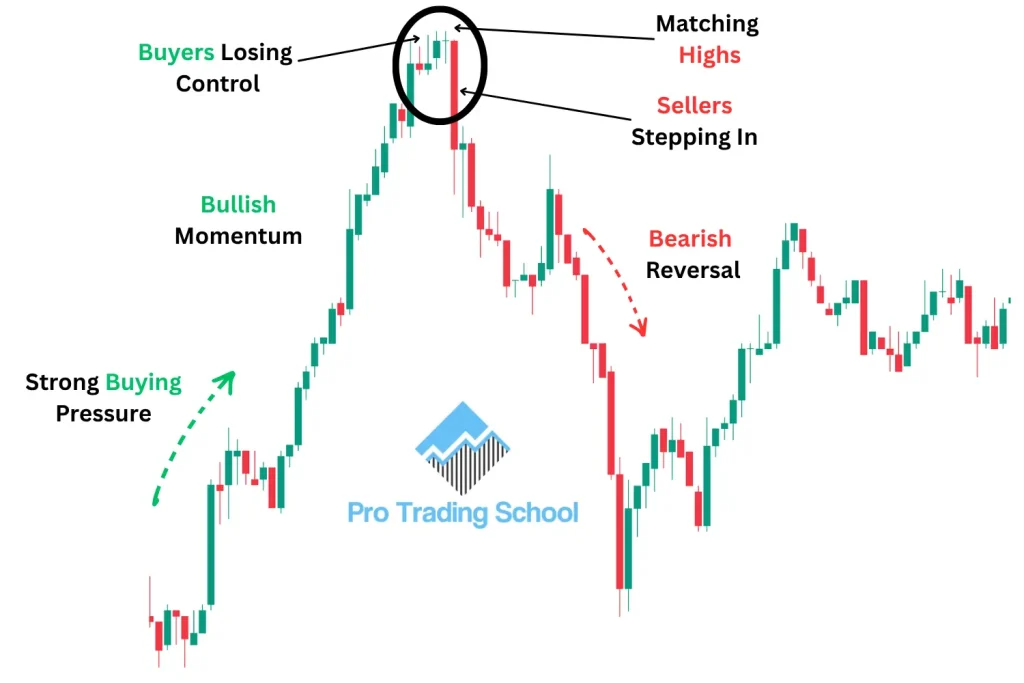
Before the pattern forms, the market is already in an uptrend. Buyers are in control, consistently pushing prices higher and creating bullish momentum.
When the first candle of the Matching High pattern forms, buyers attempt to continue the upward move and push the price to a new high.
However, sellers react at that level and prevent the price from moving significantly higher. This creates the first rejection and tells us that selling pressure is beginning to appear.
The second candle provides even more information.
Buyers make another attempt to push the market higher, but price reaches approximately the same high as the previous candle and is rejected again. In other words, buyers attack the same price level twice but fail to break through it.
The first high represents the initial rejection from sellers, while the second matching high confirms that sellers are actively defending the same price area.
This repeated rejection reveals an important shift in market psychology. Buyers are still trying to continue the uptrend, but they are beginning to struggle.
At the same time, sellers are becoming more aggressive and preventing buyers from establishing a new high.
You can think of the Matching High as a battle between buyers and sellers:
- Buyers attack the level for the first time → sellers reject the move.
- Buyers attack the same level again → sellers reject them again.
- A strong bearish candle forms afterward → sellers begin to take control.
The bearish candle that forms after the Matching High is particularly important because it can provide additional confirmation that the balance of power is shifting from buyers to sellers.
If price starts breaking below the lows of the Matching High candles, it provides stronger evidence that sellers have won the short-term battle and that a move downward may begin.
Therefore, the psychology behind the Matching High pattern is not simply about finding two candles with equal highs. It is about recognizing two failed attempts by buyers to continue the uptrend and the repeated rejection of those attempts by sellers.
When this behavior occurs after an extended uptrend, especially near a resistance level or supply zone, the Matching High pattern can provide an early warning that bullish momentum is weakening and that a bearish reversal or correction may be developing.
Matching High Trading Strategies
The Matching High candlestick pattern can be combined with different technical analysis concepts to identify potential bearish reversals. In this guide, we will focus on one simple approach: trading the Matching High pattern at a resistance level.
Trading the Matching High at a Resistance Level
The idea behind this strategy is simple: instead of trading every Matching High pattern you see, look for the pattern when it forms at the end of an upward move and around a clear resistance level.
A resistance level is an area where the market has previously struggled to move higher because selling pressure has been strong enough to stop or reverse the advance. When a Matching High forms around this area, the resistance level gives additional context to the bearish signal.
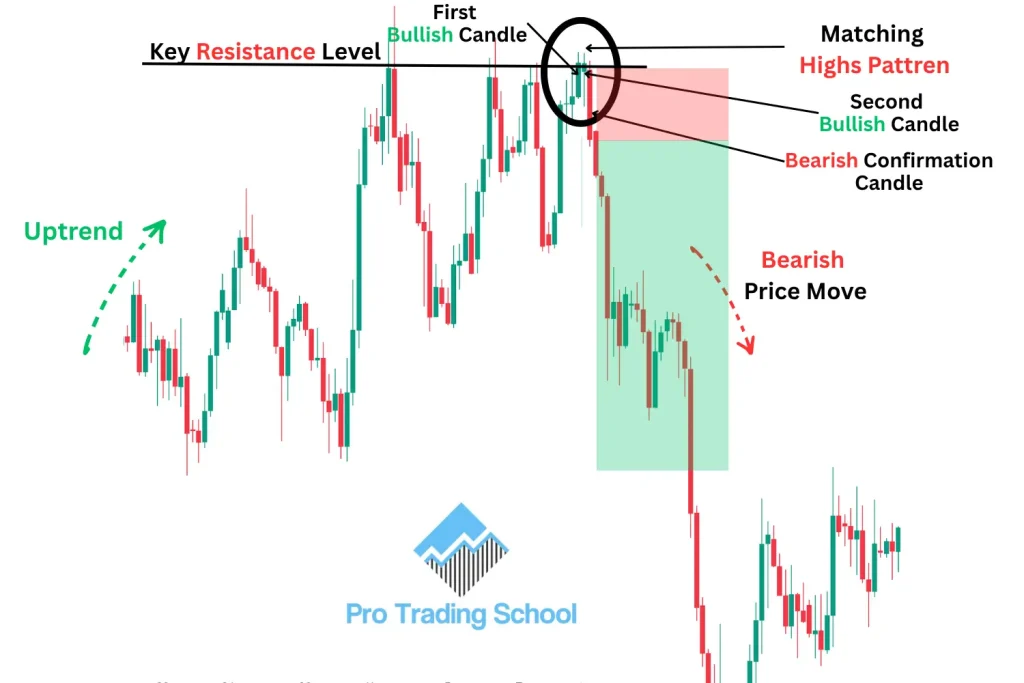
Look at the chart example above. As you can see, the market is initially trending upward. Price reaches the same resistance area three times, creating what traders commonly call a triple top.
On the third test of the resistance level, a Matching High pattern appears.
The first candle reaches the resistance level and gets rejected. The second candle then attempts to move higher but reaches approximately the same high as the first candle and fails to break above the resistance.
This is important because we now have two pieces of bearish information occurring at the same location: a major resistance level that has already rejected price several times and a Matching High showing that buyers are struggling to push through that level.
Entry, Stop Loss, and Profit Target
Instead of entering immediately after identifying the Matching High, wait for additional bearish confirmation.
In this example, a third bearish candle forms after the pattern and starts moving away from the resistance level. This provides additional evidence that sellers are taking control.
The trade can then be structured as follows:
- Entry: Enter a short position at the close of the bearish confirmation candle.
- Stop loss: Place the stop loss above the Matching High and the resistance area. This protects the trade if buyers regain control and price breaks above resistance.
- Profit target: Use the next significant support level as the potential profit target.
In the chart example, after the bearish confirmation candle forms, price moves lower and eventually reaches the target.
Why Context Matters More Than the Pattern
The most important lesson is that the Matching High is a signal, not a complete trading strategy by itself.
Two candles with similar highs can appear frequently on a chart without producing a meaningful reversal. What gives the pattern greater significance is where it forms and what the market is doing around it.
A Matching High forming randomly in the middle of a range is very different from one forming after a strong upward move at a major resistance level that has already rejected price several times.
This is why you should always consider market structure, trend, and major support and resistance levels before trading the pattern.
Think of the Matching High as the confirmation of what the price level is already telling you: buyers are struggling to break through resistance, sellers are defending the area, and a bearish reversal may be developing.
Conclusion
The Matching High candlestick pattern is a bearish reversal signal that shows buyers are struggling to push the market higher.
When price reaches the same high twice and gets rejected, it suggests that sellers may be taking control.
However, don’t trade the pattern alone. Always consider the market structure and key levels. As we have seen, a Matching High that forms at a strong resistance level can provide a more reliable bearish reversal setup.
The key is simple: use the Matching High as a signal, but let the market context confirm the trade.
Frequently Asked Questions
What is a Matching High candlestick pattern?
The Matching High candlestick pattern is a bearish reversal pattern that forms when two consecutive candles reach approximately the same high. It suggests that buyers are struggling to push price higher and that sellers may be taking control.
Is the Matching High pattern bullish or bearish?
The Matching High is considered a bearish reversal pattern, particularly when it forms at the end of an uptrend or near a resistance level.
What does the Matching High pattern indicate?
It indicates that buyers have attempted to push the market above the same price area twice but failed. This repeated rejection can signal weakening buying pressure and a potential move downward.
How do you trade the Matching High candlestick pattern?
One approach is to look for a Matching High at a resistance level, wait for bearish confirmation, and enter after the confirmation candle closes. A stop loss can be placed above the pattern, while the next support level can be used as a potential target.
Is the Matching High pattern reliable?
The Matching High is generally more useful when combined with market structure, resistance levels, and additional confirmation. Like any candlestick pattern, it should not be used as a standalone trading signal.
What is the difference between a Matching High and a Double Top?
A Matching High is a candlestick formation involving two candles with approximately equal highs, while a Double Top is a broader chart pattern formed when price tests a similar resistance area twice, usually over a longer period.










Aren’t you going against the trend? Also, is there a matching low strategy?
Great content
sorry i dont speak english
thanks for sharing
probably there is matching – LOW ???
Thanks for this insight analysis. It generally good and helpful in trading.
Thanks