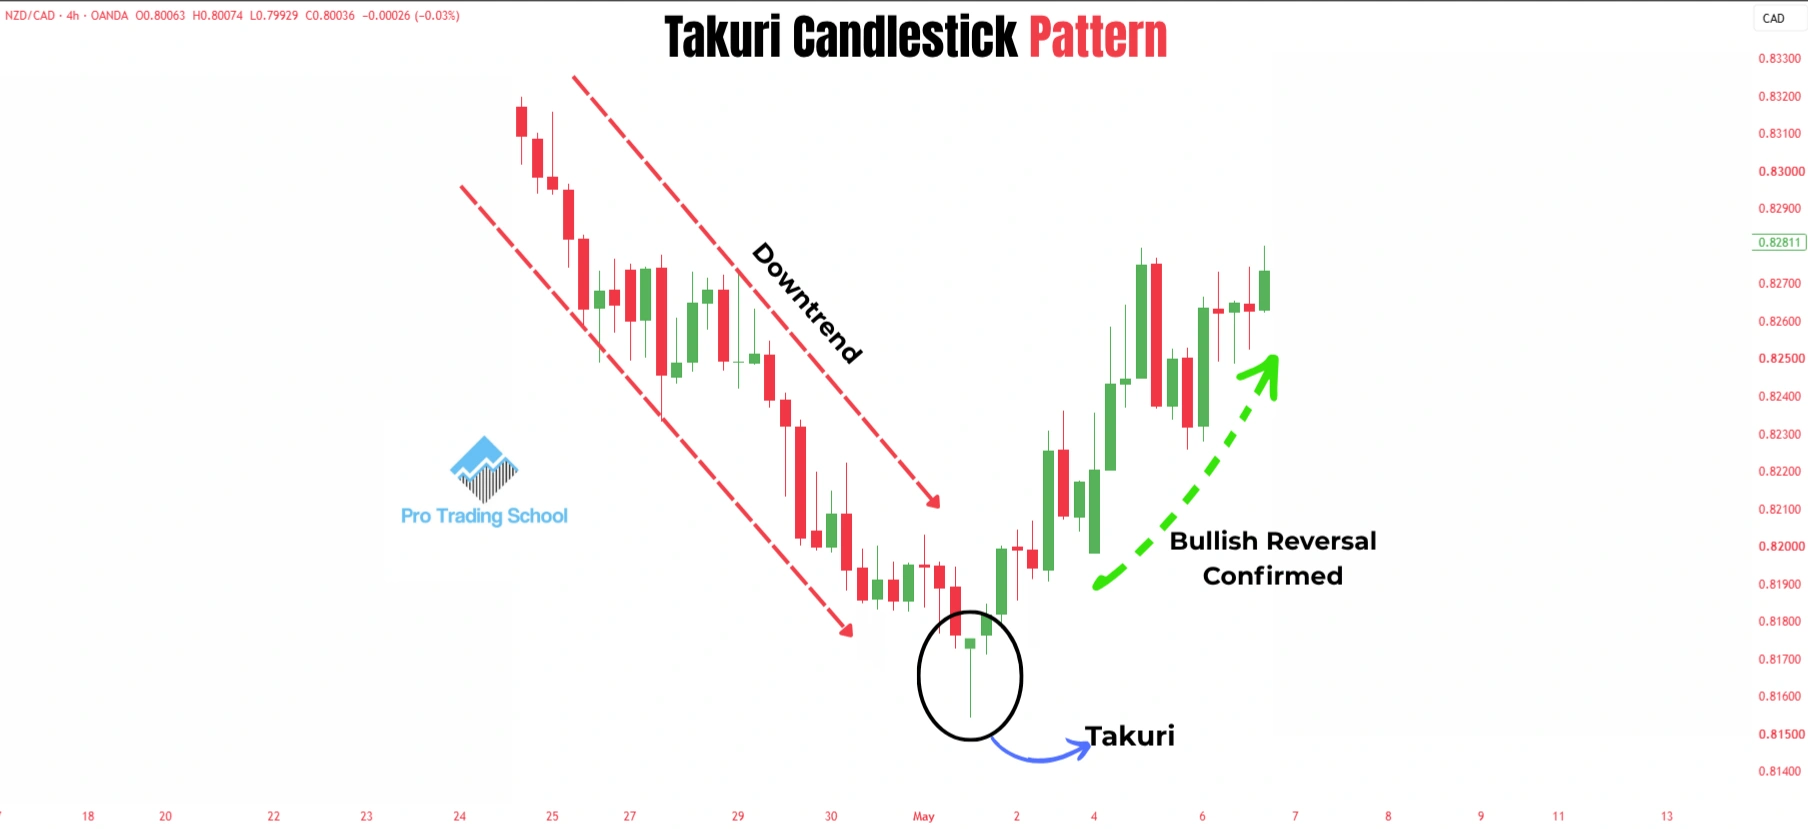
The Takuri candlestick pattern is a bullish reversal candlestick pattern that forms after a downtrend and signals that sellers may be losing control while buyers are beginning to step in.
It resembles the Hammer candlestick pattern but features an exceptionally long lower shadow, showing a strong rejection of lower prices.
The pattern develops when sellers push the market sharply lower during the trading session, but buyers absorb the selling pressure and drive the price back near the opening price before the candle closes.
This shift in momentum suggests that bearish pressure is weakening and that a potential trend reversal to the upside may be underway.
Because of its ability to identify possible market bottoms, the Takuri candlestick pattern is widely used by traders to spot high-probability buying opportunities, especially when it forms near major support levels, demand zones, or after a liquidity sweep.
Takuri Candlestick Pattern Chart Example
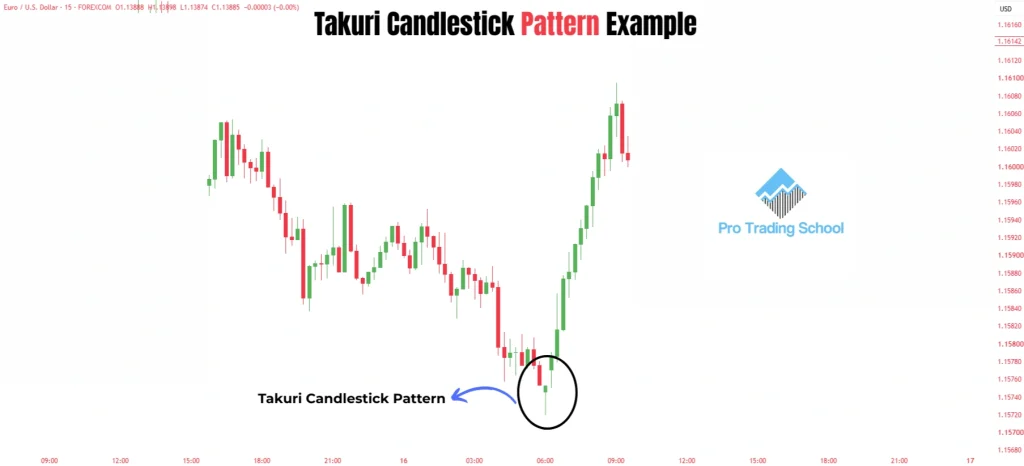
The chart above shows a perfect example of a Takuri candlestick pattern forming after a sustained downtrend.
Before the pattern appeared, sellers had complete control of the market, continuously pushing prices lower and creating bearish momentum.
However, during the formation of the Takuri candle, the market experienced a dramatic shift in sentiment.
Sellers initially drove the price sharply lower, creating the candle’s exceptionally long lower shadow.
But instead of continuing the decline, buyers aggressively stepped in, absorbed the selling pressure, and pushed the price back toward the opening level before the candle closed.
This strong rejection of lower prices indicates that bearish momentum is weakening and that buyers are beginning to take control.
As a result, the Takuri candlestick pattern often signals that the downtrend may be coming to an end and that a potential bullish reversal could be about to begin.
Although the Takuri pattern is a powerful reversal signal, traders should wait for additional confirmation such as a bullish breakout, a higher close, or increased buying volume—before entering a long position.
Takuri Candlestick Pattern vs Hammer
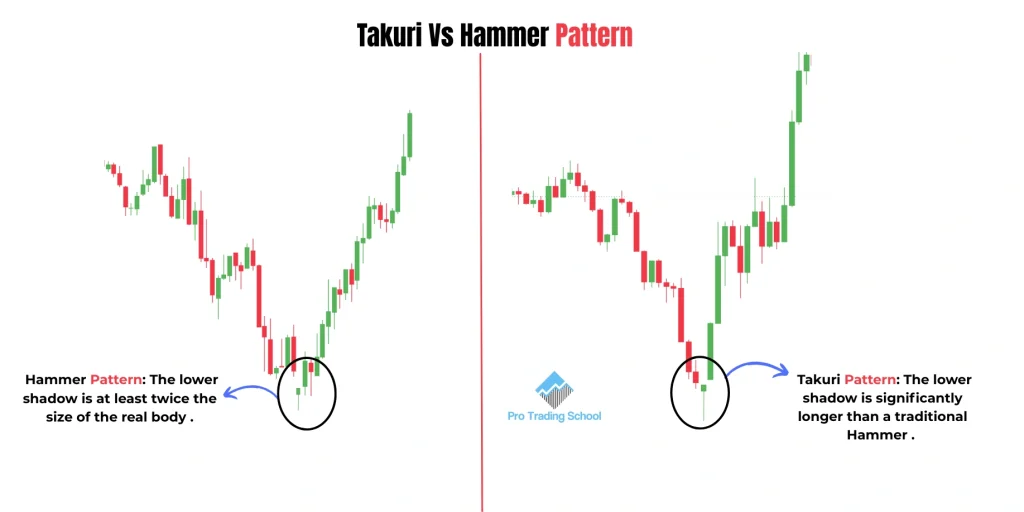
The Takuri candlestick pattern and the Hammer candlestick pattern look very similar because they share the same basic structure: a small real body near the top of the candle and a long lower shadow. Both patterns also appear after a decline and can signal a potential bullish reversal.
However, the main difference between the two patterns lies in the length of the lower wick.
- Hammer Candlestick: The lower shadow is typically at least twice the size of the real body, indicating that buyers rejected lower prices and regained some control before the close.
- Takuri Candlestick: The lower shadow is significantly longer and more pronounced than that of a Hammer, showing an even stronger rejection of lower prices and a more aggressive battle between buyers and sellers.
In simple terms, every Takuri candle resembles a Hammer, but not every Hammer qualifies as a Takuri candle.
The exceptionally long lower shadow of the Takuri pattern suggests that sellers made one final attempt to push the market lower but were completely overwhelmed by buyers.
For this reason, many traders consider the Takuri candlestick to be a stronger bullish reversal signal than the traditional Hammer, especially when it forms near a major support level, a demand zone, or after a liquidity sweep.
Key Difference
| Feature | Takuri Candlestick | Hammer Candlestick |
|---|---|---|
| Market Context | Downtrend | Downtrend |
| Lower Shadow | Exceptionally long | At least 2x the body |
| Rejection of Lower Prices | Very strong | Strong |
| Bullish Reversal Signal | Potentially stronger | Strong |
| Trader Psychology | Seller capitulation and aggressive buying | Buyer rejection of lower prices |
Although both patterns can signal a market bottom, traders should always wait for confirmation from the next candle or other technical factors before taking a trade.
Although the Takuri and Hammer candlestick patterns are very similar, the Takuri features a much longer lower shadow, indicating a stronger rejection of lower prices. If you want to learn more about the traditional Hammer pattern and how traders use it, check out our comprehensive guide on the Hammer Candlestick Pattern: Meaning, Trading Strategy & Examples.
Takuri Candlestick Pattern Trading Strategies
There are many ways to trade the Takuri candlestick pattern, but the pattern becomes much more powerful when it is combined with market structure and key technical levels. Like any candlestick pattern, the Takuri is not a holy grail and should never be traded in isolation.
Below are three high-probability strategies that can help you use the Takuri candlestick pattern more effectively.
1. Trading the Takuri Candlestick Pattern as a Reversal Pattern
The most common way to trade the Takuri pattern is to use it as a bullish reversal signal after a downtrend.
Look at the chart example below.
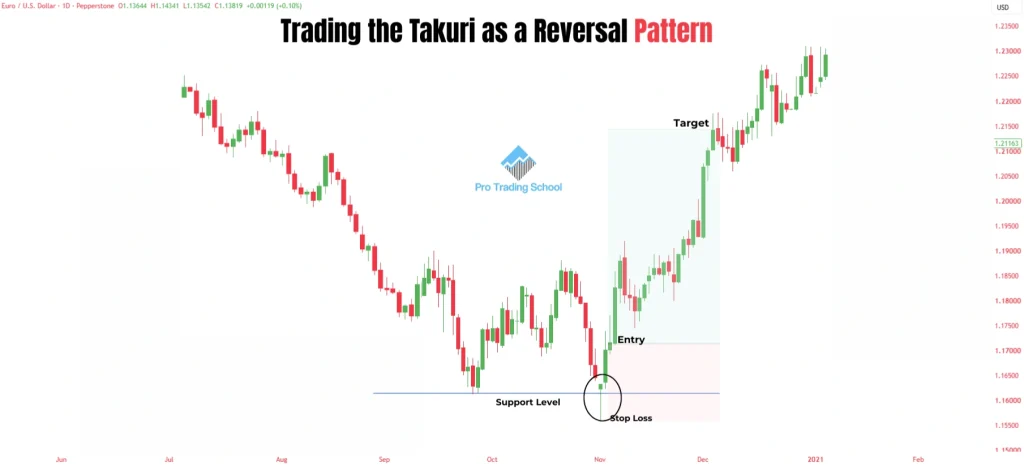
As you can see, the market is trending downward, meaning that sellers are in control. Eventually, the price reaches a support level and bounces.
This initial reaction suggests that buyers are starting to defend the area and that sellers are struggling to continue pushing the market lower. This is the first sign of seller weakness.
The market then retraces back toward the support level and tests it for a second time. This time, a Takuri candlestick pattern forms.
The appearance of the Takuri candle tells us an important story. Sellers managed to push the market sharply lower, but buyers completely rejected those lower prices and forced the market back up before the candle closed.
This strong rejection indicates that sellers are losing momentum and that buyers may be preparing to take control.
How to Trade This Setup
- Entry: At the close of the Takuri candle or after the next candle confirms the reversal.
- Stop Loss: Below the low of the Takuri candle.
- Profit Target: The next significant resistance level.
As shown in the chart example, the market eventually reversed and moved toward the target.
Pro Tip: The best reversal Takuri setups occur when the pattern forms at major support levels, demand zones, or after a liquidity sweep that traps sellers.
2. Trading the Takuri Pattern with the Trend
Many traders believe that the Takuri candlestick pattern can only be used as a reversal pattern. However, this is a common misconception.
When it appears in the right market context, the Takuri can also act as a bullish continuation pattern.
Look at the chart example below.
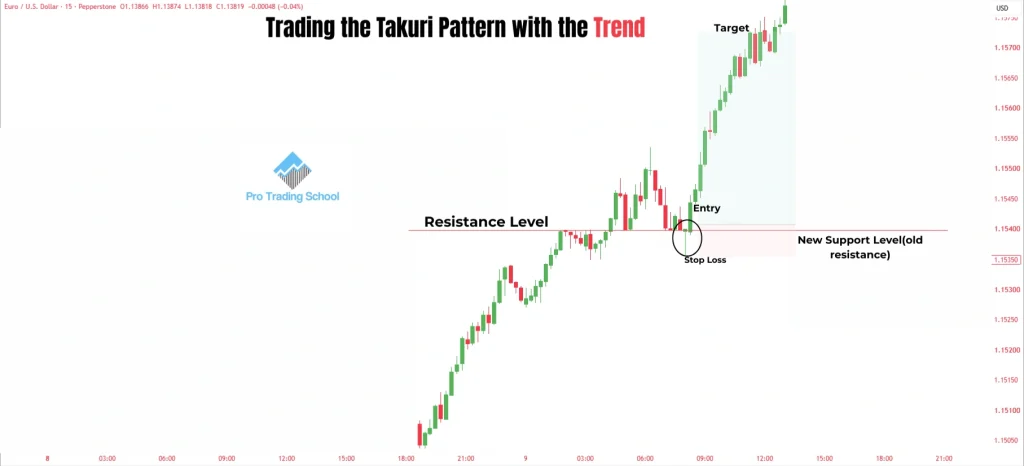
The market is already in an uptrend, meaning that buyers are in control. The price reaches a resistance level and pulls back. Later, buyers regain control and break above that resistance, turning it into a new support level.
The market then retraces toward this support level, and a Takuri candlestick pattern forms.
This is an important signal because it indicates that sellers attempted to push prices lower but failed. Buyers stepped in and rejected the retracement, suggesting that the pullback may be over and that the primary uptrend is likely to resume.
How to Trade This Setup
- Entry: At the close of the Takuri candle.
- Stop Loss: Below the low of the pattern.
- Profit Target: The next resistance level or a predetermined risk-to-reward ratio.
As the chart example shows, the market resumed its uptrend and reached the target.
Important: Even the best setups fail sometimes. The Takuri pattern is not a secret formula for making money. Risk management and position sizing remain far more important than any individual candlestick pattern.
3. Trading the Takuri Candlestick Pattern in a Range-Bound Market
Markets do not trend all the time. A large portion of market activity occurs inside trading ranges, where prices move between support and resistance.
As traders, we need to adapt to all market conditions, including range-bound markets.
Look at the chart example below.
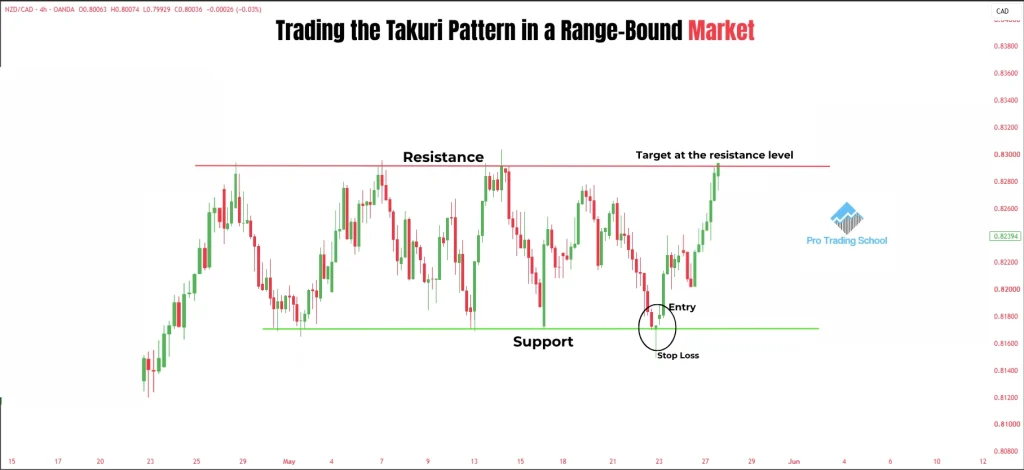
The market is moving sideways between a clearly defined support level and resistance level. In this environment, buyers and sellers are relatively balanced.
The trading plan is simple:
- Draw your support and resistance levels.
- Wait for the market to reach support.
- Look for a Takuri candlestick pattern to form at that level.
The appearance of the Takuri candle at support indicates that sellers were rejected and that buyers may once again push the market toward resistance.
How to Trade This Setup
- Entry: At the close of the Takuri candle.
- Stop Loss: Below the low of the pattern.
- Profit Target: The resistance level at the top of the range.
As with any trading strategy, combining the Takuri pattern with support and resistance significantly improves its effectiveness.
Important Note
Never make trading decisions using a single timeframe.
Always perform a top-down analysis by examining the higher timeframes first. A Takuri pattern that aligns with the higher-timeframe trend and forms at an important support level has a much higher probability of succeeding than one that appears randomly in the middle of a chart.
Remember, the Takuri candlestick pattern is simply a setup that helps you identify a potential opportunity. Long-term success in trading comes from combining high-quality setups with sound risk management, patience, and discipline.
Conclusion
The Takuri candlestick pattern is a powerful bullish reversal pattern that signals a strong rejection of lower prices and a potential shift in market sentiment from bearish to bullish. While it is often used to identify market bottoms, the pattern can also be traded as a continuation signal when it forms in the right market context.
However, no candlestick pattern is a guaranteed predictor of future price movements. The Takuri pattern works best when combined with other technical tools, such as support and resistance levels, market structure, trend analysis, and top-down analysis.
By understanding the psychology behind the Takuri candlestick pattern and using proper risk management, traders can improve their ability to identify high-probability trading opportunities and make more informed trading decisions.
Frequently Asked Questions (FAQs)
Is the Takuri candlestick pattern bullish or bearish?
The Takuri candlestick pattern is a bullish reversal pattern. It typically forms after a downtrend and signals that sellers have been rejected and that buyers may be preparing to push prices higher.
Is the Takuri candlestick pattern reliable?
The Takuri pattern can be a reliable signal when it forms in the right market context, such as near a major support level, a demand zone, or after a liquidity sweep. However, it should not be traded on its own and always requires additional confirmation.
What does the long lower shadow of the Takuri candle mean?
The exceptionally long lower shadow shows that sellers managed to drive prices sharply lower, but buyers stepped in aggressively and rejected those lower prices. This rejection often indicates that bearish momentum is fading.
Can the Takuri candlestick pattern appear in an uptrend?
Yes. Although the Takuri is primarily known as a bullish reversal pattern, it can also act as a bullish continuation signal when it forms during a pullback in an existing uptrend.
Should I buy immediately after a Takuri candlestick appears?
Many traders wait for confirmation before entering a trade. This confirmation can come in the form of a bullish candle, a break above resistance, or increased buying volume. Waiting for confirmation can help reduce false signals.
Which markets can the Takuri candlestick pattern be used in?
The Takuri pattern can be traded in almost any financial market, including stocks, forex, cryptocurrencies, commodities, and futures markets, because it reflects universal market psychology and the battle between buyers and sellers.
What is the best timeframe for trading the Takuri candlestick pattern?
The Takuri pattern can work on all timeframes, but signals that form on higher timeframes, such as the daily and weekly charts, tend to be more reliable because they represent the actions of a larger number of market participants.
Can the Takuri candlestick pattern fail?
Yes. Like every trading setup, the Takuri pattern produces losing trades from time to time. This is why traders should always use proper risk management and avoid risking too much capital on a single trade.
Why is the Takuri candlestick pattern important?
The Takuri pattern is important because it helps traders identify moments when selling pressure may be exhausted and when buyers are starting to regain control of the market, potentially leading to a bullish reversal.