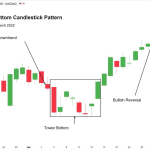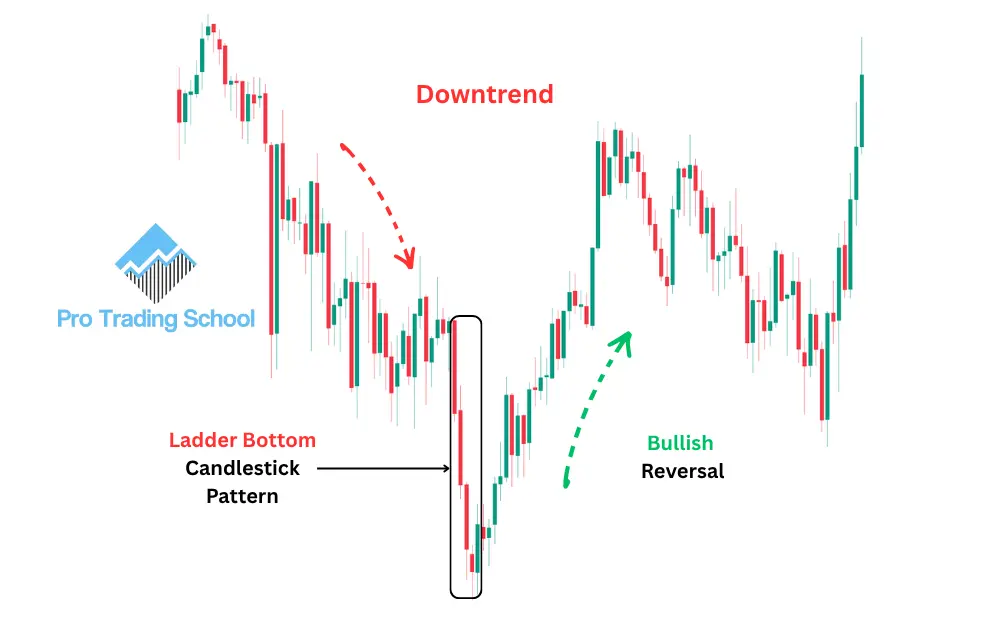
The Ladder Bottom Candlestick Pattern is a bullish reversal candlestick pattern that signals a potential end to a downtrend and the beginning of a new upward trend.
This pattern often appears near major support levels and suggests that selling pressure is weakening while buyers are gradually gaining control of the market.
The pattern consists of five consecutive candlesticks. The first four candles are bearish, reflecting strong downward momentum and continued pessimism among traders.
The fifth candle is a strong bullish candlestick that confirms the reversal by indicating that buyers have stepped into the market and shifted momentum in their favor.
When properly identified, the Ladder Bottom pattern can provide traders with an early indication of a potential trend reversal and a favorable buying opportunity.
Ladder Bottom Candlestick Pattern Example
When analyzing price charts, you will notice that the Ladder Bottom candlestick pattern can appear in several variations.
The size of the candles may differ from one setup to another, but the underlying psychology behind the pattern remains the same.
Understanding a real chart example will help you identify this bullish reversal pattern within seconds.
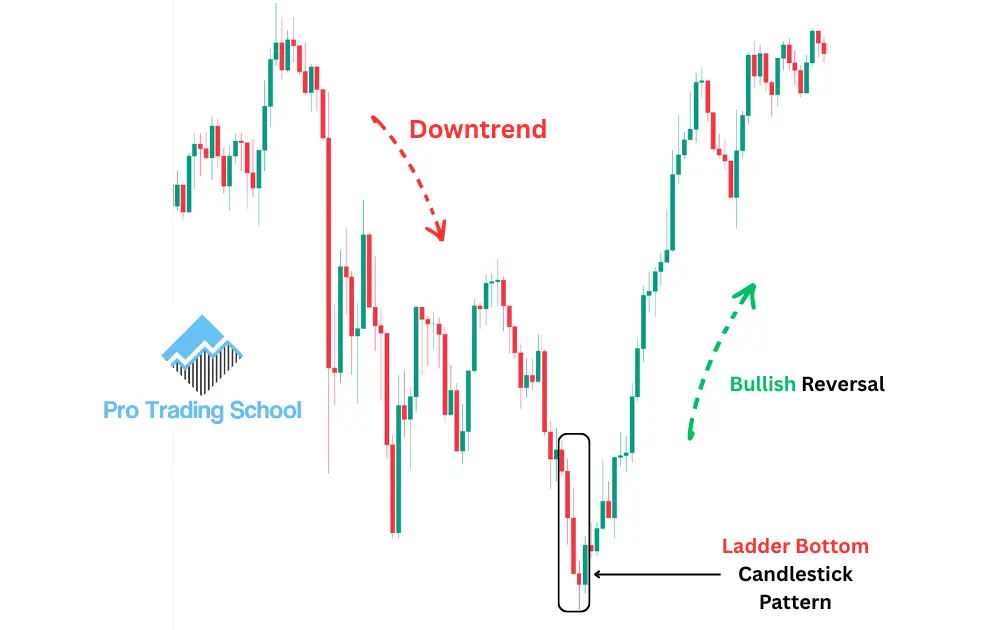
As shown in the chart example, the market was clearly in a downtrend, indicating that sellers were in control.
After a prolonged decline, the Ladder Bottom pattern began to form. If we draw a support level beneath the pattern, we can see that the fourth bearish candle briefly pushed below support, sweeping liquidity and triggering the stop losses of retail traders before reversing higher.
The fifth candlestick is a strong bullish candle that confirms the shift in market sentiment from bearish to bullish.
This bullish confirmation suggests that buyers have regained control and that a potential uptrend may be starting.
The structure of the pattern is relatively simple:
- The first candle is bearish.
- The second candle is also bearish and can be either large or average in size.
- The third candle remains bearish, showing continued selling pressure.
- The fourth candle is another bearish candle that often forms a liquidity sweep near support.
- The fifth candle is a strong bullish candlestick that confirms the reversal and signals increasing buying pressure.
When the Ladder Bottom candlestick pattern forms near a major support level, a demand zone, or after a liquidity sweep, it can provide traders with high-probability buying opportunities and favorable risk-to-reward setups.
If you want to learn more about other bullish and bearish candlestick formations, check out our comprehensive guide on the 33 Candlestick Patterns Cheat Sheet, where we cover the most important candlestick patterns every trader should know.
Ladder Bottom Candlestick Pattern Trading Strategies
The Ladder Bottom candlestick pattern can be used as a powerful bullish reversal signal when combined with other technical analysis tools.
Although the pattern can appear on its own, combining it with key support and resistance levels, trendlines, or indicators can significantly improve its reliability.
In this guide, we will cover three high-probability trading strategies that can help traders identify better entry opportunities using the Ladder Bottom pattern.
1. Ladder Bottom Candlestick Pattern at a Support Level
One of the most effective ways to trade the Ladder Bottom pattern is to combine it with major support levels.
Since support zones represent areas where buyers have previously entered the market, the appearance of a bullish reversal pattern near these levels often increases the probability of a successful trade.
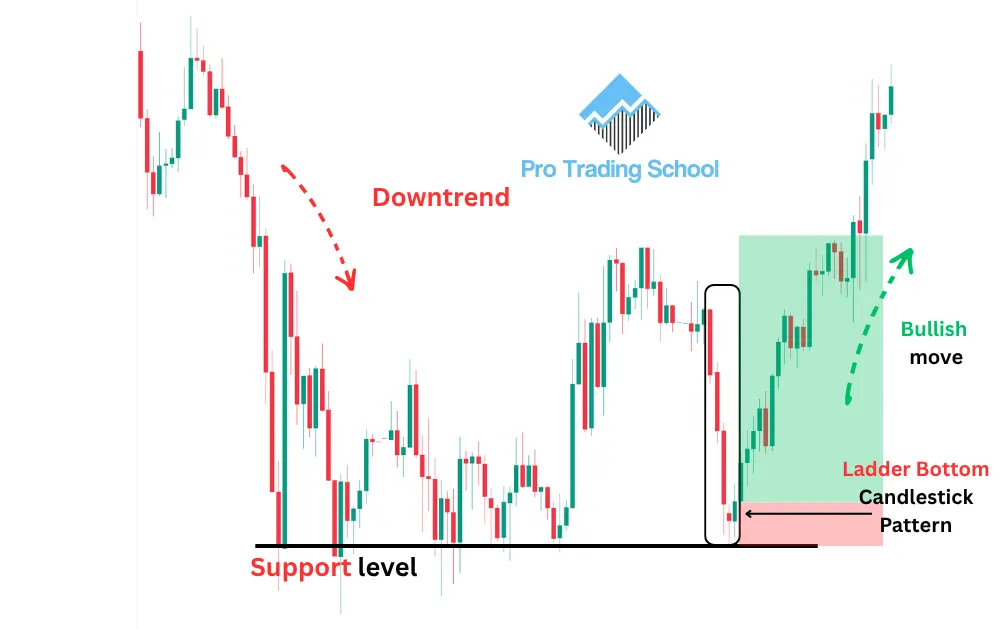
As shown in the chart above, the market was in a clear downtrend before reaching a major support level.
Price had tested this support several times in the past, and each time buyers stepped in and pushed the market higher, confirming the strength of the level.
On the sixth retest of support, the market pulled back once again and formed a Ladder Bottom candlestick pattern. The first four candles were bearish, showing that sellers were still in control.
However, the fifth candle turned bullish, signaling that selling pressure was weakening and that buyers were beginning to regain control of the market.
The formation of the Ladder Bottom pattern near a major support zone indicated the potential end of the retracement and the beginning of a new upward move.
How to Trade This Setup
A common approach to trading this strategy is:
- Entry: Open a buy position at the close of the fifth bullish candle.
- Stop Loss: Place the stop loss below the low of the pattern or below the support level.
- Take Profit: Target the next major resistance level or use a predetermined risk-to-reward ratio.
As illustrated in the example, the market moved strongly higher after the bullish confirmation, providing traders with an attractive buying opportunity.
Important Risk Management Note
This trading setup is shared for educational purposes only. While the Ladder Bottom candlestick pattern at support can be a high-probability setup, no strategy guarantees success in every market condition.
Even the best-looking setups can fail. Therefore, using proper risk management, position sizing, and a favorable risk-to-reward ratio is essential for achieving consistent profitability over the long term.
Successful traders understand that preserving capital and managing losses are just as important as finding winning trades.
Ladder Bottom Candlestick Pattern at a Demand Zone
Another effective way to trade the Ladder Bottom candlestick pattern is to combine it with institutional order flow concepts, such as demand zones.
The idea behind this strategy is to identify an area where strong buying activity previously entered the market and then wait for price to return to that zone and form a Ladder Bottom pattern.
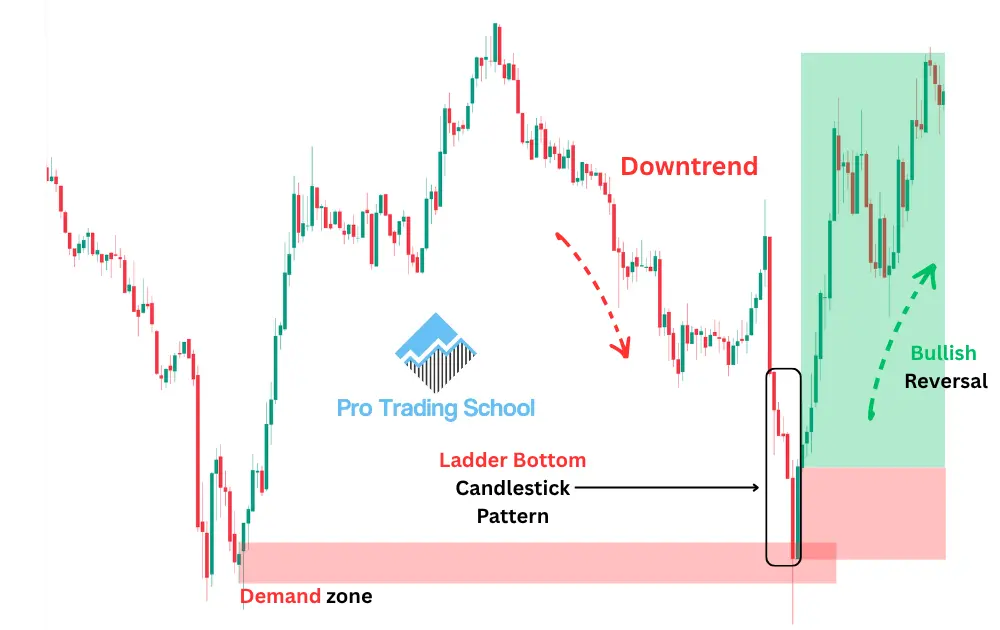
As shown in the chart above, the market was initially moving downward before reaching a key level where buyers aggressively stepped in and pushed prices sharply higher.
This strong bullish reaction created a demand zone, which represents an area where significant buying interest previously existed.
High-quality demand zones are closely watched by many traders and institutional participants because they often indicate areas where large market players accumulated positions.
When the market retraced back to this demand zone, price action became particularly important. As you can see, a Ladder Bottom candlestick pattern formed within the zone.
The first four candles were bearish, showing continued selling pressure, but the fifth candle turned bullish, signaling that buyers were defending the demand zone and regaining control of the market.
Ladder Bottom Candlestick Pattern at an Uptrending Trend Line
The next strategy involves using the Ladder Bottom candlestick pattern as a bullish continuation signal within an existing uptrend.
In this approach, we combine the pattern with trend lines to identify high-probability buying opportunities.
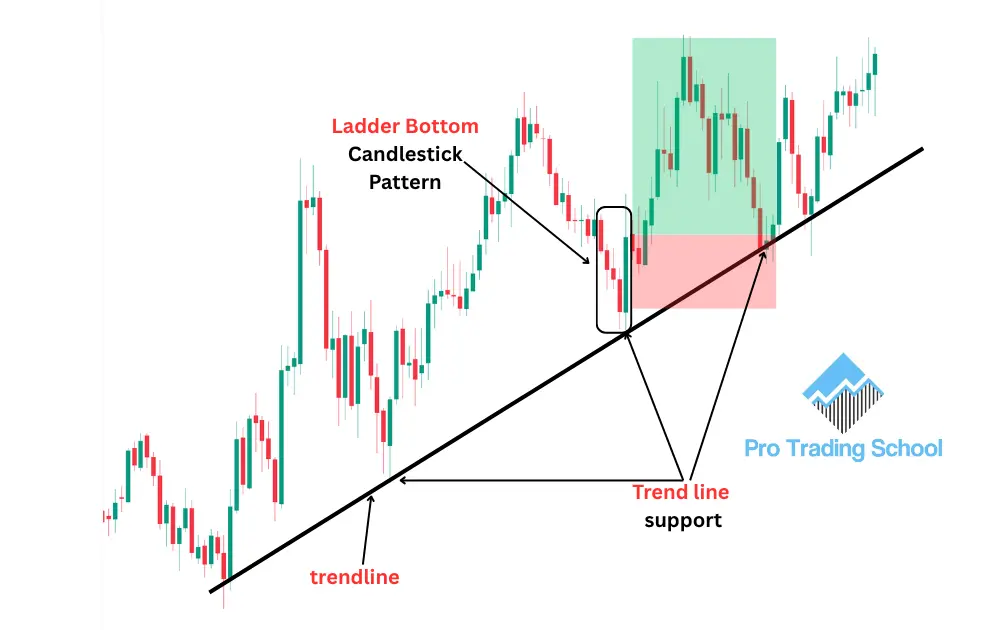
As shown in the chart above, the market was in a clear uptrend. To draw an uptrend line, we connect at least two significant swing lows.
This trend line acts as a dynamic support level and helps us identify areas where buyers may re-enter the market.
The idea behind this strategy is simple. In an uptrend, the market usually alternates between:
- Impulsive moves, where buyers aggressively push prices higher.
- Retracement moves, where the market temporarily pulls back before continuing in the direction of the trend.
When price retraces back to the uptrend line, traders look for bullish confirmation signals that indicate the pullback may be ending.
As you can see in the chart example, the market initially made a strong impulsive move upward before retracing back toward the trend line.
Once price reached this dynamic support level, a Ladder Bottom candlestick pattern formed.
The first four candles were bearish, reflecting temporary selling pressure during the pullback. However, the fifth candle turned bullish, signaling that buyers were stepping back into the market and that the primary uptrend could be ready to resume.
This bullish confirmation provides traders with a potential buying opportunity.
How to Trade This Setup
A common way to trade this strategy is:
- Entry: Place a buy order at the close of the fifth bullish candle.
- Stop Loss: Place the stop loss below the low of the pattern or slightly below the trend line.
- Take Profit: Target the next major resistance level or use a favorable risk-to-reward ratio.
As illustrated in the example, the market resumed its upward movement after the Ladder Bottom pattern formed, providing traders with a profitable continuation setup.
Final Thoughts
In this guide, we covered three effective ways to trade the Ladder Bottom candlestick pattern:
- At major support levels.
- At demand zones.
- At uptrending trend lines.
However, these are not the only ways to use this pattern. The Ladder Bottom can also be combined with other technical tools such as moving averages, Fibonacci retracements, support and resistance zones, or momentum indicators.
Ultimately, the most important factor is not finding the “perfect” strategy but developing a trading approach that is profitable, consistent, and fits your personality, risk tolerance, and trading style.
The appearance of the Ladder Bottom pattern at a demand zone provided additional confirmation that the zone remained valid and that the market could potentially resume its upward trend.
How to Trade This Setup
A common way to trade this strategy is:
- Entry: Place a buy order at the close of the fifth bullish candle.
- Stop Loss: Place the stop loss below the low of the pattern or below the demand zone.
- Take Profit: Target the next major resistance level or use a favorable risk-to-reward ratio.
As illustrated in the example, the market moved strongly higher after the bullish confirmation, providing traders with an attractive buying opportunity.
Why This Strategy Works
This setup works because it combines two powerful concepts:
- Institutional buying interest represented by the demand zone.
- Bullish reversal confirmation provided by the Ladder Bottom candlestick pattern.
When these two factors align, the probability of a successful trade generally increases, making this one of the more reliable ways to trade the Ladder Bottom candlestick pattern.
However, traders should remember that no setup is perfect. Proper risk management and confirmation from overall market structure should always be considered before entering any trade.
This bullish confirmation provides traders with a potential buying opportunity.
How to Trade This Setup
A common way to trade this strategy is:
- Entry: Place a buy order at the close of the fifth bullish candle.
- Stop Loss: Place the stop loss below the low of the pattern or slightly below the trend line.
- Take Profit: Target the next major resistance level or use a favorable risk-to-reward ratio.
As illustrated in the example, the market resumed its upward movement after the Ladder Bottom pattern formed, providing traders with a profitable continuation setup.
Final Thoughts
In this guide, we covered three effective ways to trade the Ladder Bottom candlestick pattern:
- At major support levels.
- At demand zones.
- At uptrending trend lines.
However, these are not the only ways to use this pattern. The Ladder Bottom can also be combined with other technical tools such as moving averages, Fibonacci retracements, support and resistance zones, or momentum indicators.
Ultimately, the most important factor is not finding the “perfect” strategy but developing a trading approach that is profitable, consistent, and fits your personality, risk tolerance, and trading style.
Conclusion
The Ladder Bottom candlestick pattern is a useful bullish reversal signal that can help traders identify potential buying opportunities.
For better results, it should be combined with other technical tools such as support levels, demand zones, and trend lines.
As with any trading strategy, no setup is guaranteed to work every time. Therefore, proper risk management and consistent practice are essential for long-term trading success.