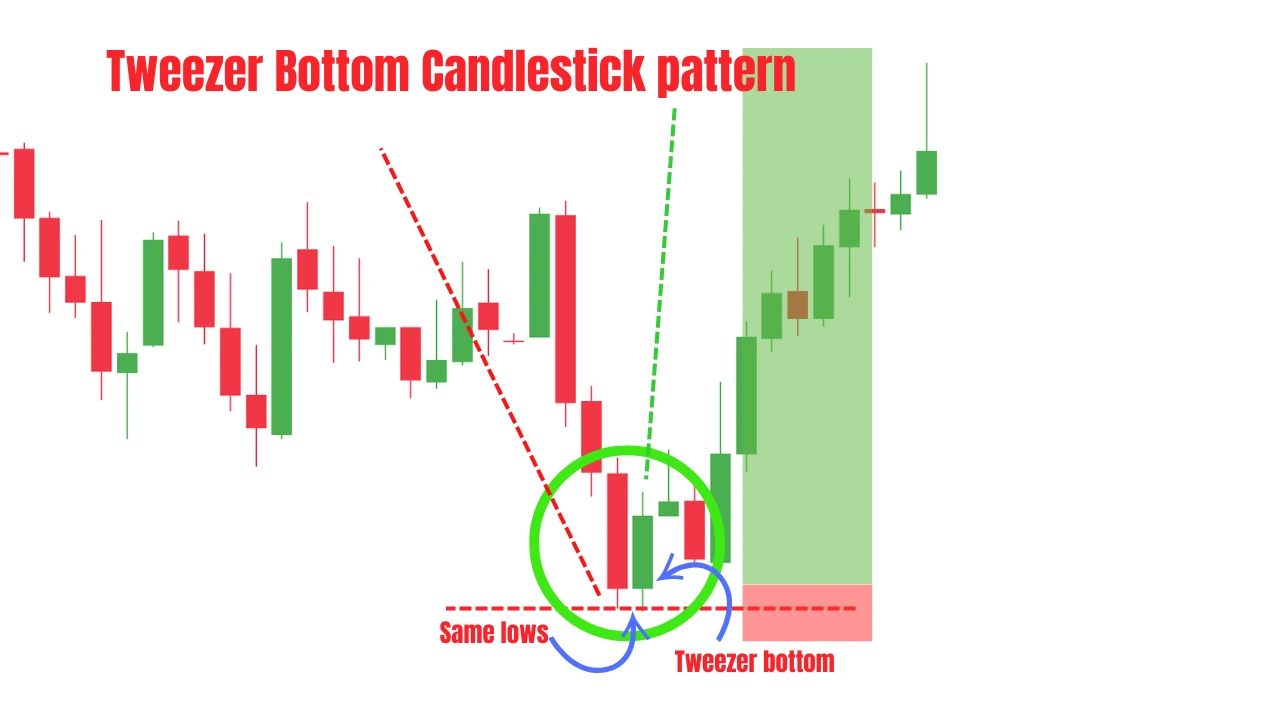
The Tweezer Bottom Candlestick Pattern is a bullish reversal candlestick formation that appears at the end of a downtrend and signals a potential shift in market direction from bearish to bullish.
This two-candle pattern consists of:
- A first bearish candle that reflects strong selling pressure and seller dominance.
- A second bullish candle that forms after the market rejects the previous low, showing that buyers are stepping back into the market.
One of the key characteristics of the Tweezer Bottom formation is that both candlesticks reject approximately the same support level.
This repeated rejection of lower prices indicates that sellers are losing momentum while buyers are beginning to gain control.
The transition from a bearish candle to a bullish candle also highlights a shift in market sentiment and can serve as an early warning sign of a potential bullish trend reversal.
Traders often use the Tweezer Bottom candlestick setup alongside other technical analysis tools such as:
- Support and resistance levels
- Bullish institutional zones
- Trend analysis
- Volume confirmation
- Liquidity sweeps
- Higher time frame confluence
When combined with these factors, the Tweezer Bottom pattern can become a high-probability bullish reversal signal in price action trading.
Key Takeaways
-The Tweezer Bottom Candlestick Pattern is a bullish reversal formation that typically appears after a bearish market move.
-The pattern is made of two candlesticks that reject a similar low, showing that sellers failed to push the market lower.
-A bearish first candle followed by a bullish second candle reflects a shift in momentum from sellers to buyers.
-The repeated rejection from the same support area often signals weakening bearish pressure and growing buying interest.
-Traders usually combine the Tweezer Bottom setup with other confluence factors such as support and resistance, liquidity sweeps, volume analysis, and higher time frame trend direction.
-The pattern should not be traded in isolation. Waiting for additional confirmation can help improve trade accuracy and reduce false signals.
-The Tweezer Bottom candlestick formation can be used in forex, stocks, cryptocurrencies, indices, and other financial markets.
Tweezer Bottom Candlestick Pattern Anatomy Explained
The Tweezer Bottom Candlestick Pattern is formed by two key candlesticks that appear after a bearish market move and signal a potential bullish reversal.
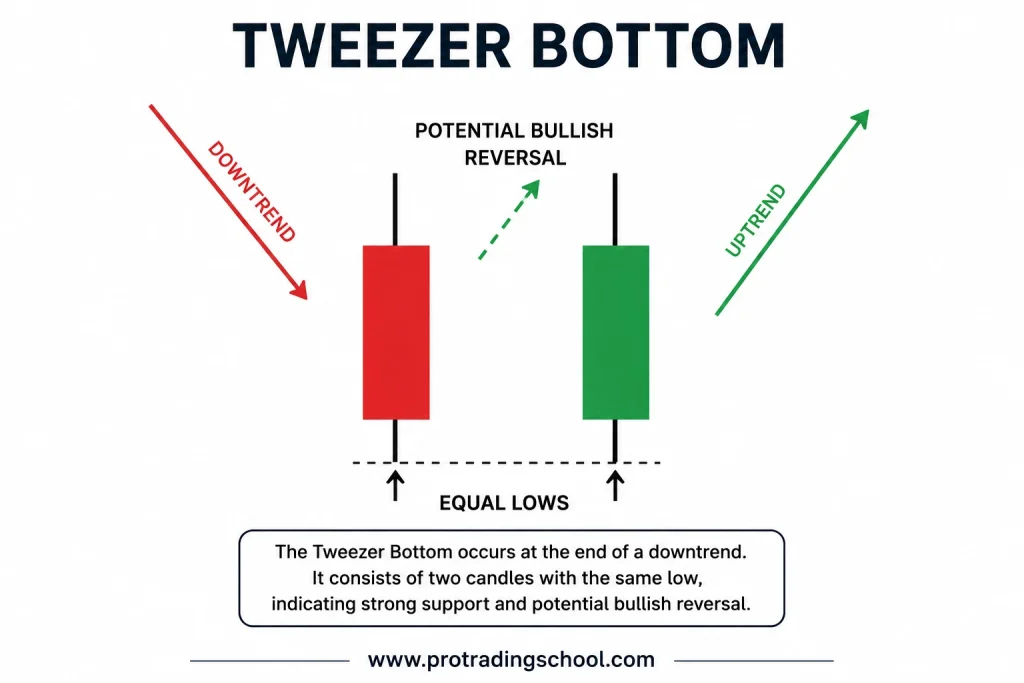
First Candle: Bearish Rejection Candle
The first candle in the pattern is a bearish candlestick, usually colored red or black depending on the chart settings used by the trader.
This candle reflects strong selling pressure and confirms that sellers were initially in control of the market.
One important detail is the lower wick of the candle. This wick shows that although sellers pushed price downward during the session, buyers reacted aggressively near the lows and rejected lower prices. This rejection is an early sign that bearish momentum may be weakening.
The longer the rejection wick, the stronger the indication that buyers are defending the support area.
Second Candle: Bullish Rejection Candle
The second candle is a bullish candlestick, commonly displayed in green or white depending on the candlestick color scheme.
This candle signals that buyers are beginning to regain control after the previous bearish move.
Like the first candle, the second candle also contains a lower shadow or wick. What makes the Tweezer Bottom setup important is that this bullish candle rejects approximately the same low as the first candle.
This repeated rejection from the same price zone highlights a strong support level where buyers are actively entering the market.
The bullish close of the second candle demonstrates a shift in momentum from sellers to buyers and increases the probability of a bullish trend reversal.
Market Context Before the Pattern
Before a valid Tweezer Bottom formation appears, the market should already be in a clear downtrend.
This is important because the pattern is designed to signal the exhaustion of bearish momentum after an extended move lower.
When the Tweezer Bottom candlestick setup forms after a strong decline, especially near a key support level, a bullish institutional zone, or after a liquidity sweep, it can become a high-probability reversal signal for price action traders.
What Does the Tweezer Bottom Candlestick Pattern Indicate?
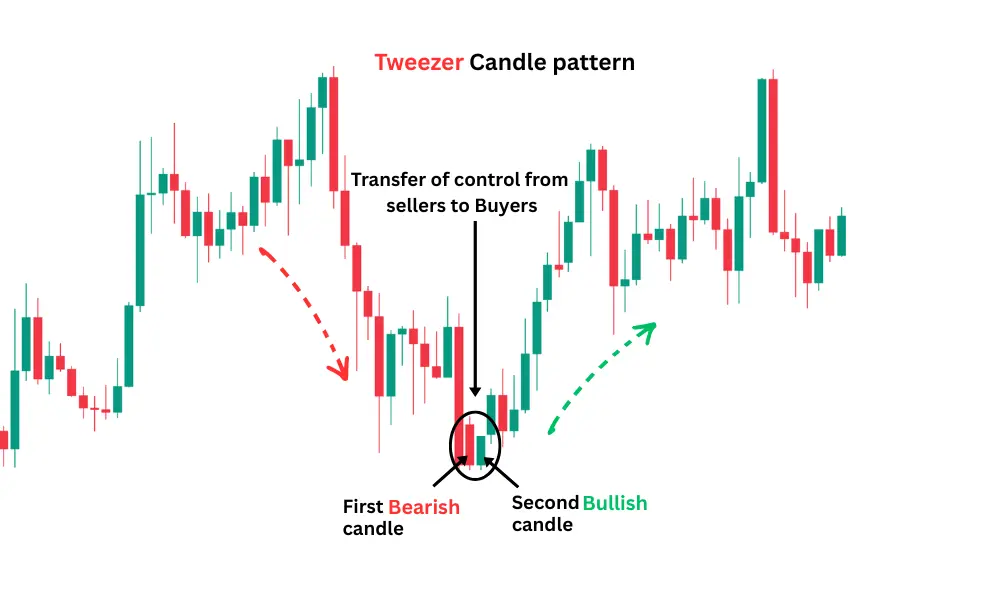
Understanding the anatomy of the Tweezer Bottom Candlestick Pattern is important because it helps traders correctly identify the pattern and avoid confusing it with other candlestick formations.
However, understanding the psychology behind the pattern is even more important because it explains the real message the market is sending when the setup appears.
At the beginning, the market is clearly moving downward, which indicates that sellers are in full control. Price continues making lower lows, and most traders believe the bearish trend will continue.
Then the first bearish candle of the Tweezer Bottom pattern forms. This candle confirms that sellers are still dominating the market, but the lower wick tells a deeper story.
Even though sellers pushed the market lower during the session, buyers started reacting aggressively near the lows and rejected lower prices. This rejection becomes the first warning sign that bearish momentum may be weakening.
The second candle is bullish and forms after price rejects approximately the same low as the first candle.
This repeated rejection from the same support area shows that buyers are strongly defending that price zone and are no longer allowing sellers to push the market lower easily.
The bullish close of the second candle is very important because it signals a shift in momentum.
Buyers not only stopped the bearish pressure, but they also managed to close the market above the opening price, showing growing bullish strength and increasing confidence from market participants.
This transfer of control from sellers to buyers can signal the beginning of a potential bullish reversal, especially when the Tweezer Bottom formation appears near:
- A key support level
- A bullish institutional zone
- A demand area
- A liquidity sweep
- A higher time frame support zone
The stronger the market context and the confirmation surrounding the pattern, the higher the probability of a successful bullish reversal setup.
To learn more about the most important bullish and bearish candlestick formations, check out our complete 33 Candlestick Patterns Cheat Sheet (Simple Visual Guide)
Tweezer Bottom Candlestick Pattern Example
In the chart example below, you can see a clear Tweezer Bottom Candlestick Pattern that formed after a strong bearish move.
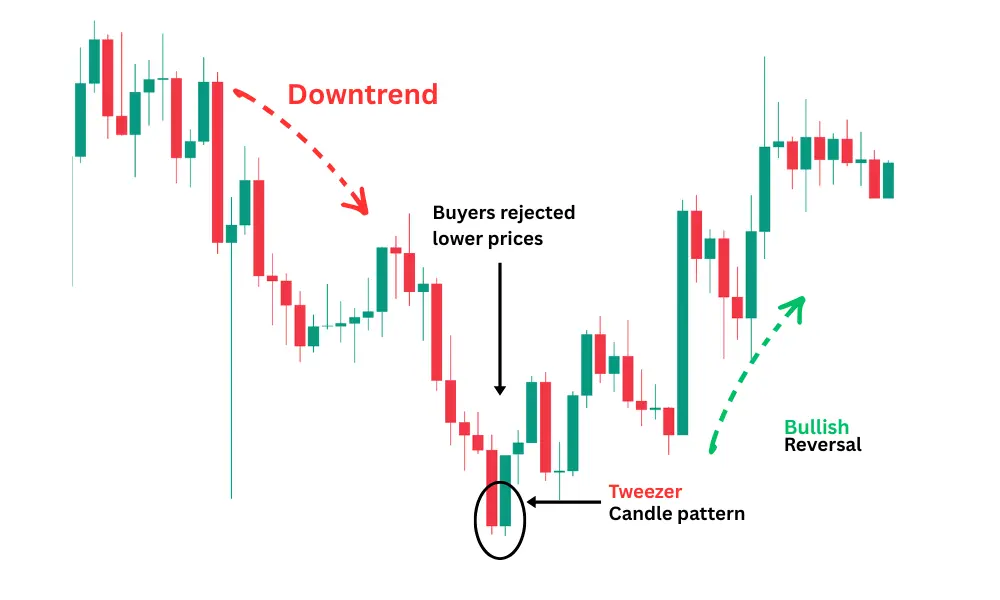
As shown on the chart, the market had been declining for an extended period before the reversal setup appeared.
The bearish momentum started slowing down near the bottom of the trend, where the two rejection candles formed at a similar price level.
The first candle reflected continued selling pressure, while the second candle showed that buyers were beginning to react aggressively from the same support area.
This shift in price behavior signaled that the downward momentum was weakening and that a potential bullish reversal could develop.
After the pattern formed, the market started moving upward, confirming the change in momentum between sellers and buyers.
This chart illustration is provided for educational purposes to help traders understand how the Tweezer Bottom setup appears in real market conditions.
It is important to understand that the pattern is not a guaranteed reversal signal, and it should never be treated as a “magic candlestick” capable of predicting every market move.
Like all price action patterns, the Tweezer Bottom formation can sometimes produce false signals, especially in weak market conditions or during choppy price action.
This is why traders should always focus on the overall market context instead of relying only on the candlestick formation itself.
In the next sections of this guide, we will cover the limitations of the Tweezer Bottom pattern, common trading mistakes to avoid, and practical techniques that can help traders identify higher-quality setups.
Tweezer Bottom vs Tweezer Top
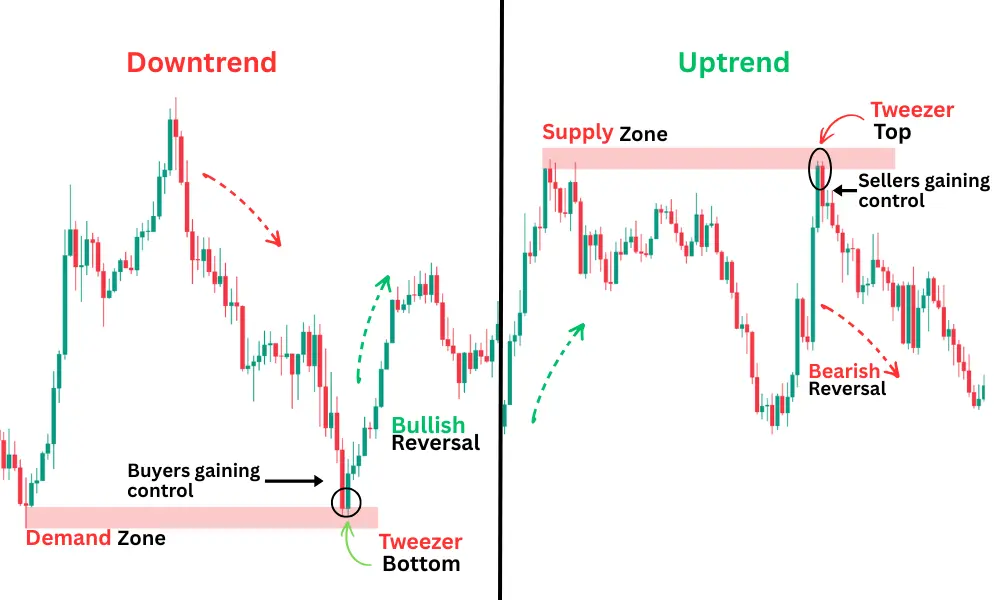
The Tweezer Bottom Candlestick Pattern is basically the opposite version of the Tweezer Top Pattern.
The Tweezer Bottom appears after a downtrend and signals that the market may reverse upward.
It shows that sellers tried to continue pushing price lower, but buyers stepped in and defended the same support area twice.
The Tweezer Top works the other way around. It forms after an uptrend and signals that the market may reverse downward.
In this case, buyers try to push the market higher, but sellers reject the same resistance area and start taking control.
In simple words:
- The Tweezer Bottom is a bullish reversal pattern.
- The Tweezer Top is a bearish reversal pattern.
The location of the pattern is very important.
The Tweezer Bottom usually becomes stronger when it forms near:
- A support level
- A demand zone
- A bullish institutional area
The Tweezer Top tends to work better when it forms near:
- A resistance level
- A supply zone
- A bearish institutional area
The psychology behind the two patterns is also opposite.
With the Tweezer Bottom, sellers are losing momentum and buyers are beginning to gain control.
With the Tweezer Top, buyers are losing momentum and sellers are starting to dominate the market.
Even though both patterns can signal a reversal, traders should not use them blindly. The overall market trend, the location of the pattern, and the confirmation after the setup are all important before entering a trade.
Tweezer Bottom vs Bullish Engulfing Pattern
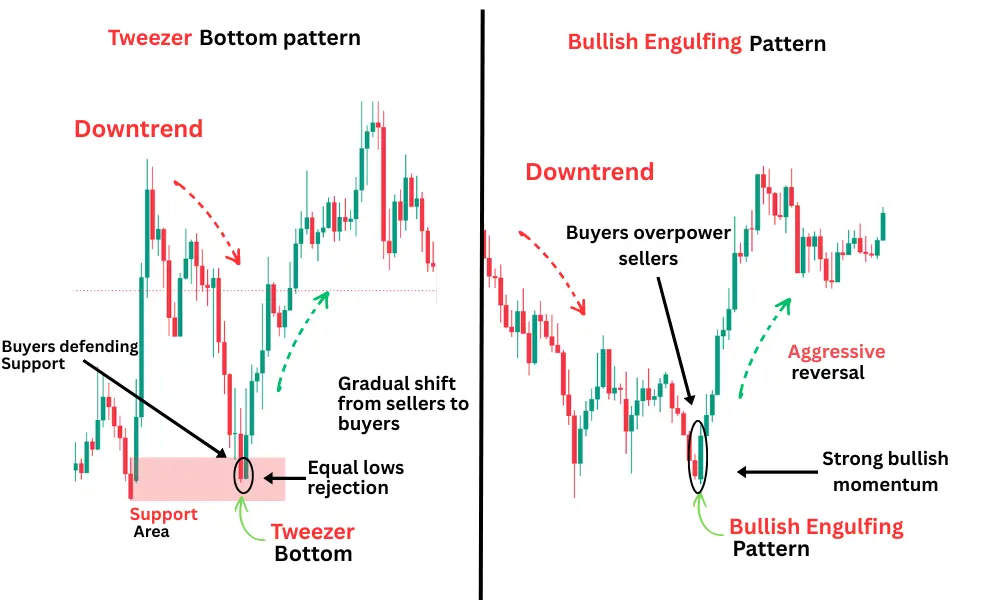
The Tweezer Bottom Candlestick Pattern and the Bullish Engulfing Pattern are both bullish reversal patterns that appear after a downtrend, but they tell the story of the market in different ways.
The Tweezer Bottom pattern is made of two candles that reject almost the same low. This shows that sellers tried more than once to push the market lower, but buyers defended the same support area each time. The pattern reflects a gradual shift in momentum from sellers to buyers.
The main idea behind the Tweezer Bottom is rejection from lower prices.
The Bullish Engulfing pattern is different. It is also made of two candles, but the second bullish candle completely covers the body of the first bearish candle.
This shows strong buying pressure and indicates that buyers suddenly took control from sellers.
In simple words:
- The Tweezer Bottom shows buyers defending a support level.
- The Bullish Engulfing pattern shows buyers overpowering sellers with strength.
There is also a difference in the appearance of the patterns.
With the Tweezer Bottom, traders focus on the equal lows or similar rejection levels between the two candles.
With the Bullish Engulfing pattern, traders focus on the large bullish candle that completely engulfs the previous bearish candle.
The psychology behind them is also slightly different:
- The Tweezer Bottom often signals that bearish momentum is weakening slowly.
- The Bullish Engulfing pattern usually signals a more aggressive shift in momentum.
Both patterns can become powerful reversal signals when they form near important market areas such as support levels, demand zones, or after a liquidity sweep.
However, neither pattern should be traded on its own. The market context, trend direction, and confirmation signals are always important before entering a trade.
We covered the Bullish Engulfing pattern in detail in our guide: 8 Powerful Bullish Engulfing Pattern Chart Examples.
Trading the Tweezer Bottom With a Key Support Level
This trading strategy is based on combining the Tweezer Bottom Candlestick Pattern with a strong support level.
The first step is to identify a clear downtrend. This is important because the Tweezer Bottom is a bullish reversal pattern, which means it works best after bearish market conditions.
As shown in the chart example below, the market was moving downward with strong selling pressure before reaching an important support level.
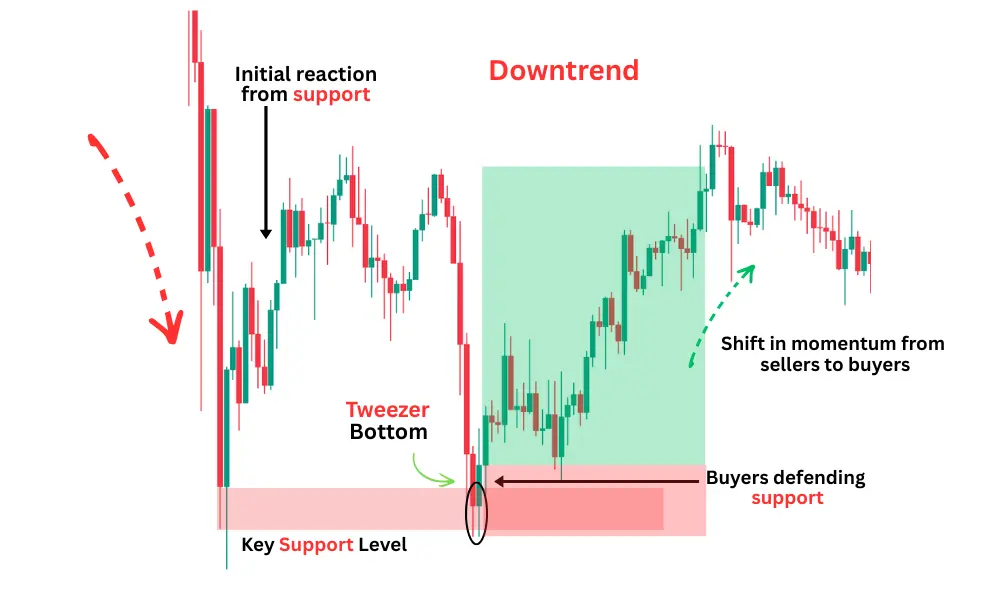
Once price reached this area, the market started reacting from it and failed to continue lower. This was the first sign that sellers were beginning to lose momentum.
After the initial reaction from support, the market retraced back toward the same level and formed a clear Tweezer Bottom pattern.
This formation was important because both candles rejected approximately the same low, showing that buyers were strongly defending the support zone.
The bullish second candle also confirmed that momentum was starting to shift from sellers to buyers.
The appearance of the Tweezer Bottom at a key support level increased the probability of a bullish reversal setup.
A common way traders execute this setup is by:
- Entering the trade after the close of the second bullish candle
- Placing the stop-loss below the support level or below the rejection lows
- Targeting the next resistance level or the next major market structure level
As shown in the example, the market moved upward after the confirmation signal, validating the bullish reversal scenario.
This type of setup becomes even stronger when there is a liquidity sweep below the support level before the Tweezer Bottom Candlestick Pattern forms.
A liquidity sweep happens when the market briefly breaks below support, triggering stop-losses from retail traders and trapping sellers, before quickly reversing back upward.
This false breakout often signals that smart money has collected liquidity from below the lows before pushing the market higher.
When a Tweezer Bottom forms after this type of manipulation, the setup usually carries more weight because it shows strong rejection from lower prices and confirms that buyers stepped aggressively into the market.
One very important point is that traders should never trade this setup without performing a proper top-down analysis.
Before taking any trade, always analyze the higher time frames first to understand the overall market direction. Then move to your trading time frame to look for confirmation.
This is important because sometimes a Tweezer Bottom may only create a short-term pullback inside a larger downtrend.
Traders who ignore the higher time frame can easily get trapped buying against the main market direction.
For this reason, many professional traders prefer taking Tweezer Bottom setups only when the higher time frame trend aligns with the bullish reversal signal on the lower time frame.
Trading the Tweezer Bottom With a Demand Zone
This Tweezer Bottom Candlestick Pattern strategy is considered stronger than the previous setup because it is based on a bullish institutional area known as a demand zone.
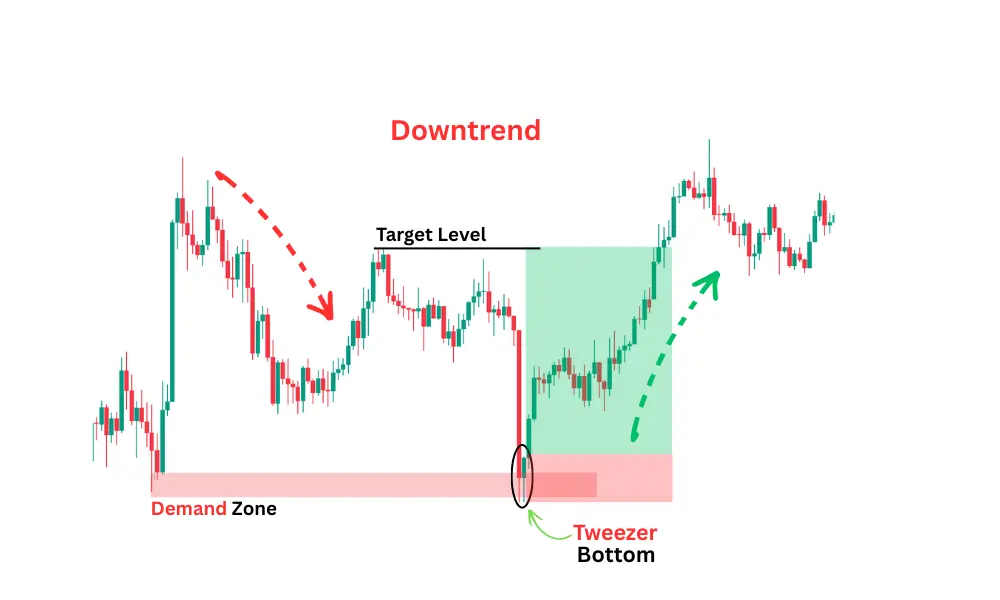
As shown in the chart example below, the market was clearly trending downward before suddenly reversing upward with strong momentum. This sharp bullish move created what traders call a demand zone.
A demand zone is different from a normal support level.
A support level is simply an area where price reacted and reversed. A demand zone, however, is an area where the market moved aggressively with strong bullish momentum, large candles, and clear signs of institutional buying pressure.
For this reason, learning how to identify high-quality demand zones is more important than the candlestick signal itself.
When traders correctly identify a strong institutional zone, many candlestick patterns can become highly effective confirmation signals inside that area.
Now look at what happened next in the chart.
After the strong bullish move, the market retraced back into the demand zone. Once price reached the zone again, a clear Tweezer Bottom pattern formed.
This formation showed that sellers were rejected from the institutional area and that buyers were defending the zone again.
The repeated rejection from the same lows confirmed that bearish momentum was weakening and increased the probability of a bullish continuation or reversal.
A common way traders execute this setup is by:
- Entering the trade after the close of the second bullish candle
- Placing the stop-loss below the demand zone or below the rejection lows
- Targeting the next resistance level or the next major market structure area
As shown in the example, the market moved upward after the confirmation signal and reached the target area successfully.
One important point that many beginner traders ignore is top-down analysis.
Before taking any Tweezer Bottom setup, traders should always analyze the higher time frames first.
A setup may look perfect on a lower time frame, but if it goes against the higher time frame trend, the trade can easily fail.
Sometimes a lower time frame bullish setup is only a temporary retracement inside a larger bearish trend.
This is why professional traders prefer taking trades that align with the overall higher time frame direction.
Finally, this content is shared for educational purposes only and should not be considered financial advice.
Traders should always perform their own analysis, manage risk properly, and consult a qualified financial advisor before making financial decisions.
Advantages of the Tweezer Bottom Candlestick Pattern
Easy to Spot
The Tweezer Bottom Candlestick Pattern has a simple structure, which makes it easy for beginner traders to recognize on the chart.
Can Signal Strong Reversals
When the pattern forms at a key support or demand zone, it can provide an early sign that the market may reverse upward.
Gives Clear Trade Levels
The setup helps traders define their entry, stop-loss, and target levels more easily, which improves risk management.
Limitations of the Tweezer Bottom Candlestick Pattern
Not Always Reliable
Like all candlestick patterns, the Tweezer Bottom can fail and produce false signals, especially in weak market conditions.
Needs Proper Context
The pattern works best when combined with trend analysis, support levels, or other confirmation factors. Trading it alone can be risky.
Can Be Misleading on Lower Time Frames
On small time frames, market noise can create many fake Tweezer Bottom setups that do not lead to real reversals.
Conclusion
The Tweezer Bottom Candlestick Pattern is a powerful bullish reversal pattern that can help traders identify potential market turning points after a downtrend.
The pattern reflects rejection from lower prices and shows that buyers may be starting to gain control from sellers. However, like all candlestick patterns, the Tweezer Bottom should never be traded blindly or used on its own.
The best results usually come when the pattern forms near important market areas such as support levels, demand zones, or after a liquidity sweep, while also aligning with the higher time frame trend.
By combining proper market context, risk management, and patience, traders can use the Tweezer Bottom as part of a complete price action trading strategy instead of relying on it as a “magic signal.
Frequently Asked Questions
What is a Tweezer Bottom candlestick?
The Tweezer Bottom Candlestick Pattern is a bullish reversal candlestick pattern that forms after a downtrend.
It consists of two candles rejecting approximately the same low, which signals that sellers may be losing control and buyers could be stepping into the market.
Is a Tweezer Top bullish or bearish?
The Tweezer Top Pattern is considered a bearish reversal pattern. It usually forms after an uptrend and indicates that buyers may be losing momentum while sellers begin taking control.
What indicators confirm a Tweezer Bottom?
Many traders combine the Tweezer Bottom with other tools for confirmation, such as support and resistance levels, moving averages, RSI, volume analysis, demand zones, and higher time frame trend analysis. The stronger the confluence, the higher the probability of the setup.










1 thought on “Tweezer Bottom Candlestick Pattern”
Comments are closed.