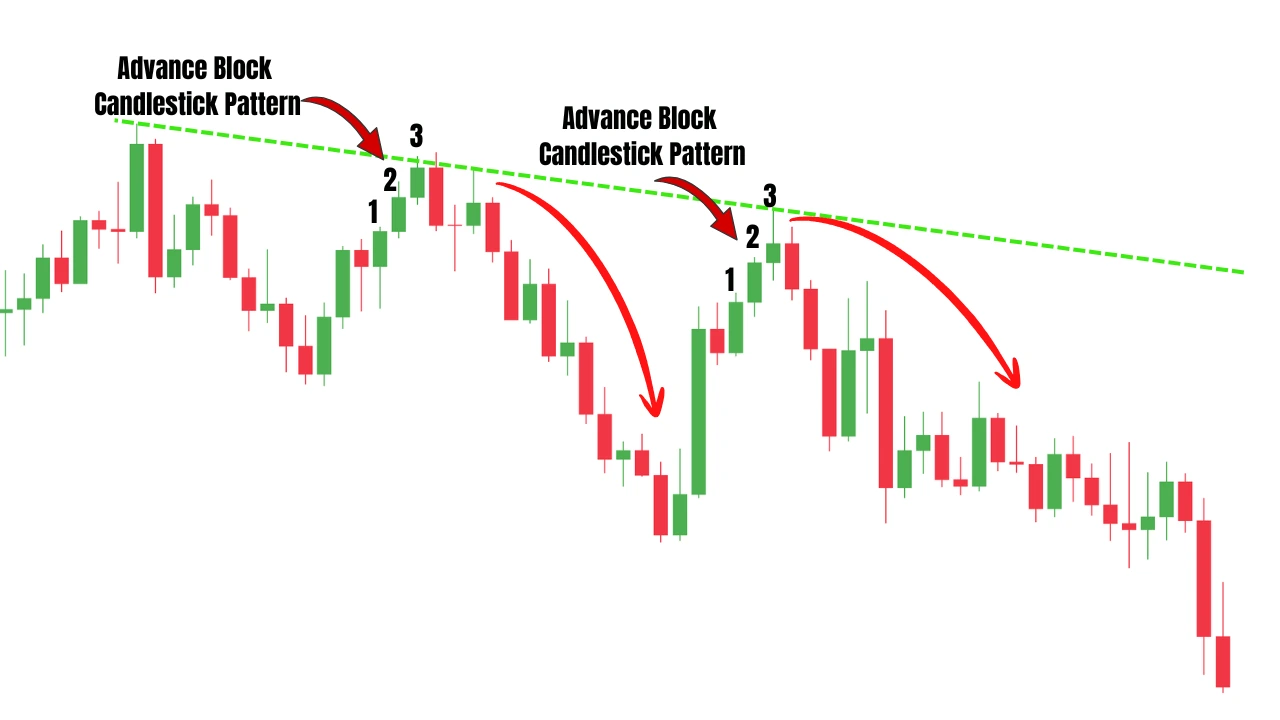
The Advance Block Candlestick Pattern is a bearish reversal pattern that consists of three consecutive bullish candlesticks. It typically appears after an uptrend and signals that buying pressure is gradually weakening.
The first candle is a strong bullish candlestick, showing that buyers are firmly in control of the market.
The second candle is also bullish but has a smaller body and a longer upper shadow, indicating that buyers are starting to lose momentum and that sellers are beginning to push back.
The third candle has an even smaller body and a relatively long upper shadow, revealing that buyers are struggling to continue the uptrend.
This progressive weakening of bullish momentum suggests that the market may be approaching a bearish reversal and that a decline in price could follow.
Advance Block Candlestick Pattern Example
The Advance Block Candlestick Pattern is not always easy to spot when it first appears on a price chart. In fact, many beginner traders overlook this formation because it looks similar to a normal bullish move.
However, with enough screen time and trading experience, you will be able to identify the pattern quickly and recognize the warning signs of a potential trend reversal.
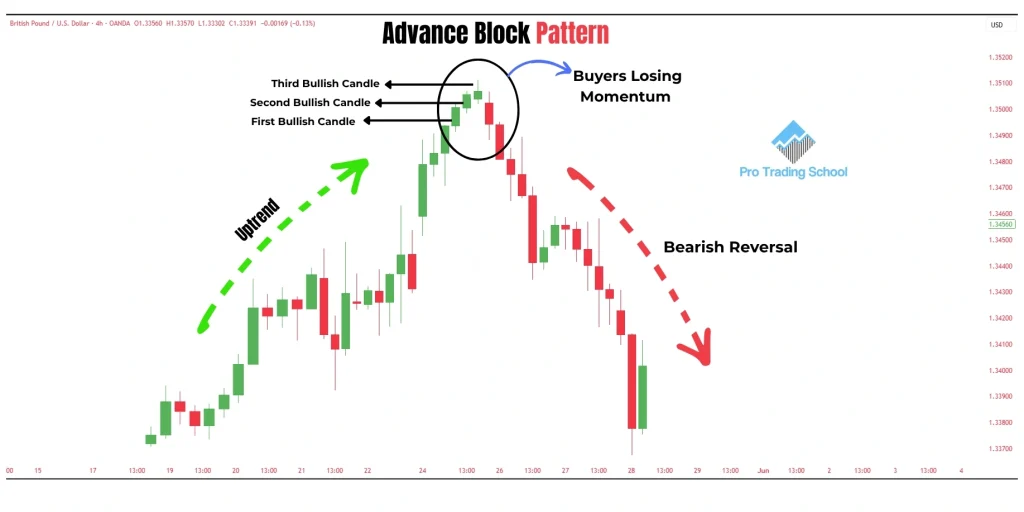
The chart example above shows exactly what the Advance Block Candlestick Pattern looks like. As you can see, the market is initially trending upward, which means that buyers are in control.
The first candle of the pattern is a strong bullish candlestick, indicating aggressive buying pressure and strong bullish momentum. The second candle is still bullish but has a smaller body and a longer upper shadow.
This suggests that buyers are still pushing prices higher, but their momentum is starting to weaken as sellers begin to enter the market.
The third candle is another bullish candlestick with an even smaller body and a noticeable upper wick. This candle reveals that buyers have lost much of their strength and are struggling to continue the uptrend. At the same time, sellers are becoming more active and attempting to push prices lower.
This gradual loss of bullish momentum and increasing selling pressure suggest that the existing uptrend may be nearing its end and that a bearish reversal could soon occur.
The Psychology Behind the Advance Block Candlestick Pattern
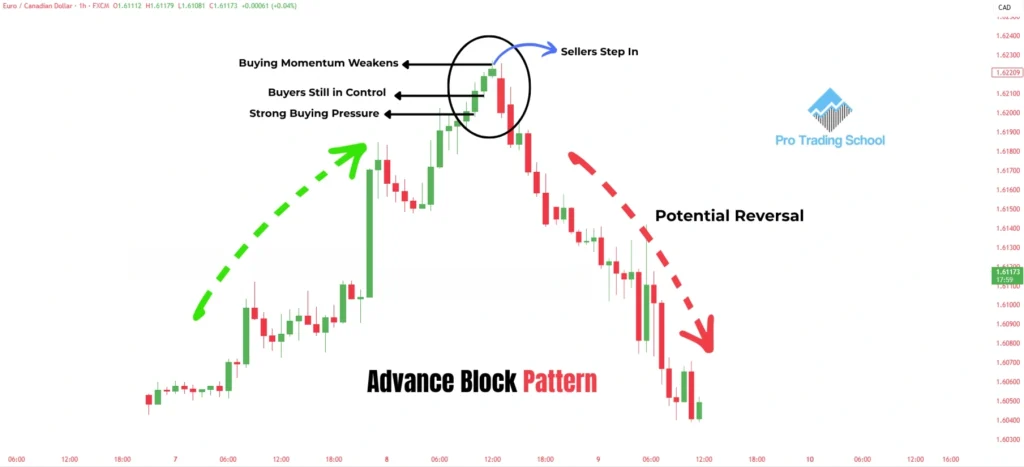
The Advance Block Candlestick Pattern provides valuable insight into the battle between buyers and sellers and reveals how bullish momentum gradually weakens before a potential market reversal.
Before the pattern forms, the market is in a clear uptrend, which means buyers are in control and continue pushing prices higher.
The first candle of the pattern confirms this bullish dominance, as it is a strong bullish candlestick that reflects aggressive buying pressure and confidence in the uptrend.
The second candle is still bullish, but its body is smaller than the first one and it usually develops a longer upper shadow. This change suggests that buyers are starting to lose momentum.
Although they are still able to push prices higher, sellers have begun to enter the market and are putting increasing pressure on the bulls, as shown by the upper wick.
The third candle has an even smaller body and typically forms another upper shadow. At this stage, buyers are losing conviction in the uptrend and many of them begin taking profits.
Meanwhile, sellers continue to step in and reject higher prices, preventing buyers from maintaining control of the market.
The Advance Block Pattern therefore reflects a gradual shift in market sentiment from bullish to bearish. It shows that buying pressure is weakening while selling pressure is increasing, which raises the probability of a bearish reversal.
When this pattern forms near a major resistance level, a supply zone, or after an extended rally, the odds of a trend reversal become even higher.
4 Advance Block Candlestick Pattern Trading Strategies
The Advance Block Candlestick Pattern can be combined with several technical analysis tools to build high-probability trading strategies.
Although the pattern is primarily considered a bearish reversal signal, it can also be used as a bearish continuation pattern in certain market conditions.
In this section, we will cover four practical trading strategies that you can use with the Advance Block Candlestick Pattern.
1-Trading the Advance Block Candlestick Pattern with a Resistance Level
This strategy is straightforward and does not require advanced technical analysis skills. All you need is a basic understanding of market structure. First, identify an uptrend and a significant resistance level, then wait for the market to test that resistance area.
Look at the chart example below.

As you can see, the market was trending upward, which indicates that buyers were in control. However, when price reached the resistance level, it was rejected, showing that buyers failed to break above resistance. This is the first sign of weakness.
The market then attempted to break the resistance level several more times. During the final attempt, the Advance Block Candlestick Pattern formed.
The pattern indicates that buyers are gradually losing conviction and that bullish momentum is fading. The small third candle suggests that a shift in momentum may be about to occur.
This is your sell signal.You can place your entry at the close of the third candle, with a stop loss above the pattern, preferably a few pips above the resistance level to avoid being stopped out by market noise. The target can be set at the next support level.
As you can see, the market moved lower as expected.
This example is for educational purposes only and is designed to help you understand how to trade the Advance Block Pattern at resistance.
Always conduct a top-down analysis and avoid trading against the higher-timeframe trend. In addition, proper risk management is essential for long-term success.
Trading the Advance Block Candlestick Pattern with Bollinger Bands
The next strategy combines the Advance Block Pattern with Bollinger Bands. In this setup, the upper Bollinger Band acts as a dynamic resistance level and helps traders determine whether an upward move has become overextended.
When price reaches the upper Bollinger Band and buying momentum begins to weaken, there is an increased probability of a pullback or reversal.
Look at the chart example below.

As you can see, the market was trending upward, made a retracement, and then continued higher. Once price reached the upper Bollinger Band, the Advance Block Pattern formed.
The first candle indicates that buyers are still strong. The second candle is smaller, suggesting that buying pressure is weakening. The third candle is very small and forms upper and lower shadows, indicating indecision and a loss of bullish momentum.
This provides an attractive sell signal.
You can place your entry at the close of the third candle, set your stop loss above the pattern, and target the next support level.
This strategy often provides excellent risk-to-reward opportunities. In some cases, the trade can produce a reward-to-risk ratio greater than 5:1.
As always, use proper money management and perform a top-down analysis before entering any trade.
Trading the Advance Block Candlestick Pattern with a 20 Simple Moving Average
Most traders think that the Advance Block Candlestick Pattern can only be used as a bearish reversal signal. However, it can also be used as a bearish continuation pattern during a downtrend.
In this strategy, the 20 Simple Moving Average acts as a dynamic resistance level.
The rules are simple:
- The market should be in a clear downtrend.
- Wait for price to retrace toward the 20 Simple Moving Average.
- Once price reaches the moving average, wait for a bearish price action signal, such as the Advance Block Pattern.
Look at the chart example below.
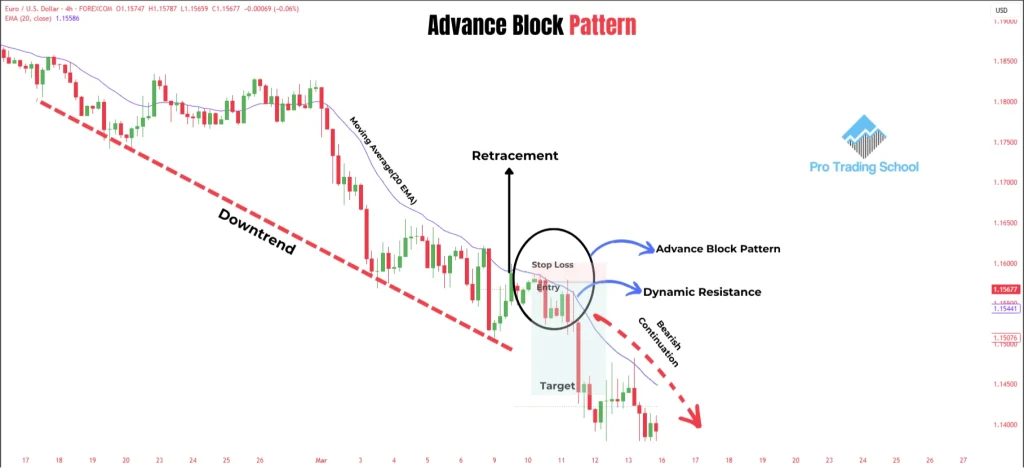
As you can see, the market was trending downward. Price retraced to the 20 Simple Moving Average and was rejected. Later, the market retraced once again, touched the moving average, and the Advance Block Pattern appeared.
The formation of the pattern signals the end of the pullback and the potential beginning of a new move lower.
To trade this setup, place your entry at the close of the third candle, set your stop loss above the pattern, and target the next support level.
This strategy focuses on trading pullbacks within a strong downtrend and can provide excellent continuation opportunities.
Since this strategy relies on the 20 Simple Moving Average acting as a dynamic resistance level, you may also want to read our guide on How to Use Moving Averages Like a Boss, where we explain how professional traders use moving averages to identify trends, pullbacks, and high-probability trade setups.
Trading the Advance Block Candlestick Pattern After a Break and Retest
This strategy uses the Advance Block Pattern as a bearish continuation signal after a break-and-retest setup.
The conditions are simple:
- The market must be in a downtrend.
- A support level must be broken.
- Price then retraces back to the broken support, which now acts as resistance.
- Once price reaches the new resistance level, wait for the Advance Block Pattern to form.
Look at the chart example below.
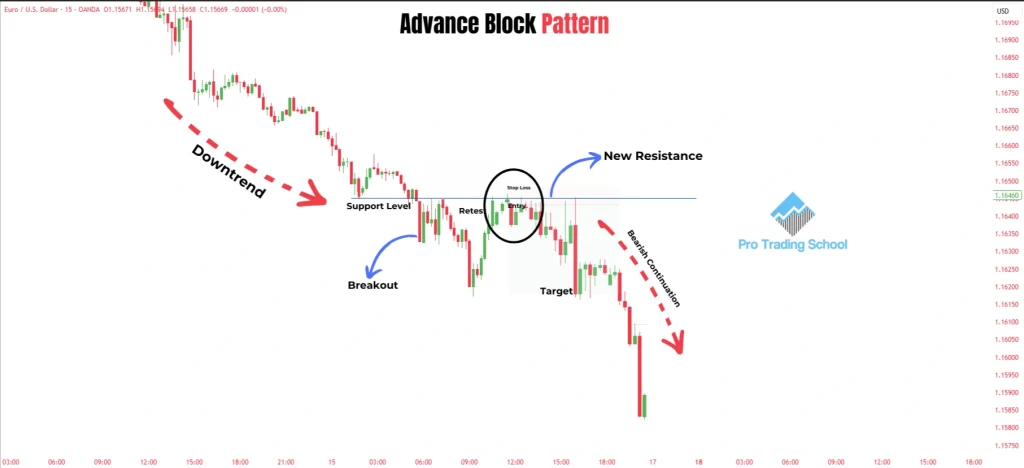
As you can see, the market was trending downward. It broke below a support level and then retraced back to test the broken support, which had become resistance.
Price was rejected and moved lower. It later retraced once again, tested the resistance level, and formed an Advance Block Candlestick Pattern.
The pattern indicates that the retracement is likely ending and that sellers may be preparing to resume the downtrend.
To trade this setup, place your entry at the close of the third candle, set your stop loss above the pattern, and target the next support level.
As you can see, the market moved toward the target as expected.
These strategies are intentionally simple because successful trading does not have to be complicated. However, always perform a top-down analysis, trade in the direction of the higher-timeframe trend whenever possible, and use proper risk management to achieve long-term profitability.
Conclusion
The Advance Block Candlestick Pattern is a valuable bearish price action pattern that signals a gradual loss of bullish momentum and a potential shift in market sentiment.
Although the pattern does not appear frequently, it can provide high-quality trading opportunities when it forms at key technical areas such as resistance levels, Bollinger Bands, moving averages, or after a break-and-retest setup.
Like any candlestick pattern, the Advance Block Pattern should not be traded in isolation. Combining it with market structure analysis, trend analysis, and proper risk management can significantly improve its effectiveness.
By understanding the psychology behind the pattern and practicing how to identify it on real charts, traders can add another powerful tool to their price action trading arsenal.
Frequently Asked Questions About the Advance Block Candlestick Pattern
Can the Advance Block Candlestick Pattern appear during a strong bull market?
Yes. The pattern can form even during powerful uptrends. However, in strong bullish markets, it may only lead to a short-term pullback rather than a complete trend reversal. This is why understanding the broader market context is important before taking a trade.
Does trading volume matter when the Advance Block Pattern forms?
Volume can provide additional insight into the pattern. If the third candle forms with increasing selling volume or declining buying volume, it may suggest that bullish momentum is fading. However, the pattern can still be traded in markets where volume data is unavailable, such as the spot forex market.
Can the Advance Block Pattern be used by day traders?
Yes. Intraday traders can use the pattern on lower timeframes to identify potential reversals or pullbacks. However, because lower timeframes contain more market noise, many traders prefer to combine the pattern with support and resistance levels or trend analysis.
Why does the Advance Block Pattern consist of three candles instead of one?
The pattern is designed to show a gradual loss of buying pressure. A single candle may only reflect temporary hesitation, while three consecutive candles showing weakening momentum provide stronger evidence that buyers are losing control of the market.
Is the Advance Block Pattern suitable for automated trading strategies?
Yes. Since the pattern has a clear three-candle structure, it can be coded into trading algorithms or scanners. Many traders use automated tools to identify the pattern and then apply discretionary analysis before entering a trade.
Does the Advance Block Pattern work better in trending or ranging markets?
The pattern tends to produce better signals after a sustained upward move because it reflects the gradual exhaustion of buyers. In a choppy, sideways market, the pattern may generate more false signals because momentum shifts occur more frequently.
How often does the Advance Block Candlestick Pattern occur?
The pattern is relatively uncommon compared with simple one-candle formations such as pin bars or doji patterns. Because it does not appear frequently, traders often monitor multiple markets and timeframes to find high-quality setups.










Very well explained.but there is any tape that can lessen too
Dear Chris,
Please advise which timeframe is the most favourable to adapt this Pattern, e.g. 1min, 5min, 15min….
Brgds
Fred Pan