
The Dark Cloud Cover is a bearish reversal candlestick pattern that forms during an uptrend and can signal a potential shift from bullish momentum to bearish momentum.
This formation consists of two candles. The first candle is bullish, showing strong buying pressure and continued upward momentum.
The second candle is bearish, opening above the previous candle’s high before reversing sharply and closing below the midpoint of the first candle’s body.
This sudden change in price action suggests that sellers are beginning to take control from buyers, which is why many traders consider this setup an early warning sign of a possible market reversal.
Key Takeaways
- The Dark Cloud Cover is a bearish candlestick pattern that forms after an uptrend.
- The pattern consists of two candles: one bullish candle followed by one bearish candle.
- The second candle closes below the midpoint of the first candle, signaling bearish pressure.
- The pattern shows that buyers are losing control while sellers are stepping into the market.
- The Dark Cloud Cover works best when combined with resistance levels and supply zones.
- Traders can also use the pattern during pullbacks in a downtrend as a continuation setup.
- The pattern becomes more reliable when combined with trend analysis and higher time frame confirmation.
- Proper risk management and stop-loss placement are essential when trading the setup.
- The Dark Cloud Cover should never be traded blindly without confirmation.
- The strongest setups occur when the pattern aligns with overall market structure and bearish momentum.
Structure of the Dark Cloud Cover Pattern

The Dark Cloud Cover formation consists of two candlesticks that appear after an upward price move.
The first candle is bullish and reflects strong buying pressure. During this trading session, buyers remain in control as the market closes above the opening price, continuing the existing uptrend.
The second candle opens at or above the closing price of the first candle, creating the impression that bullish momentum may continue.
However, sellers quickly step in and push the market lower. The candle then closes below its opening price and below the midpoint of the previous bullish candle.
This sharp bearish reaction is what gives the pattern its reversal potential, as it shows that sellers are beginning to overpower buyers.
In most charting platforms:
- The first candle is usually green on colored charts or white on black-and-white candlestick charts.
- The second candle is typically red on colored charts or black on monochrome candlestick charts.
The candle colors themselves are not the most important factor. What matters most is the strong bearish close into the body of the first candle, which signals weakening bullish momentum and increasing selling pressure.
What Does the Dark Cloud Cover Pattern Indicate?
Understanding the meaning behind the Dark Cloud Cover formation is more important than simply memorizing its structure.

This pattern gives traders insight into the battle between buyers and sellers and helps explain what may happen next in the market.
The first bullish candle confirms strong buying pressure, especially when it forms after an established uptrend. Buyers remain confident and continue pushing prices higher.
The second candle tells a completely different story. Even though the market opens higher, sellers quickly step in and take control of the session.
The bearish candle then closes below the midpoint of the previous bullish candle, showing that buying momentum is weakening and sellers are gaining strength.
This sudden shift in market sentiment suggests that buyers may be losing control while sellers are preparing to push the market lower.
However, the Dark Cloud Cover pattern should not be traded on its own. Like most candlestick formations, it becomes more reliable when combined with other factors of confluence such as:
- Resistance levels
- Supply and demand zones
- Liquidity sweeps
- Trend analysis
- Volume confirmation
- Higher time frame structure
In the next sections of this guide, we will cover how to trade this bearish reversal setup using high-probability confirmation techniques.
Dark Cloud Cover Candlestick Pattern Example
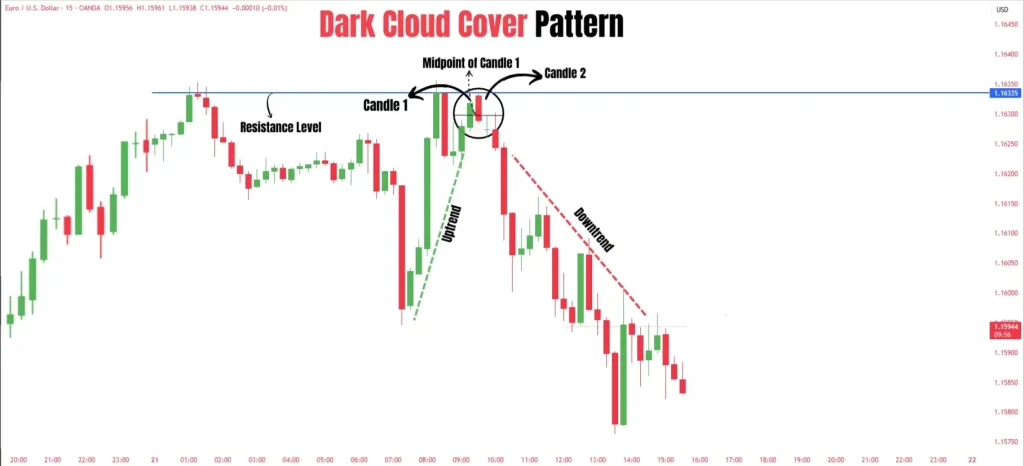
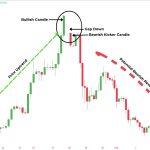
The chart example above shows how the Dark Cloud Cover pattern forms on a real price chart.
As you can see, the formation begins with a bullish candle followed by a bearish candle that closes below the midpoint of the previous candle’s body.
Notice that the market was already trending upward before the pattern appeared. After the formation developed, price started reversing to the downside, highlighting the bearish reversal potential of this candlestick setup.
This example is only meant to help you visually identify the pattern on a live chart. Like most candlestick formations, the Dark Cloud Cover should not be traded on its own.
Traders should always combine it with other technical factors and confirmation signals to increase the probability of success.
If you want to learn more about other candlestick setups, feel free to check out our blog post: 33 Candlestick Patterns Cheat Sheet (Simple Visual Guide), where we cover some of the most powerful bullish and bearish candlestick patterns used in trading.
Dark Cloud Cover vs Piercing Pattern
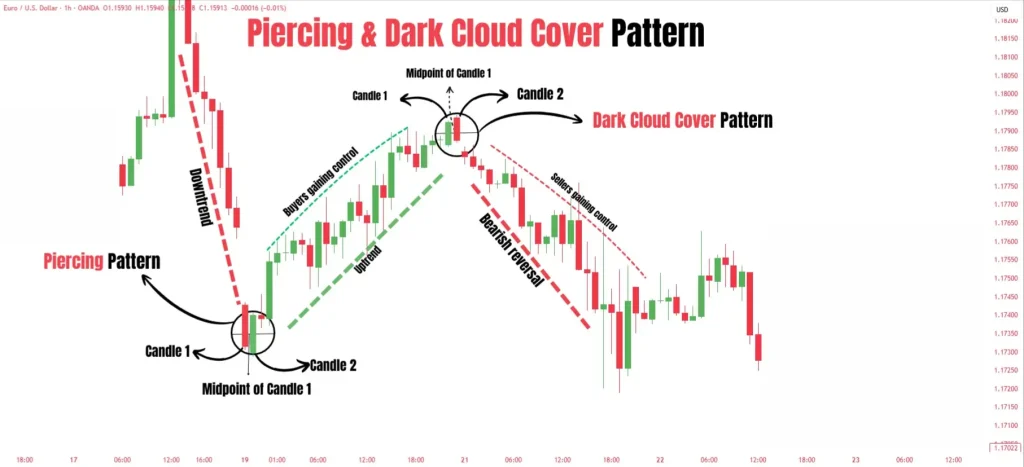
The Dark Cloud Cover formation is considered the bearish counterpart of the Piercing Pattern.
Both patterns consist of two candlesticks and signal a potential trend reversal, but they appear in opposite market conditions and reflect different shifts in momentum.
The Piercing Pattern forms after a downtrend. The first candle is bearish, confirming strong selling pressure.
The second candle opens below the previous candle, showing continued bearish sentiment at the beginning of the session.
However, buyers step in aggressively and push price higher, causing the candle to close above the midpoint of the first bearish candle. This signals a potential bullish reversal.
The Dark Cloud Cover setup works in the opposite direction. It forms after an established uptrend and signals that sellers may be taking control from buyers, increasing the probability of a bearish reversal.
Key Differences Between the Two Patterns
| Feature | Piercing Pattern | Dark Cloud Cover |
| Market Context | Forms during a downtrend | Forms during an uptrend |
| First Candle | Bearish candle | Bullish candle |
| Second Candle | Bullish candle | Bearish candle |
| Second Candle Close | Closes above the midpoint of the first candle | Closes below the midpoint of the first candle |
| Signal Type | Bullish reversal signal | Bearish reversal signal |
| Market Sentiment | Buyers gaining control | Sellers gaining control |
Even though these two candlestick formations are opposites, both patterns become more effective when combined with confirmation tools such as support and resistance, supply and demand zones, volume analysis, and overall market structure.
How to Trade the Dark Cloud Cover Pattern
There are several trading strategies that can be used with the Dark Cloud Cover candlestick pattern.
The pattern becomes much more reliable when combined with technical factors such as support and resistance, supply and demand zones, market structure, and trend analysis.
Let’s start with one of the most effective methods.
Dark Cloud Cover With Resistance Level Strategy
This strategy consists of identifying an established uptrend and then spotting a strong resistance level where buyers struggle to push the market higher.
Once the Dark Cloud Cover formation appears at that level, it can signal a potential bearish reversal.
Look at the chart example below. As you can see, the market was clearly trending upward, showing strong buying pressure.
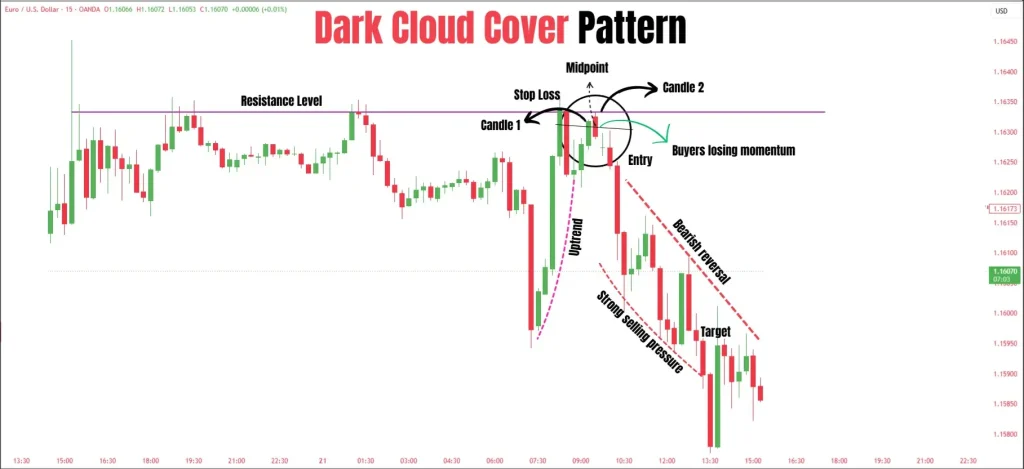
Price then reached a resistance area and reacted lower for the first time. This initial rejection is important because it signals that buyers may be losing momentum.
The second test of the resistance level provides even more valuable information. After retracing back toward the same area, the market forms a Dark Cloud Cover pattern.
The first bullish candle shows that buyers are still attempting to continue the uptrend. However, the second bearish candle closes below the midpoint of the first candle, revealing strong selling pressure and a possible shift in market sentiment.
When this bearish formation appears directly at a resistance level, it strengthens the probability of a trend reversal because it combines:
- Resistance rejection
- Weakening bullish momentum
- Strong bearish reaction
- Candlestick confirmation
Entry, Stop Loss, and Target
Traders typically place:
- The entry at the close of the second bearish candle
- The stop loss above the resistance level or above the high of the formation
- The profit target near the next support level or key market structure area
As shown in the example, the market moved lower after the confirmation and eventually reached the target area.
Dark Cloud Cover With Supply Zones
A supply zone is an area where the market previously moved down with strong momentum. This type of move is often considered an institutional selling move because it usually shows aggressive bearish pressure, not just random retail activity.
To identify a high-probability supply zone, look for these criteria:
- A strong bearish move away from the zone
- Large bearish candles showing selling pressure
- A break of previous market structure or support
- A fresh zone that has not been tested before
When these conditions are present, the supply zone becomes a high-probability area where sellers may step in again.
Once price retraces back to this zone, traders can wait for a bearish confirmation signal, such as the Dark Cloud Cover pattern.
Look at the chart example below.

As you can see, the market created a clear supply zone. To verify its quality, we can check the main criteria.
The move away from the zone was strong, the candles were large and bearish, the previous support level was broken, and the zone was still fresh.
This means we are dealing with a strong supply area.
Now look at what happened next. When price retraced back to the zone, a clear Dark Cloud Cover formation appeared. This shows that once buyers reached the supply area, sellers stepped in and pushed the market lower.
This reaction confirms that the supply zone is still valid and that bearish pressure may continue.
How to Trade This Setup
To trade this setup, traders can place:
- Entry: at the close of the second bearish candle
- Stop loss: above the supply zone
- Target: near the next key support level or demand area
As shown in the chart example, the market rejected the supply zone and moved toward the target area.
Important Notes Before Using This Strategy
Before moving to more advanced strategies, there are two important points to remember.
First, the Dark Cloud Cover is not a holy grail. It does not work every time, and no candlestick pattern can predict the market with 100% accuracy.
Always use a stop loss, manage your risk properly, and never risk your entire account on one single setup.
Second, always use top-down analysis. Without a higher time frame view, your analysis can be incomplete.
For example, if you trade on the 5-minute chart, check the 1-hour chart to see if the setup aligns with the bigger market direction. If you trade on the 1-hour chart, look at the daily chart for higher time frame confirmation.
This helps you avoid low-quality trades and focus only on setups that align with the bigger picture.
Trading Pullbacks With the Dark Cloud Cover Pattern
You might be surprised to see the Dark Cloud Cover discussed as a continuation setup after describing it earlier as a bearish reversal pattern.
The reason is simple. Although the Dark Cloud Cover is mainly known as a bearish reversal formation, it can also act as a bearish continuation signal during a downtrend.
This type of setup does not occur as frequently as reversal setups, but when it appears in the right market conditions, it can provide high-probability trading opportunities.
One of the most effective ways to use the pattern as a continuation signal is by trading pullbacks during a downtrend.
Look at the chart example below.

The strategy is simple. First, identify a market that is clearly trending downward. A downtrend indicates that sellers are in control of the market.
A bearish trend usually consists of two different moves:
- An impulsive move in the direction of the trend
- A retracement move against the trend
The impulsive move is the strong bearish move where price drops aggressively. The retracement move, also known as a pullback, happens when sellers take profits and buyers temporarily push the market upward.
The main challenge for traders is identifying the end of the pullback and the beginning of the next impulsive bearish move.
This is where support and resistance become extremely useful.
As you can see, the market was clearly trending downward, showing strong bearish momentum. Price then broke below a support level before retracing back upward to retest it.
Once a support level is broken, it often becomes a new resistance level. This level now acts as a reference point where sellers may step back into the market.
Now look at what happened next.
When price retraced back to the broken support level, a clear Dark Cloud Cover pattern formed. This bearish formation signaled that sellers were regaining control and that the pullback was likely ending.
The appearance of the pattern at resistance increased the probability of a continuation move to the downside.
As shown in the example, the market continued dropping after the confirmation signal.
That is how traders can use the Dark Cloud Cover pattern as a bearish continuation setup during a downtrending market.
Pros and Cons of the Dark Cloud Cover Pattern
The Dark Cloud Cover candlestick pattern is a strong and high-probability signal when it appears in the right market conditions. However, like all trading patterns, it also has limitations.
In the table below, you will find the main advantages and disadvantages of this candlestick formation based on real trading experience and practical market observation.
| Pros | Cons |
| Easy to identify on price charts | Can produce false signals in weak market conditions |
| Provides early warning signs of bearish reversals | Not reliable when traded alone |
| Works well with support and resistance levels | Requires confirmation for higher accuracy |
| Can be combined with supply and demand zones | Less effective in sideways or choppy markets |
| Suitable for multiple time frames | Beginners may confuse it with other candlestick patterns |
| Helps traders spot weakening bullish momentum | Risk of entering too early before confirmation |
| Can be used for both reversal and continuation setups | Does not guarantee a market reversal every time |
| Works well with price action trading strategies | Market context is required for proper interpretation |
| Offers clear stop-loss placement opportunities | Strong bullish trends can invalidate the setup quickly |
| Useful for swing trading and day trading | Lower probability without volume or trend confirmation |
Conclusion
The Dark Cloud Cover candlestick pattern is one of the most powerful bearish candlestick formations traders use to identify potential market reversals and continuation opportunities.
When this pattern forms at key areas such as resistance levels, supply zones, or during pullbacks in a downtrend, it can provide high-probability trading setups with clear entry, stop-loss, and target levels.
However, the Dark Cloud Cover should never be traded blindly or used on its own. The strongest setups occur when the pattern aligns with other factors of confluence such as market structure, trend analysis, support and resistance, liquidity sweeps, and higher time frame confirmation.
Like every trading strategy, success comes from discipline, risk management, and understanding the overall market context rather than relying on a single candlestick pattern alone.
Frequently Asked Questions
Is the Dark Cloud Cover bullish or bearish?
The Dark Cloud Cover candlestick pattern is considered a bearish candlestick formation. It usually appears after an uptrend and signals that sellers may be taking control from buyers, increasing the probability of a downward move.
What does the Dark Cloud Cover signal mean?
The Dark Cloud Cover signals weakening bullish momentum and growing selling pressure. The pattern shows that buyers initially pushed the market higher, but sellers regained control and closed the price below the midpoint of the previous bullish candle.
This shift in sentiment can indicate a potential bearish reversal or continuation move depending on the market context.
Does the Dark Cloud Cover pattern have a high success rate?
The success rate of the Dark Cloud Cover depends heavily on market conditions and confirmation factors.
The pattern tends to perform better when it forms at key resistance levels, supply zones, or during pullbacks in a downtrend. Traders often combine it with volume analysis, market structure, and higher time frame confirmation to improve accuracy.










Thank you so much