
The bearish engulfing candlestick pattern is a two-candle reversal pattern that forms after an uptrend.
It occurs when a large bearish candle completely engulfs the body of the previous bullish candle, signaling that sellers have taken control of the market and that a potential downward price reversal may occur.
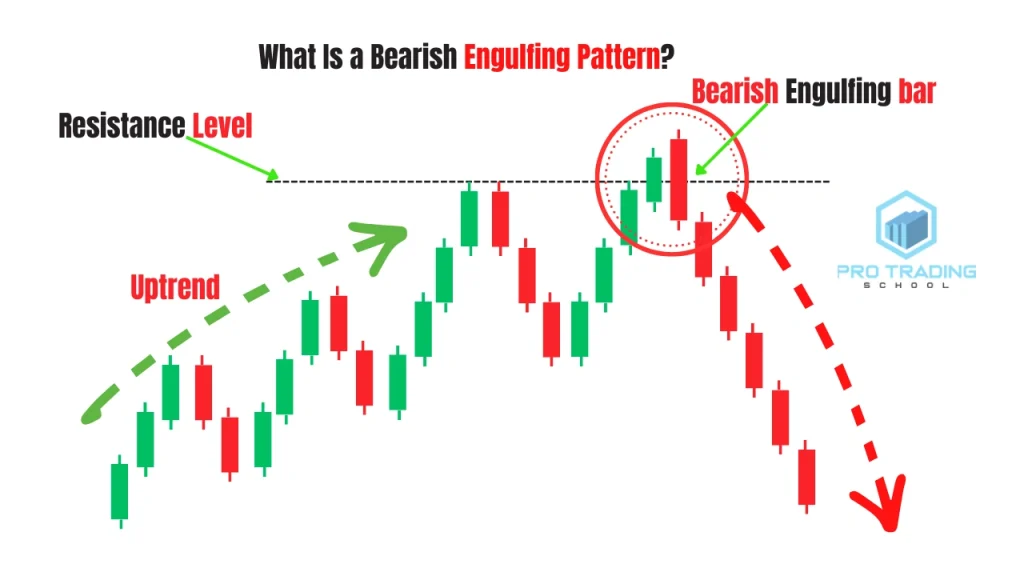
Table of Contents
Key Takeaways
-The bearish engulfing candlestick pattern is a two-candle reversal pattern that shows strong selling pressure after buyers previously pushed the market higher.
-The pattern forms when a large bearish candle completely engulfs the body of the previous bullish candle, indicating that sellers have taken control of the market.
-A bearish engulfing candlestick pattern is most reliable when it appears after an uptrend, where it can signal the beginning of a potential market reversal.
-In a downtrend, bearish engulfing candles can also appear during pullbacks and may signal the continuation of the existing bearish trend.
-The pattern becomes more powerful when it forms near key resistance levels, supply zones, or liquidity areas where sellers are likely to enter the market.
-Traders should avoid relying on the pattern alone and instead combine it with technical confluence, such as support and resistance, trend analysis, or liquidity sweeps.
-The bearish engulfing pattern tends to be less reliable inside choppy or range-bound markets, where price movements lack clear directional momentum.
The Anatomy of the Bearish Engulfing Candlestick Pattern
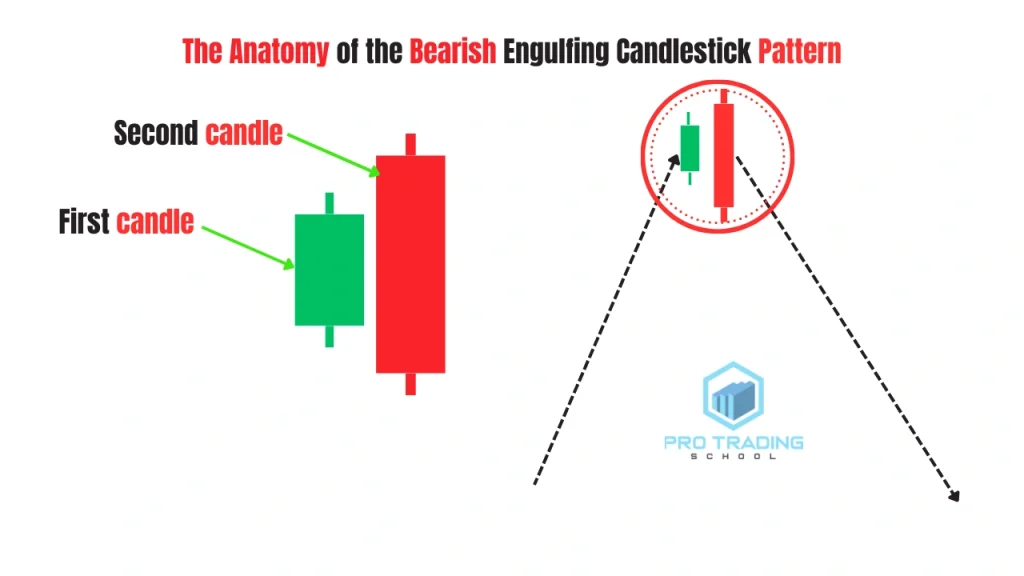
To properly identify a bearish engulfing candlestick pattern, traders need to understand the structure of the two candles that form this setup. The pattern consists of two consecutive candlesticks that reflect a shift in market control from buyers to sellers.
First Candle: The Bullish Candle
The first candle is usually a bullish candle, meaning the closing price is higher than the opening price. This candle represents continued buying pressure and suggests that buyers are still in control of the market. In many cases, this candle forms near the end of an uptrend or during a temporary upward retracement.
Second Candle: The Bearish Engulfing Candle
The second candle is a strong bearish candle that completely engulfs the real body of the previous bullish candle. This means that the opening price of the bearish candle is typically above the close of the previous candle, while the closing price falls below the previous candle’s opening price.
This complete engulfing of the previous candle’s body signals that sellers have suddenly entered the market with strong momentum, overpowering the buyers who were previously in control.
The Importance of the Real Body
When analyzing a bearish engulfing candlestick pattern, traders mainly focus on the real body of the candles, which represents the difference between the opening and closing prices.
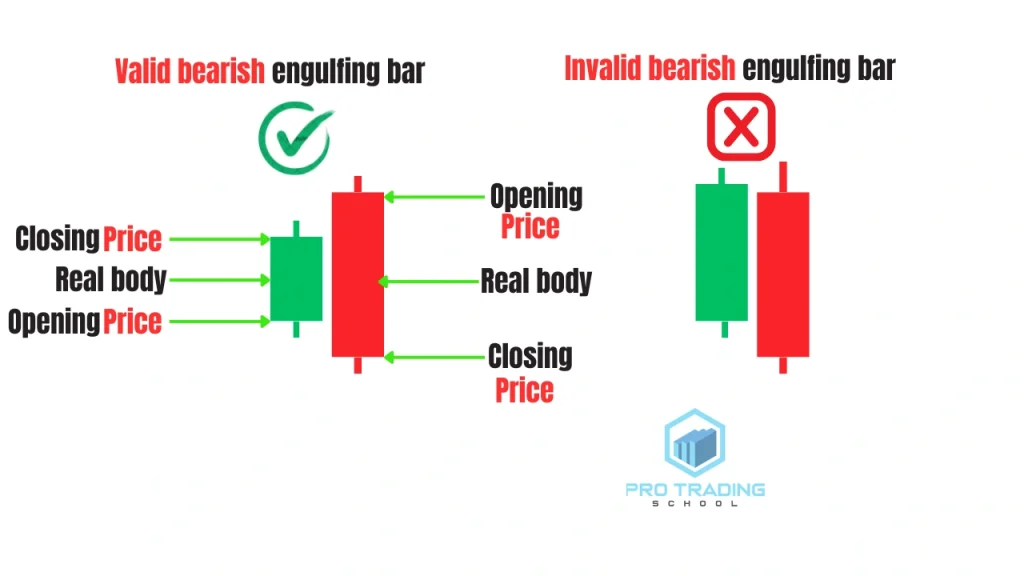
For the pattern to be considered valid, the real body of the bearish candle must fully engulf the real body of the previous bullish candle. The shadows or wicks are generally less important, as they only represent temporary price fluctuations during the trading session.
To see how this pattern works in real market conditions, explore our collection of bearish engulfing chart examples.
Market Psychology Behind the Pattern
The anatomy of the bearish engulfing pattern reflects a sudden shift in market sentiment. Buyers initially push the price higher during the first candle, reinforcing the bullish trend.
However, during the next period, sellers step in aggressively and drive the price lower, completely absorbing the previous buying pressure.
This strong transition from buying dominance to selling dominance is what makes the bearish engulfing candlestick pattern a potential signal of a market reversal.
The Psychology Behind the Bearish Engulfing Candlestick Pattern
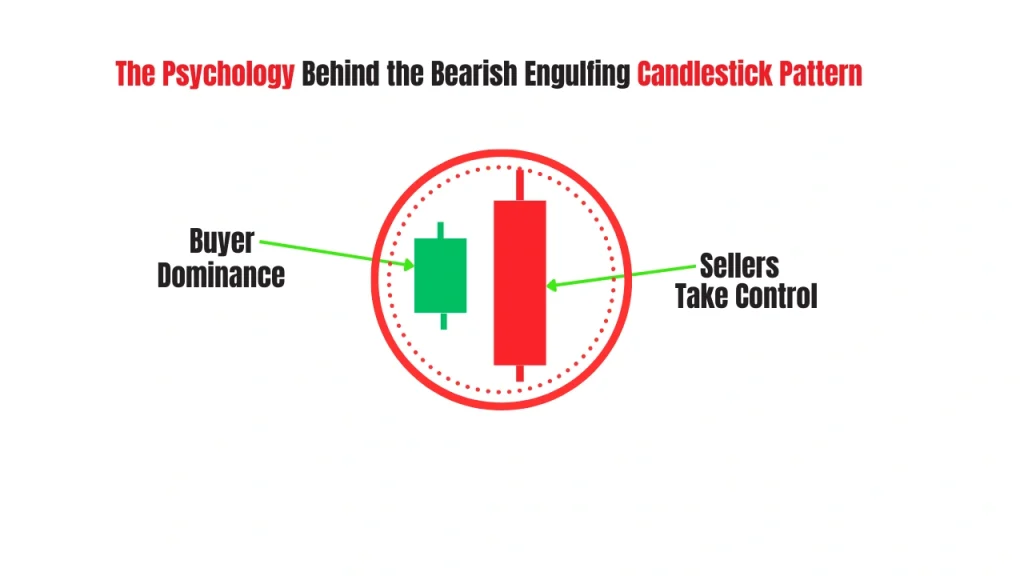
To fully understand the bearish engulfing candlestick pattern, it is important to analyze the market psychology behind the two candles that form this setup. Each candle reflects a shift in the balance of power between buyers and sellers.
Buyer Dominance During the First Candle
The first candle of the pattern is usually a bullish candle, which indicates that buyers are still in control of the market. During this period, traders continue to push prices higher, reinforcing the current bullish momentum.
However, this buying pressure may begin to weaken as the market approaches important levels such as resistance zones, supply areas, or previous highs.
Sellers Take Control During the Second Candle
The second candle is a strong bearish candle that completely engulfs the body of the previous bullish candle. This sudden shift shows that sellers have aggressively entered the market and overwhelmed the buyers.
In simple terms, the buyers who were previously in control lose the battle, and sellers take over the market momentum. This strong shift in order flow is what makes the bearish engulfing pattern a potential reversal signal.
Psychology in an Uptrend
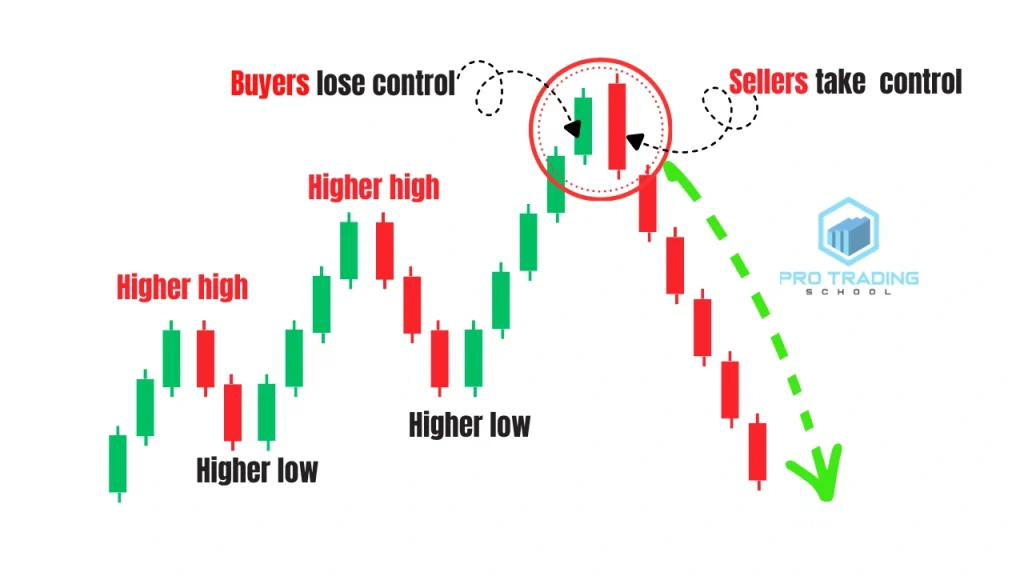
When the bearish engulfing candlestick pattern appears during an uptrend, it often signals that buyers are losing control of the market. After a period of rising prices, sellers suddenly step in with enough strength to reverse the previous bullish momentum.
This transition from buyer dominance to seller dominance can mark the beginning of a new downward move.
Psychology in a Downtrend
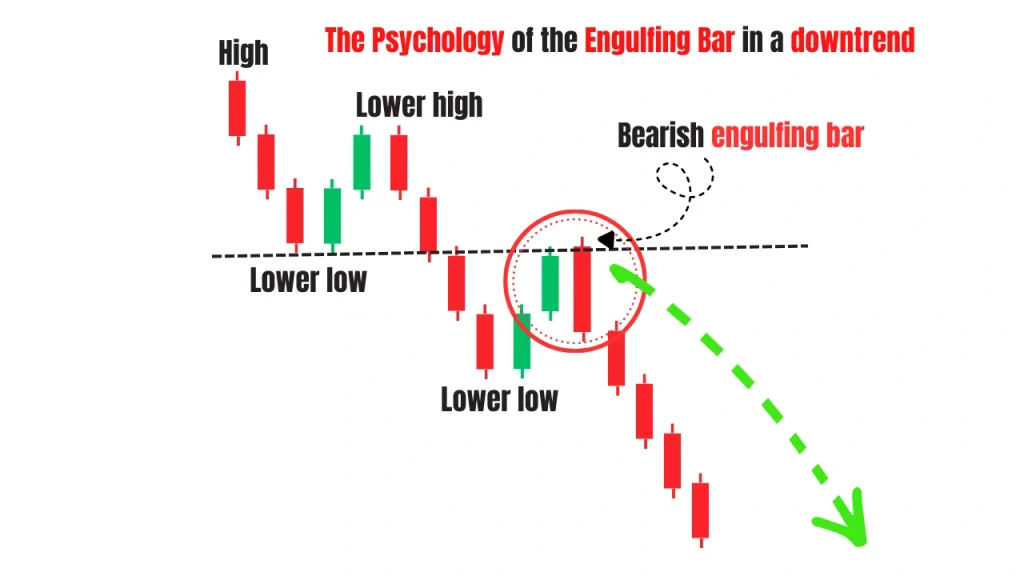
In a downtrending market, sellers are already in control. In this situation, the first bullish candle simply represents a temporary attempt by buyers to push the market higher.
However, the formation of a bearish engulfing candle confirms that sellers are still dominating the market. This pattern often appears during pullbacks within a downtrend, signaling a continuation of the existing bearish trend.
To fully understand this setup, it’s important to know the difference between bullish and bearish engulfing patterns.
Psychology in a Range-Bound Market
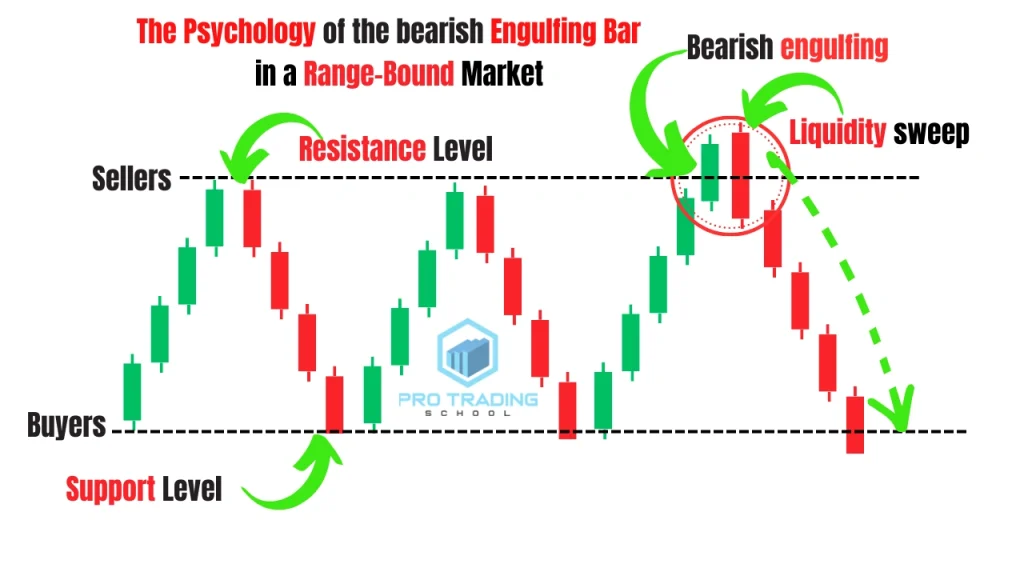
When the market is moving sideways, buyers and sellers are generally balanced. In these conditions, price tends to oscillate between support and resistance levels.
However, institutional traders and smart money often create liquidity traps around these key levels. For example, when price approaches resistance, the market may briefly break above the range, encouraging retail traders to open buy positions.
If a bearish engulfing candle forms after this breakout and closes back inside the range, it often indicates that buyers have been trapped. Their stop-loss orders become buy-side liquidity, which can fuel a move back toward the support level.
This is why the bearish engulfing pattern can be particularly powerful when it forms near major resistance levels or liquidity zones.
The effectiveness of this setup depends on several factors. To learn more about its reliability, read this guide on how strong is a bearish engulfing pattern.
How to Trade the Bearish Engulfing Candlestick Pattern
When trading the bearish engulfing candlestick pattern, correctly identifying the market trend is one of the most important factors for success. In fact, understanding whether the market is trending upward or downward can account for a large portion of the probability behind this setup.
If you want to learn what confirms a bearish engulfing pattern in detail and avoid false signals, check out this complete guide.
Many traders lose money with engulfing patterns because they misinterpret the market trend. If the pattern appears against the dominant trend or in a weak market structure, the signal becomes far less reliable.
This is why the bearish engulfing candlestick pattern should never be traded in isolation. Instead, it should be combined with trend analysis, key levels, and chart patterns.
Trading the Bearish Engulfing Pattern During an Uptrend
Let’s first look at how to trade the bearish engulfing candlestick pattern in an uptrending market.
In an uptrend, the market forms higher highs and higher lows, which indicates that buyers are in control. However, even strong trends eventually reach areas where selling pressure begins to appear, such as resistance levels or previous market highs.
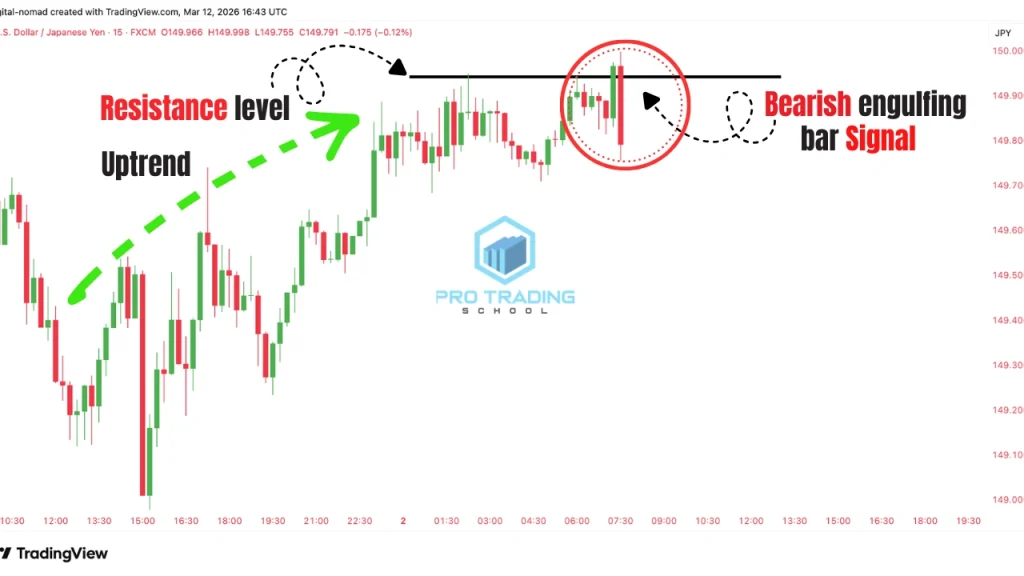
In this example, the market moves upward and eventually reaches a resistance level where price reacts and moves lower. This first rejection indicates that buyers may be starting to lose control at that level.
Later, price returns to the same resistance level for a second time. When the market reaches this level again, a bearish engulfing candlestick pattern forms.
The first bullish candle shows that buyers are still attempting to push the price higher. However, the following bearish candle completely engulfs the previous candle, indicating that sellers have stepped in with strong momentum.
At this point, the market structure forms a double top pattern, which is a well-known reversal chart pattern. The combination of the resistance level, the double top formation, and the bearish engulfing candlestick pattern suggests that buyers are weakening and that sellers are likely to take control.
This example illustrates an important principle: the bearish engulfing pattern should not be traded alone. Instead, it becomes much more powerful when it aligns with other technical factors such as trend structure, resistance levels, and reversal patterns.
Entry, Stop Loss, and Target
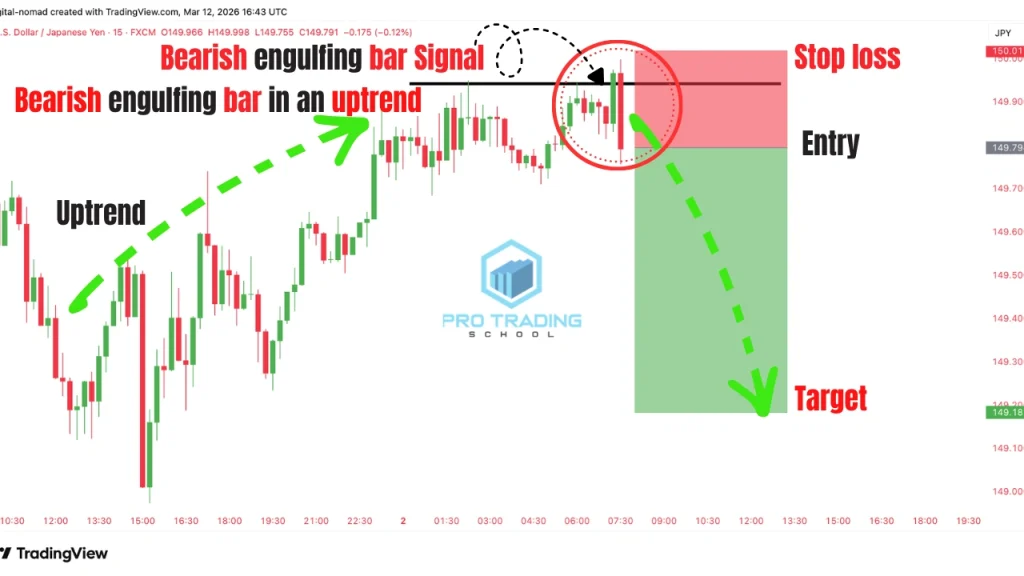
Once the bearish engulfing candle closes, traders can consider entering a sell position.
- Entry: At the close of the bearish engulfing candle
- Stop Loss: Above the high of the engulfing candle
- Target: The next support level or key demand zone
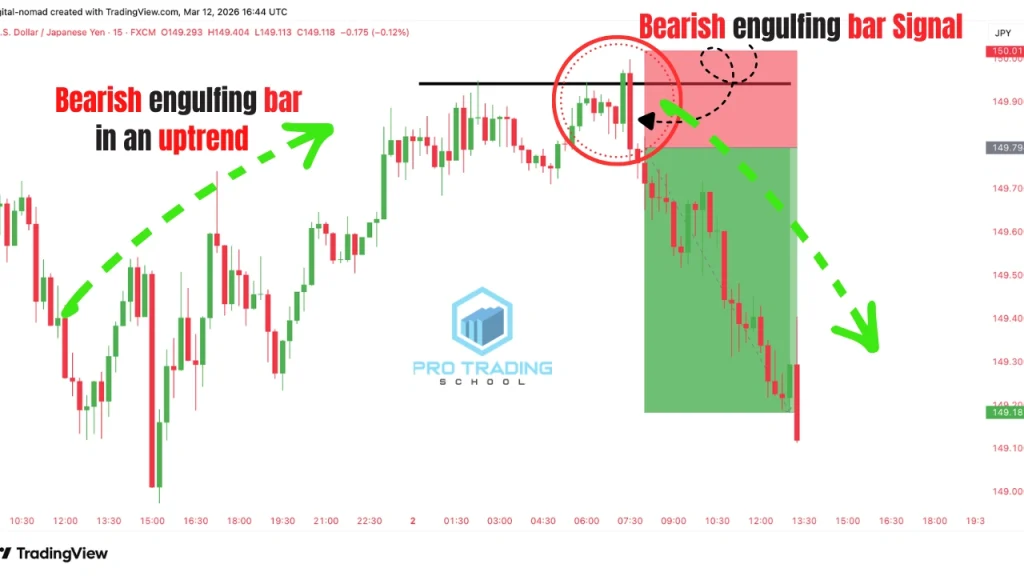
This approach allows traders to manage risk while targeting the next potential area where price may react.
The Importance of Top-Down Analysis
Another key element when trading the bearish engulfing candlestick pattern is performing proper top-down analysis.
Before entering a trade, traders should always check the higher time frame, such as the daily or four-hour chart, to ensure that the overall market direction supports the trade idea.
If the higher time frame trend is still strongly bullish, trading a bearish engulfing setup on a lower time frame may result in trading against the dominant trend, which significantly increases the risk of losses.
Aligning the higher time frame with the trading time frame greatly improves the reliability of the bearish engulfing setup.
Trading the Bearish Engulfing Candlestick Pattern With the Trend
While the bearish engulfing candlestick pattern is often known as a reversal signal, it can also act as a continuation pattern that helps traders enter an already established downtrend.
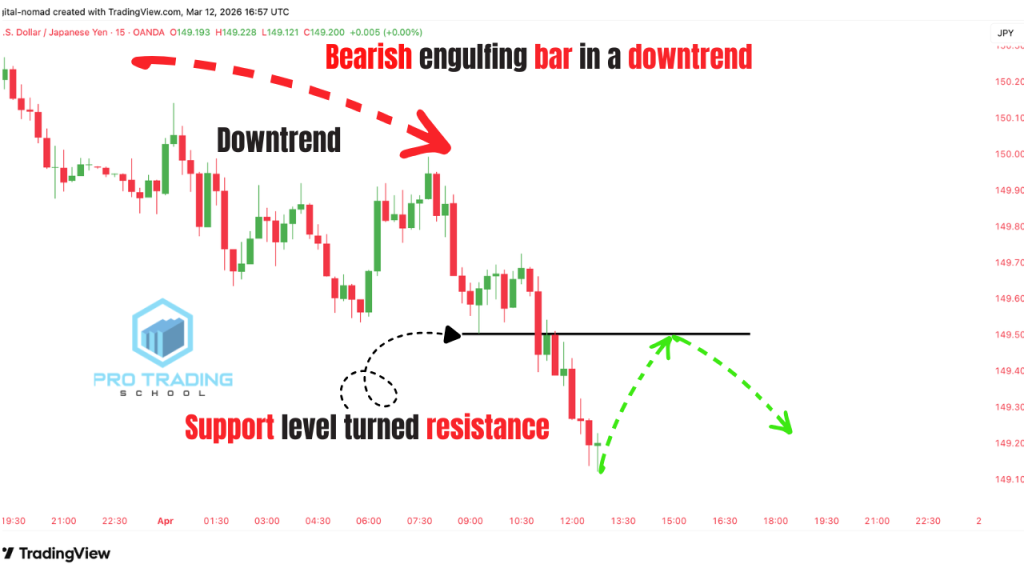
When the market is trending downward, price typically moves in a sequence of impulsive moves followed by retracements. The impulsive moves represent strong selling pressure, while the retracements represent temporary pullbacks where buyers attempt to push the market higher.
However, traders should not take a bearish engulfing pattern anywhere in the downtrend. The most reliable setups occur when the pattern forms at important technical levels.
Waiting for a Break and Retest
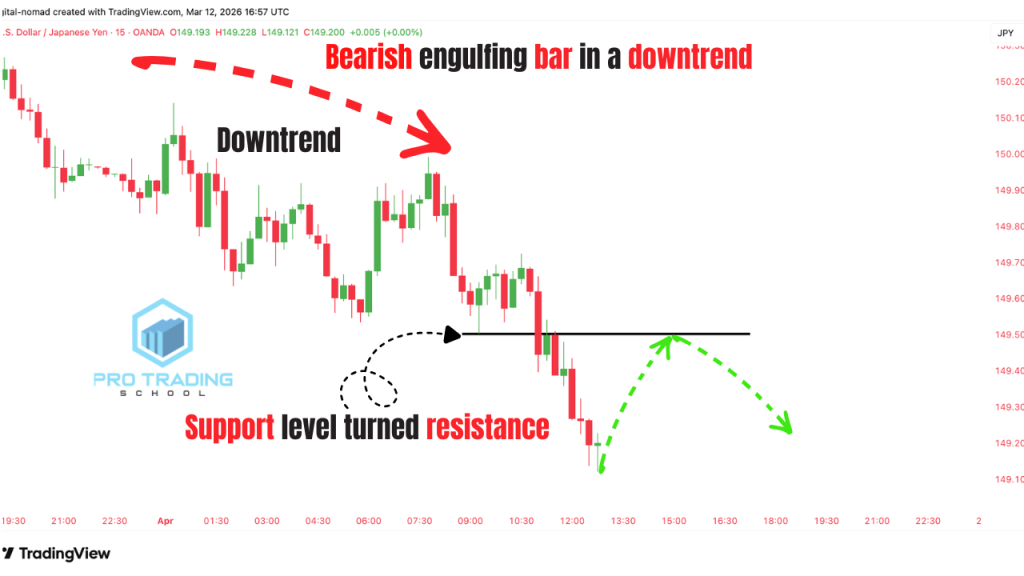
A common high-probability setup occurs when the market breaks below a support level and then retraces back toward that level. Once the support level is broken, it often turns into a new resistance level.
Traders then wait for price to retest this level. If a bearish engulfing candlestick pattern forms at the new resistance, it often signals that the retracement is ending and that sellers are preparing to push the market lower again.
In this situation, the bearish engulfing candle confirms that sellers have regained control after the pullback.
Riding the Next Impulsive Move
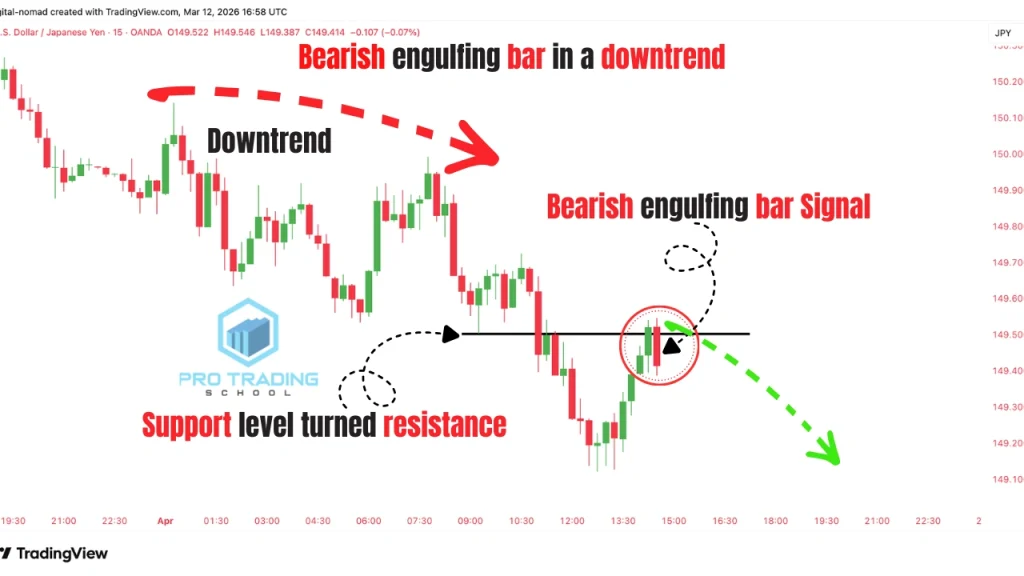
As shown in the chart example, the formation of a bearish engulfing candlestick pattern at a retested resistance level provides a strong opportunity to trade in the direction of the downtrend.
Once the second candle closes and the pattern is confirmed, traders can consider entering a sell position.
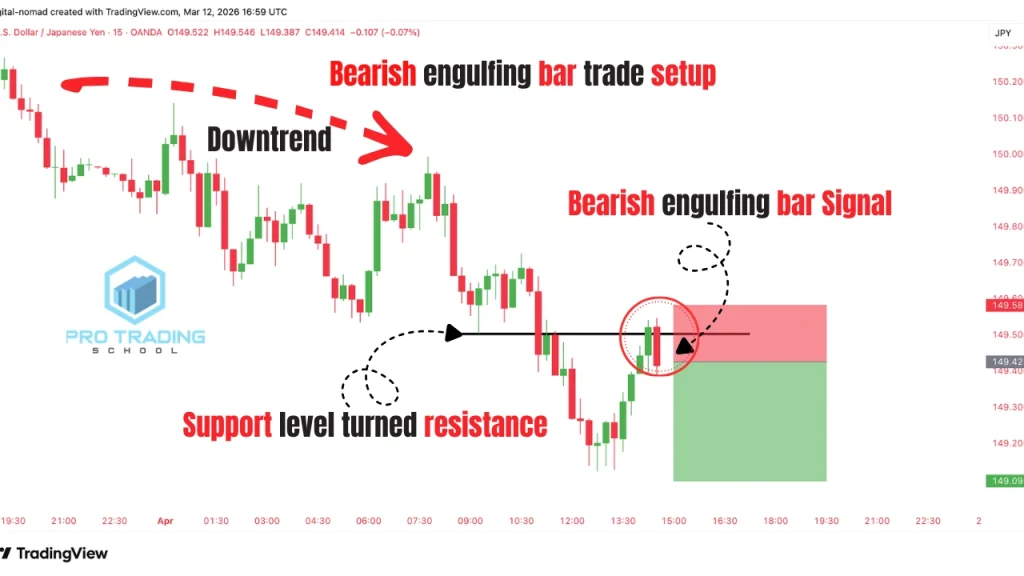
- Entry: At the close of the bearish engulfing candle
- Stop Loss: Above the high of the engulfing candle
- Target: The next support level

By combining the bearish engulfing pattern with trend direction and the break-and-retest structure, traders can significantly increase the probability of the setup.
The Importance of Top-Down Analysis
As mentioned earlier, it is essential to perform proper top-down analysis before taking any trade.
Always check the higher time frame to ensure that the overall market direction aligns with the trade idea. If the higher time frame is trending downward, the bearish engulfing continuation setup becomes much more reliable.
Without this alignment, traders may accidentally trade against the dominant market trend, which can lead to unnecessary losses even when the candlestick pattern appears valid.
Trading the Bearish Engulfing Candlestick Pattern in a Range-Bound Market
The bearish engulfing candlestick pattern can also provide valuable trading opportunities in a range-bound market. In this type of market environment, price moves sideways between clearly defined support and resistance levels.
When the market is ranging, buyers and sellers are generally in equilibrium, meaning that neither side has full control. Buyers typically wait for price to reach the support level to enter buy positions, while sellers wait for price to approach the resistance level to look for selling opportunities.
Because of this behavior, the best way to trade the bearish engulfing pattern in a range-bound market is to focus on resistance levels.
Selling at Resistance
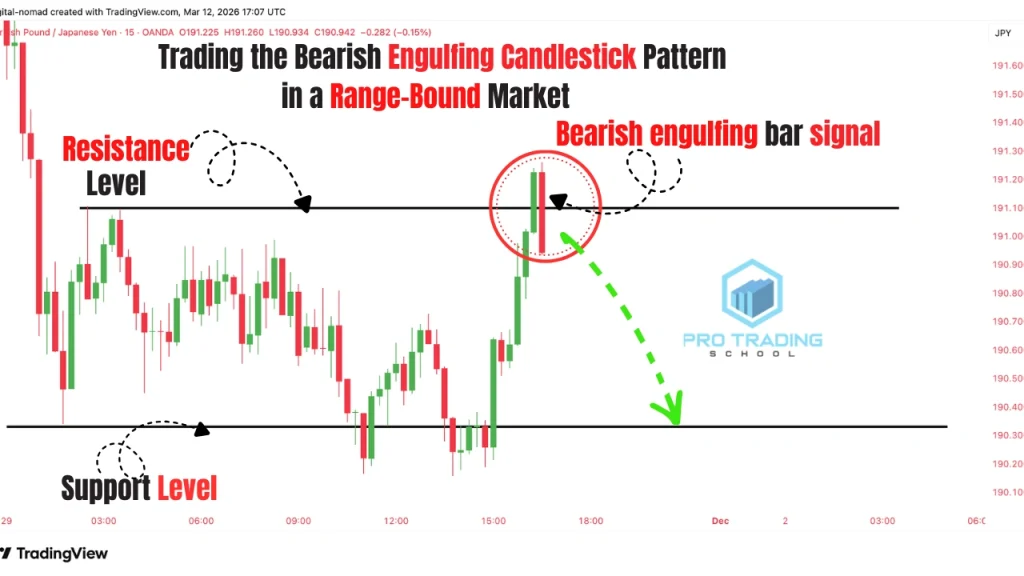
As shown in the chart example, the market moves sideways and repeatedly reacts between support and resistance. When price eventually reaches the resistance level again, traders watch for a bearish engulfing candlestick pattern to form.
The first bullish candle represents the final attempt by buyers to push the price higher. However, the second bearish candle completely engulfs the previous candle, signaling that buyers are losing momentum and sellers are stepping into the market.
This shift often happens because many buyers who entered the market near support decide to take profits at resistance, reducing buying pressure. At the same time, sellers begin opening new positions, which increases selling pressure.
When these two forces combine, the bearish engulfing candle forms and signals a potential reversal toward the support level.
Entry, Stop Loss, and Target
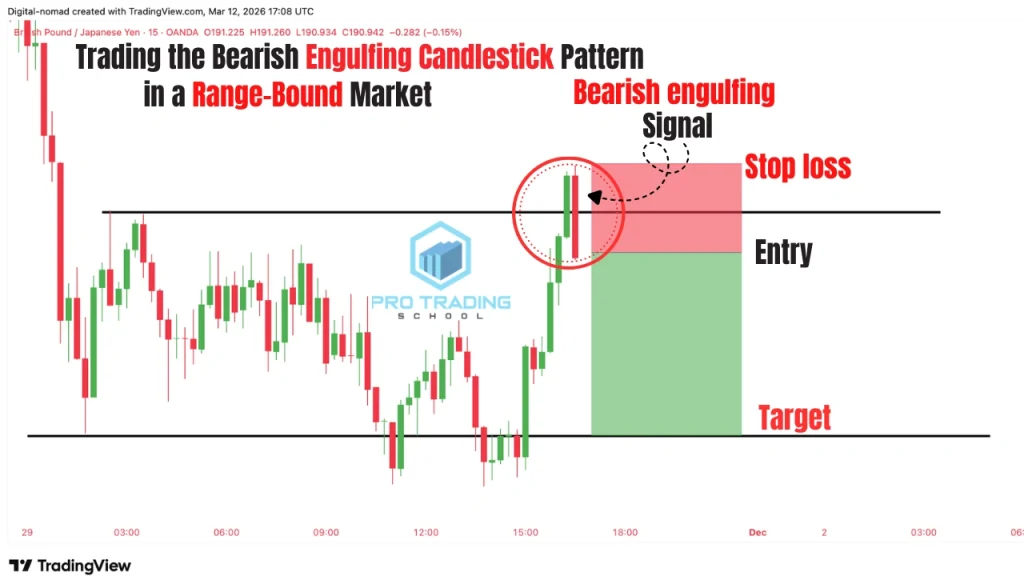
Once the bearish engulfing candle closes, traders can consider entering a sell position.
- Entry: At the close of the bearish engulfing candle
- Stop Loss: Above the high of the engulfing candle
- Target: The support level of the range
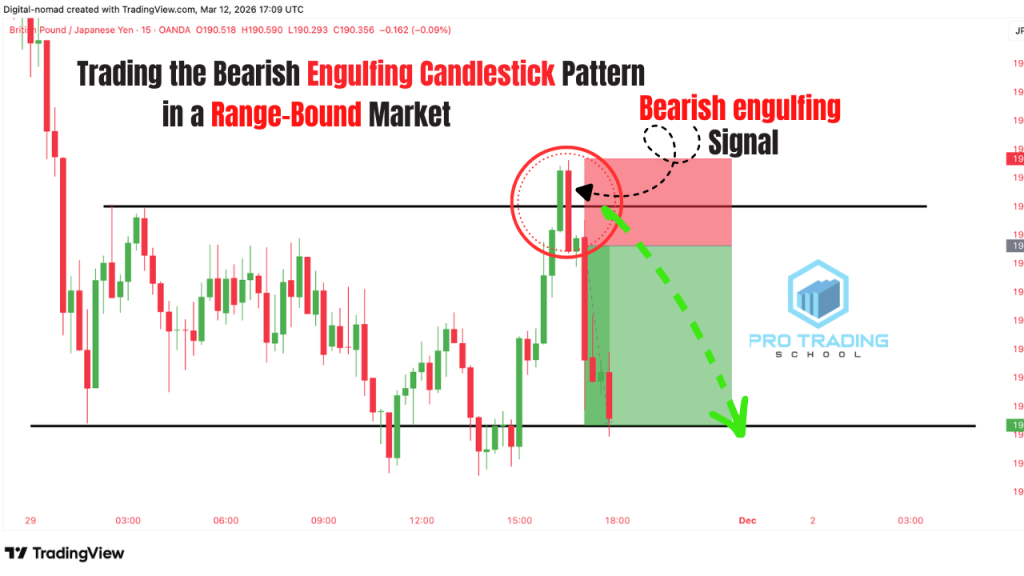
If the setup is valid, the market often moves back toward the lower boundary of the range.
Risk Management Is Essential
Although the bearish engulfing candlestick pattern can be a powerful signal, it is important to remember that no trading setup is a guaranteed outcome.
Even high-probability setups can fail due to unexpected market conditions or sudden changes in momentum. For this reason, traders should always apply proper risk management and avoid risking too much capital on a single trade.
By controlling risk and combining the bearish engulfing pattern with key levels and market structure, traders can significantly improve the consistency of their trading results.
Trading the Bearish Engulfing Candlestick Pattern After a Range Breakout
Another effective way to trade the bearish engulfing candlestick pattern is after the market breaks out of a range.
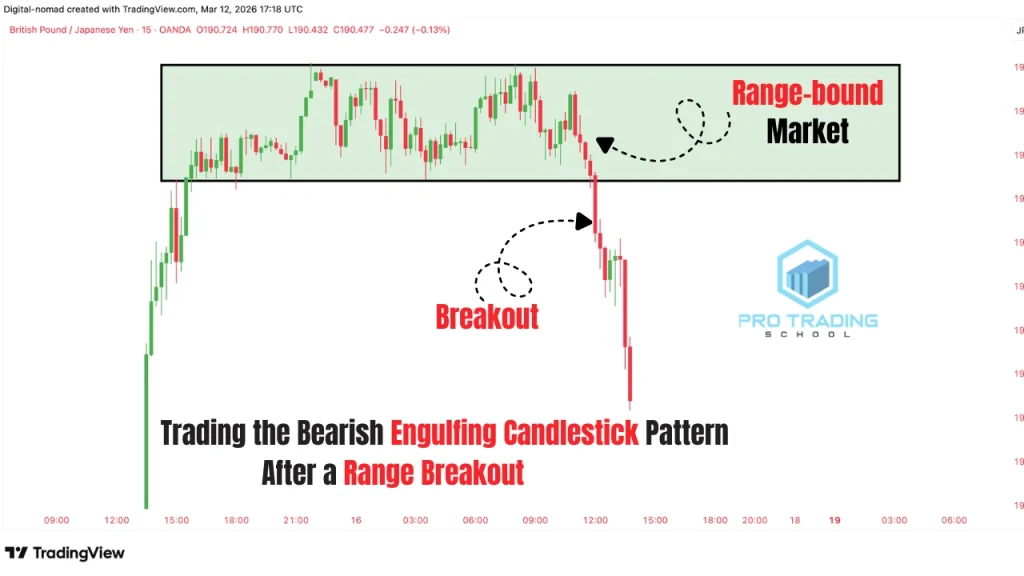
As shown in the chart example, the market was previously moving sideways, trading between clearly defined support and resistance levels. During this period, buyers and sellers were in equilibrium, causing the market to fluctuate within the range.
Eventually, the market breaks below the support level, signaling that sellers may be gaining control.
Waiting for the Retest
After the breakout occurs, traders should avoid entering the trade immediately. Instead, it is often better to wait for a retracement back to the broken support level.
In technical analysis, a broken support level frequently turns into a new resistance level. This is known as the break-and-retest principle, which is widely used by professional traders.
When price retraces back to this level, traders watch closely for signs that sellers are stepping back into the market.
Confirmation With the Bearish Engulfing Pattern
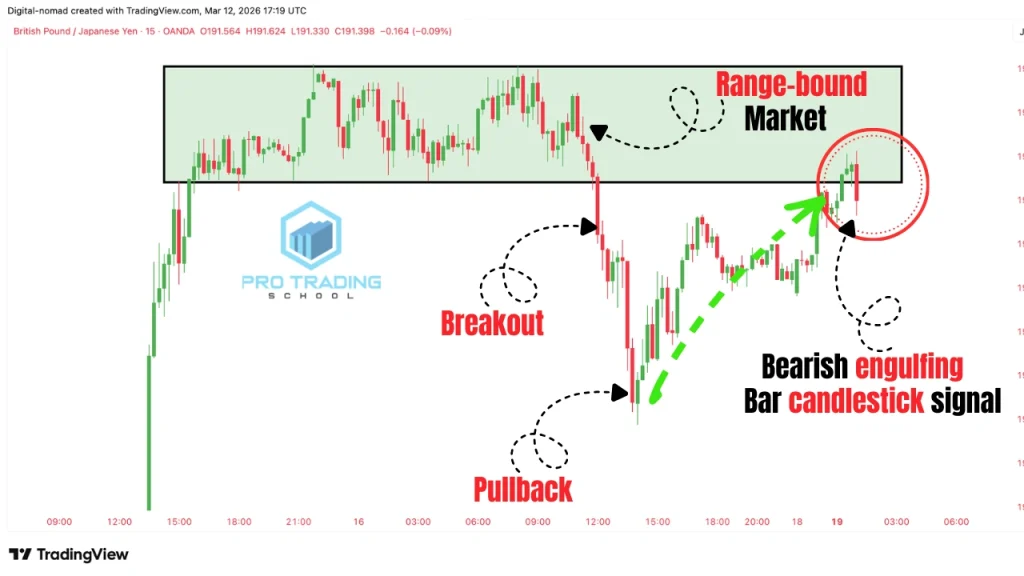
In the chart example, once price retraces to the previous support level, a bearish engulfing candlestick pattern forms.
This pattern signals that the retracement is likely ending and that sellers are beginning to regain control of the market. The strong bearish candle engulfing the previous candle indicates that selling pressure has returned.
This setup often marks the beginning of a new downward impulsive move.
Entry, Stop Loss, and Target
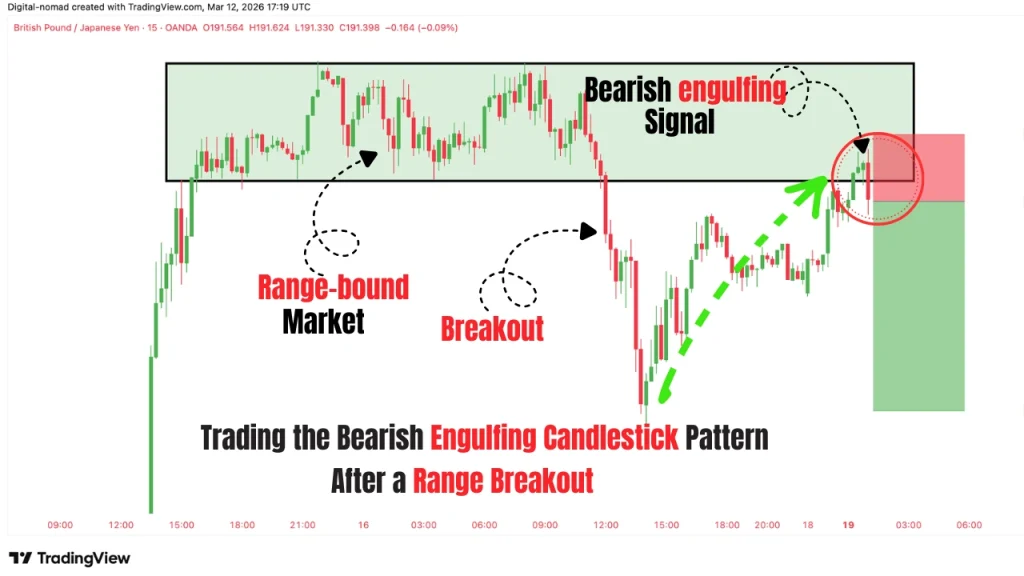
Once the bearish engulfing candle closes, traders can consider entering a sell position.
- Entry: At the close of the bearish engulfing candle
- Stop Loss: Above the high of the engulfing candle
- Target: The next support level
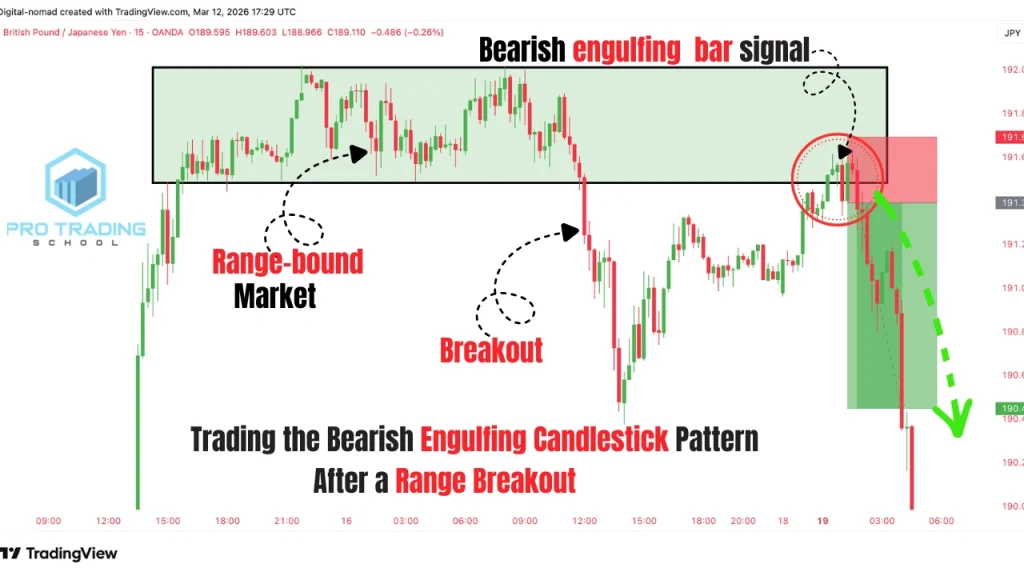
As shown in the example, once the pattern forms at the retested resistance level, the market often continues moving downward toward the next level.
Other Candlestick Patterns Can Confirm the Setup
It is also important to note that the bearish engulfing pattern is not the only confirmation signal that can appear after a break-and-retest.
Other bearish candlestick patterns can also indicate that the retracement is ending, such as:
- Doji candlestick pattern
- Shooting star pattern
- Bearish pin bar
- Bearish rejection candles
These patterns also reflect seller rejection at resistance and can provide additional confirmation that the market may continue moving downward.
Trading the Bearish Engulfing Candlestick Pattern With a Liquidity Sweep
One of the most advanced ways to trade the bearish engulfing candlestick pattern is by combining it with a liquidity sweep.
This strategy is commonly used by professional traders who focus on understanding how institutional traders move the market.
The idea behind this setup is simple: the market often moves toward areas where liquidity is concentrated, triggering stop-loss orders and pending orders before reversing direction.
This strategy consists of three main steps:
- Identify a liquidity area
- Wait for a buy-side liquidity sweep
Look for a bearish engulfing candlestick pattern as confirmation
Identifying a Liquidity Area
A liquidity area usually forms around key levels, such as resistance levels or previous market tops.
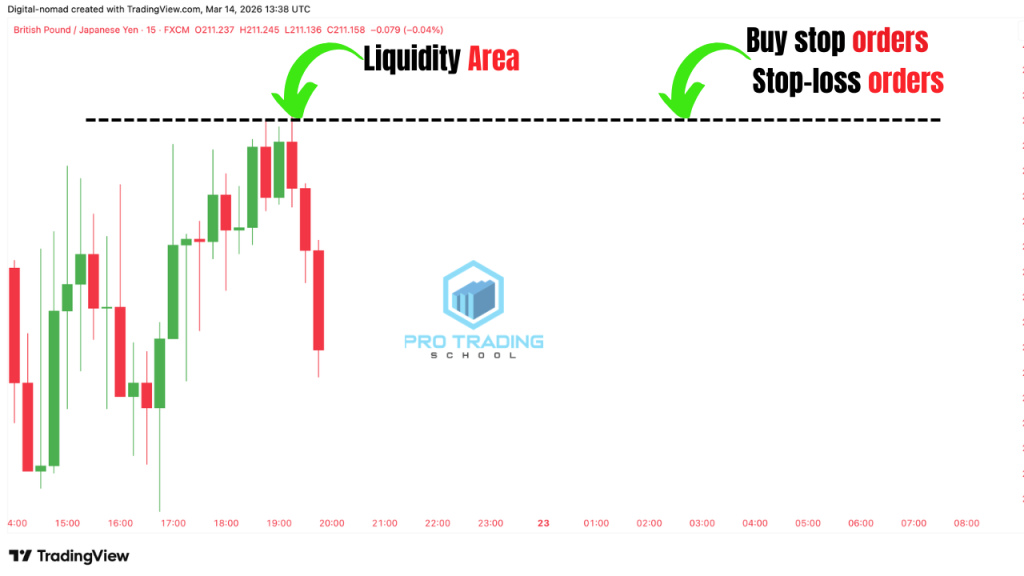
In this chart example, the market hits a level and reverses, forming a clear resistance level. At this level, many traders place different types of orders:
- Buy stop orders from breakout traders
- Stop-loss orders from sellers
- Limit sell orders from traders expecting a reversal
Because so many orders are concentrated around these levels, they become liquidity zones that institutional traders often target.
The Liquidity Sweep
When the market returns to this level, price may briefly break above the resistance before quickly reversing downward.
This movement is known as a liquidity sweep or stop hunt. During this move, the market triggers the stop-loss orders and pending buy orders placed above the resistance level.
Once these orders are activated, they create market liquidity, which allows large institutional traders to enter significant sell positions.
Confirmation With the Bearish Engulfing Pattern
After the liquidity above the resistance level is taken, traders wait for a confirmation signal.
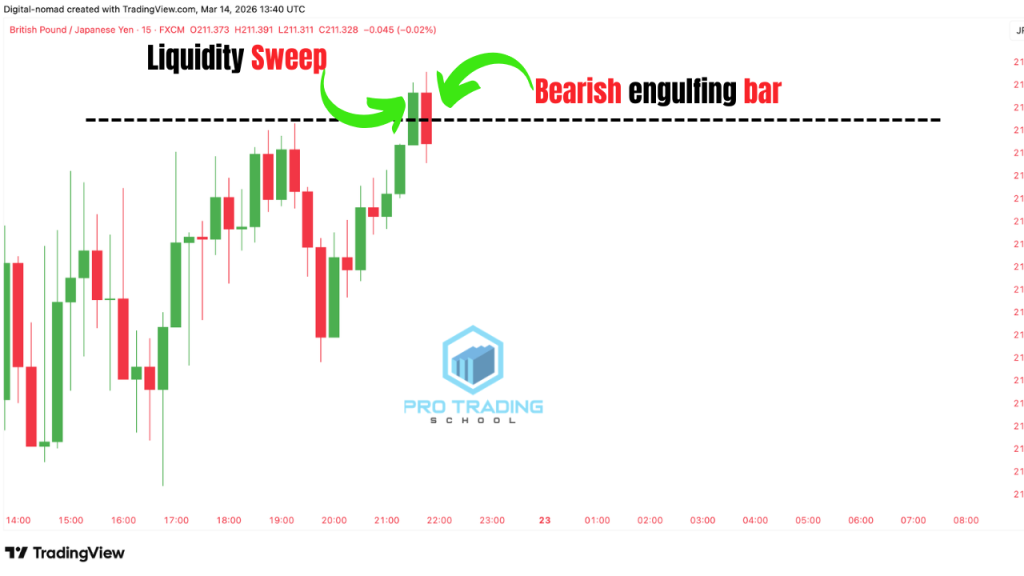
In the chart example, a bearish engulfing candlestick pattern forms immediately after the breakout. The first candle briefly pushes above the resistance level, while the second candle strongly reverses and completely engulfs the previous candle, closing back below the level.
This price action indicates that the breakout was a false breakout, and that sellers have taken control of the market after the liquidity sweep.
Entry, Stop Loss, and Target
Once the bearish engulfing candle closes, traders can consider entering a sell position.
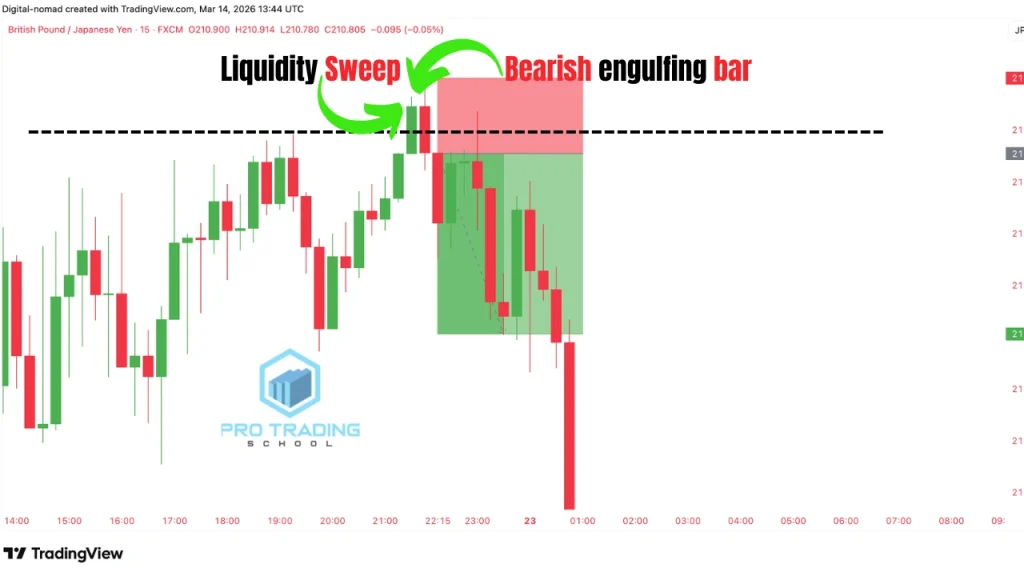
- Entry: At the close of the bearish engulfing candle
- Stop Loss: Above the high of the liquidity sweep
- Target: The next support level
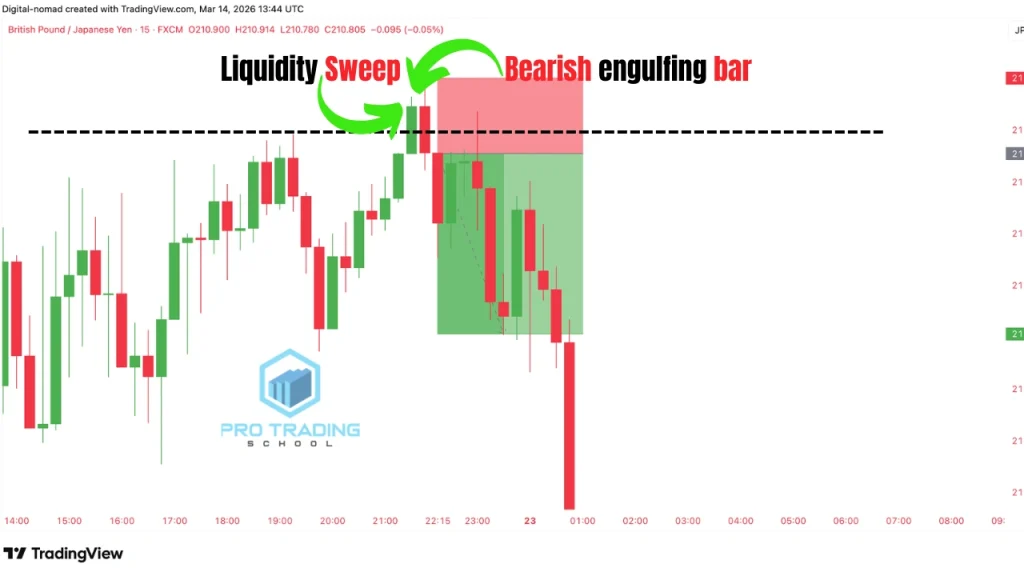
As shown in the example, once the liquidity is taken and the bearish engulfing pattern confirms the rejection, the market often moves strongly in the opposite direction.
Advantages and Limitations of the Bearish Engulfing Candlestick Pattern
| Advantages | Explanation |
| Strong Reversal Signal | The bearish engulfing candlestick pattern clearly shows a shift in market control from buyers to sellers. When it appears near resistance levels, supply zones, or liquidity areas, it can signal the beginning of a strong downward move. |
| Easy to Identify | The structure of the pattern is simple and visually obvious on the chart. Even beginner traders can quickly recognize when a large bearish candle fully engulfs the body of the previous bullish candle. |
| Reflects Market Psychology | The pattern clearly illustrates the battle between buyers and sellers. The first candle shows buyer strength, while the second candle shows sellers overpowering the market. This helps traders understand the underlying price action psychology. |
| Works Across Multiple Markets | The bearish engulfing pattern can be applied in forex, stocks, cryptocurrencies, and commodities, making it a versatile tool for technical traders. |
| Works Well With Confluence | When combined with other factors such as support and resistance levels, trend analysis, liquidity sweeps, or chart patterns, the bearish engulfing pattern becomes significantly more reliable. |
| Limitations | Explanation |
| Large Stop Loss in Some Cases | Because the bearish engulfing candle can sometimes be large, traders may need to place their stop loss above a relatively large candle. This can reduce the potential risk-to-reward ratio. |
| Less Reliable on Lower Time Frames | Lower time frames often produce many false signals due to market noise and short-term volatility. Without additional confirmation tools, trading engulfing patterns on very small time frames can lead to unnecessary losses. |
| Can Fail During High Volatility | During major news releases or periods of extreme market volatility, price can move unpredictably. In these situations, even strong candlestick patterns may fail. |
| Not Effective Without Context | The bearish engulfing pattern should not be traded alone. Without considering the trend, key levels, and market structure, the signal may produce low-probability trades. |
Common Mistakes When Trading the Bearish Engulfing Candlestick Pattern
Although the bearish engulfing candlestick pattern is a powerful price action signal, many traders still lose money when using it. This usually happens because the pattern is traded incorrectly or without considering the broader market context.
Understanding the most common mistakes can help traders avoid unnecessary losses and improve the reliability of this setup.
1–Treating the Pattern as a “Holy Grail”
One of the biggest mistakes traders make is assuming that every bearish engulfing candle on the chart is a valid trading signal.
In reality, the bearish engulfing pattern should never be traded in isolation. Taking every engulfing candle without considering the surrounding market structure often leads to low-probability trades.
The pattern becomes much more reliable when it appears near key resistance levels, liquidity areas, or after strong trends.
2-Ignoring Market Context
Another common mistake is ignoring the overall market environment.
A bearish engulfing pattern can have completely different meanings depending on where it appears:
- In an uptrend, it may signal a potential trend reversal.
- In a downtrend, it may indicate a continuation of the existing trend.
- In a range-bound market, it may signal a rejection at resistance.
Failing to consider this context can lead traders to misinterpret the signal and enter trades in the wrong direction.
3-Forgetting Top-Down Analysis
Many traders focus only on their trading time frame and forget to analyze the higher time frames.
Before taking any bearish engulfing setup, traders should always check the higher time frame trend, such as the daily or four-hour chart. If the higher time frame is strongly bullish, a bearish engulfing pattern on a lower time frame may simply represent a temporary pullback rather than a true reversal.
Without proper top-down analysis, traders may unknowingly trade against the dominant trend.
4-Poor Risk and Money Management
Even when the bearish engulfing candlestick pattern appears in the right context, traders should never ignore proper risk management.
A trade should only be taken if it offers a favorable risk-to-reward ratio, typically at least 2:1. If the potential reward does not justify the risk, it is often better to skip the trade.
Over the long run, consistent risk management is what allows traders to remain profitable, even if some setups fail.
Final Thoughts on the Bearish Engulfing Candlestick Pattern
The bearish engulfing candlestick pattern is one of the most powerful reversal signals in price action trading.
When it appears at key levels such as resistance zones, liquidity areas, supply zones, or after a breakout retest, it can provide high-probability trading opportunities.
However, the pattern itself is not enough. The most successful traders always combine the bearish engulfing pattern with market context, including trend analysis, support and resistance levels, liquidity sweeps, and proper risk-to-reward ratios.
To trade this pattern effectively, remember these key principles:
- Always analyze the higher time frame to understand the overall market direction.
- Focus on strong levels such as resistance, supply zones, or liquidity areas.
- Wait for clear confirmation, like a strong bearish engulfing candle.
- Only take trades that offer a minimum 2:1 or 3:1 reward-to-risk ratio.
When used with discipline and proper market analysis, the bearish engulfing candlestick pattern can become a powerful tool in your trading strategy across forex, stocks, commodities, and futures markets.
If you want to deepen your understanding of price action, make sure to also study the bullish engulfing candlestick pattern, which represents the opposite market psychology and can help you identify strong bullish reversals.
Frequently Asked Questions About the Bearish Engulfing Candlestick Pattern
What is a bearish engulfing bar?
A bearish engulfing bar is a two-candlestick reversal pattern where a large bearish candle completely engulfs the body of the previous bullish candle. This pattern signals that sellers have taken control of the market after buyers previously pushed prices higher, which may indicate a potential downward price movement.
Is bearish engulfing good for beginners?
Yes, the bearish engulfing candlestick pattern is considered beginner-friendly because it is easy to recognize on the chart. However, beginners should avoid trading the pattern alone and instead combine it with trend analysis, support and resistance levels, and proper risk management.
Is bearish engulfing good for beginners?
Yes, the bearish engulfing candlestick pattern is considered beginner-friendly because it is easy to recognize on the chart. However, beginners should avoid trading the pattern alone and instead combine it with trend analysis, support and resistance levels, and proper risk management.
Is bearish engulfing a reliable signal?
The bearish engulfing pattern can be a reliable trading signal when it appears in the right context, such as near resistance levels, liquidity zones, or after a strong uptrend. Like any trading setup, its reliability improves when combined with other technical analysis tools and market structure.
What confirms a bearish engulfing pattern?
A bearish engulfing candlestick pattern is confirmed when the second candle completely engulfs the body of the previous bullish candle and closes strongly in the bearish direction. Additional confirmation can come from resistance levels, liquidity sweeps, trend analysis, or other bearish candlestick patterns.










1 thought on “Bearish Engulfing Candlestick Pattern: Strategy & Examples”
Comments are closed.