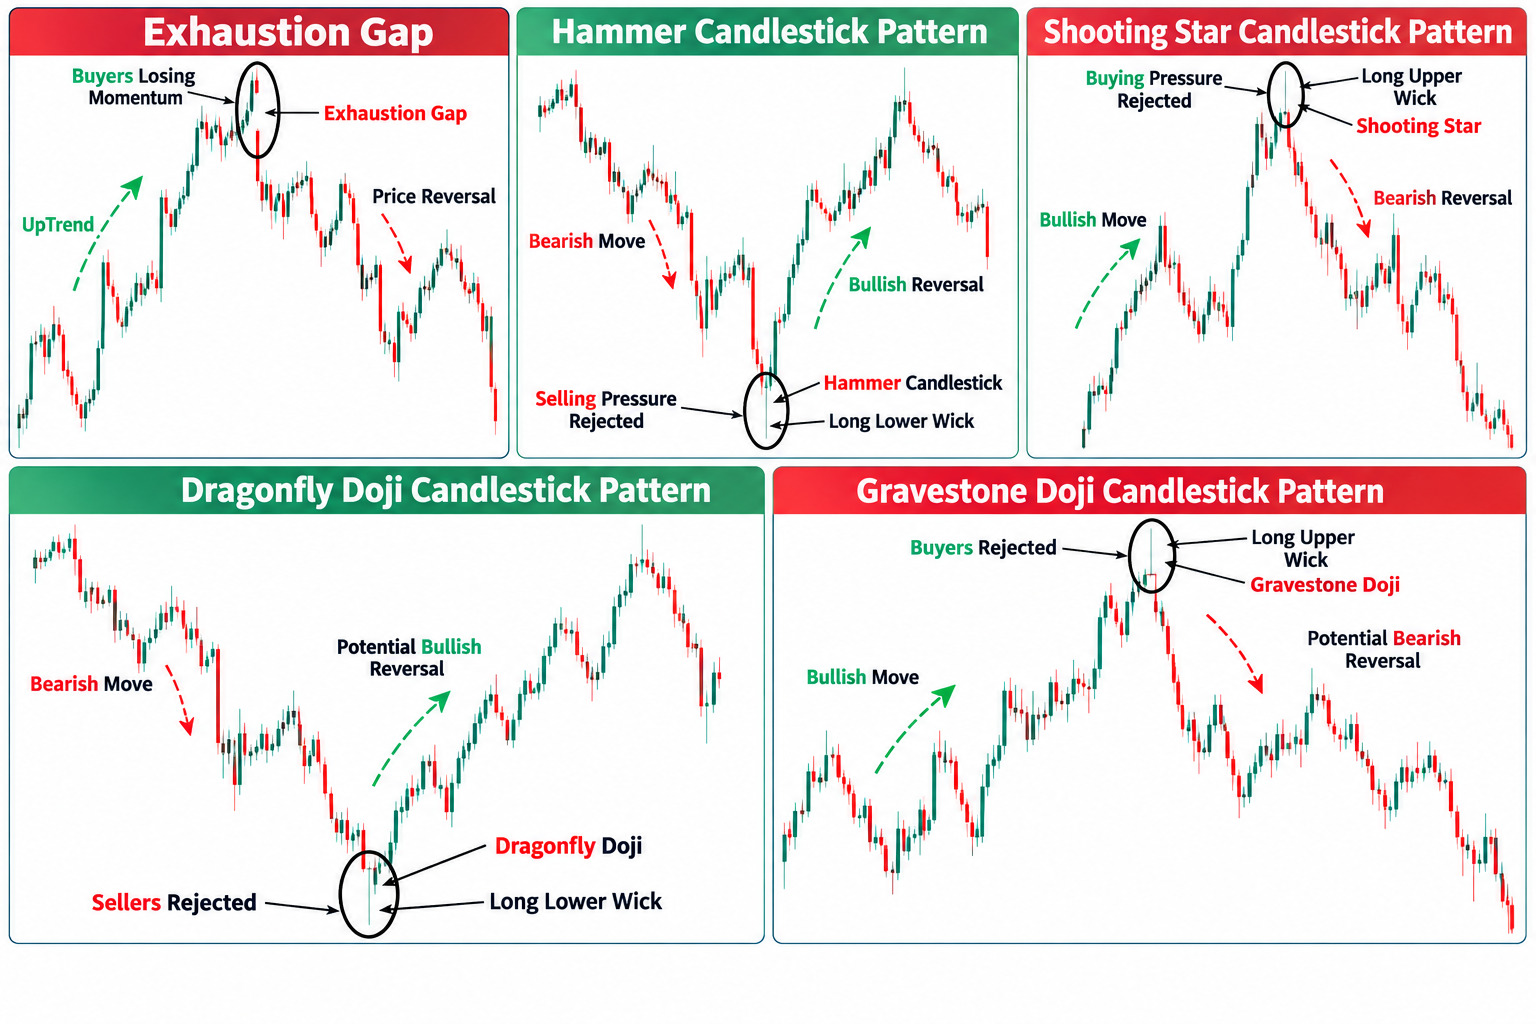
An exhaustion candlestick pattern indicates that buyers or sellers are losing strength and that the market may be approaching a potential reversal.
For example, during an uptrend, buyers continue to push the market higher. However, the market cannot keep rising indefinitely.
As the price moves higher, some buyers may begin to take profits, while buying pressure gradually weakens.
This loss of momentum can sometimes be identified through exhaustion candlestick patterns, which suggest that buyers are no longer fully in control and that sellers may be starting to take over. If selling pressure continues to increase, this can eventually lead to a bearish trend reversal.
The opposite applies during a downtrend. As selling pressure becomes exhausted and buyers begin to take control, exhaustion candlestick patterns may signal a potential bullish reversal.
Exhaustion Candlestick Patterns
When analyzing the market, you will come across different types of candlesticks, and each candlestick tells a story about the battle between buyers and sellers.
Some of the most important candlesticks we will cover in this blog post are exhaustion candlesticks.
These candlesticks typically appear after an extended move upward or downward and signal that the current trend is losing momentum and that a potential reversal may be approaching.
Below, we will explore the most important exhaustion candlestick patterns one by one, explain how to identify them, and discuss what each pattern tells us about the battle between buyers and sellers.
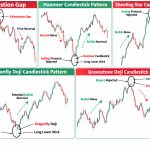
1. Exhaustion Gap
The first exhaustion pattern we will cover is the exhaustion gap. This pattern can occur during periods of strong buying or selling activity, particularly after major events such as important news or earnings releases.
A gap occurs when there is a significant imbalance between buy and sell orders, causing the market to open or trade at a considerably different price from the previous trading range.
On the chart, it looks as if the price has suddenly jumped from one level to another, leaving an empty space between the candles.
An exhaustion gap typically appears near the end of an extended upward or downward move. In an uptrend, for example, the market may make one final aggressive move higher and create a gap.
However, instead of continuing upward, buying pressure begins to weaken, traders start taking profits, and sellers gradually take control.
This can signal that the bullish trend is becoming exhausted and that a bearish reversal may follow.
Look at the chart example below.
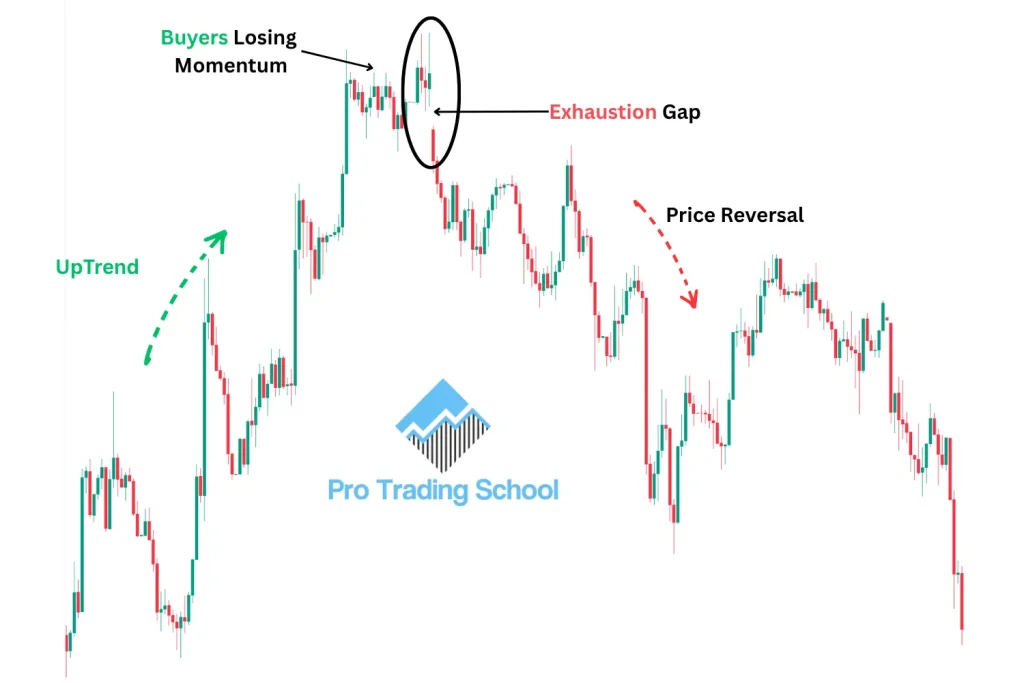
As you can see, the market was trending upward, and buyers were clearly in control. The price continued to make higher highs as buying pressure pushed the market higher.
However, near the end of the move, an exhaustion gap formed. Buyers were unable to maintain the momentum, selling pressure increased, and the market eventually reversed downward.
This shows how an exhaustion gap can warn traders that an established trend is losing strength and that a potential reversal may be approaching.
2. Hammer Candlestick Pattern
The next exhaustion candlestick pattern is the Hammer. This candlestick is a bullish reversal pattern that typically appears after an extended move downward.
When it forms near the end of a downtrend, it indicates that sellers are losing momentum and that buyers are beginning to step in and push the price higher.
The Hammer is characterized by a small real body and a long lower wick. The long lower wick shows that sellers initially pushed the price significantly lower, but buyers entered the market and managed to drive the price back up before the candle closed. This rejection of lower prices can be an early sign of seller exhaustion.
Look at the chart example below.
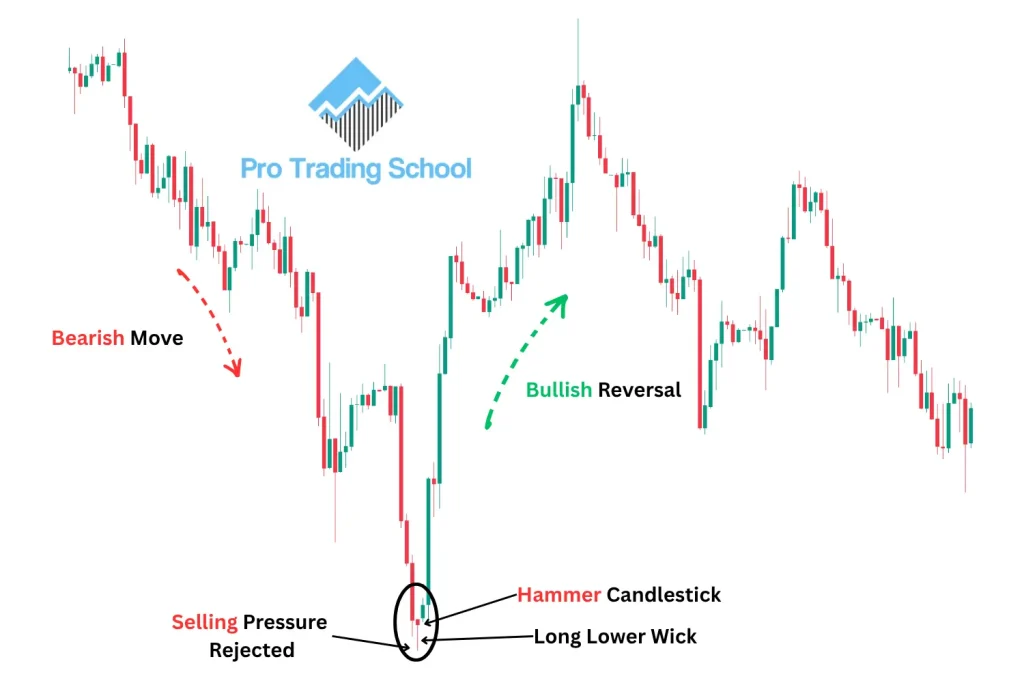
As you can see, the market was trending downward, and sellers were clearly in control. Then, a Hammer candlestick formed near the bottom of the move, signaling that selling pressure was weakening and buyers were beginning to take control.
After the Hammer formed, the market reversed and moved higher, confirming the potential bullish reversal signaled by the pattern.
If you want to learn more about this pattern, including how it works, how to identify it, and how to trade it, check out our complete guide on the Hammer Candlestick Pattern: Meaning, Trading Strategy & Examples.
3. Shooting Star Candlestick Pattern
The opposite version of the Hammer exhaustion candle is the Shooting Star. The Shooting Star is a bearish reversal candlestick characterized by a small real body and a long upper wick.
It represents the battle between buyers and sellers and shows how sellers managed to regain control by the end of the session.
When this pattern occurs after an extended uptrend, it indicates that buyers may be losing momentum and that sellers are beginning to step in.
The long upper wick shows that buyers initially pushed the price significantly higher, but sellers rejected those higher prices and pushed the market back down before the candle closed. This can be an early sign of buyer exhaustion and a potential bearish reversal.
Look at the chart example below.
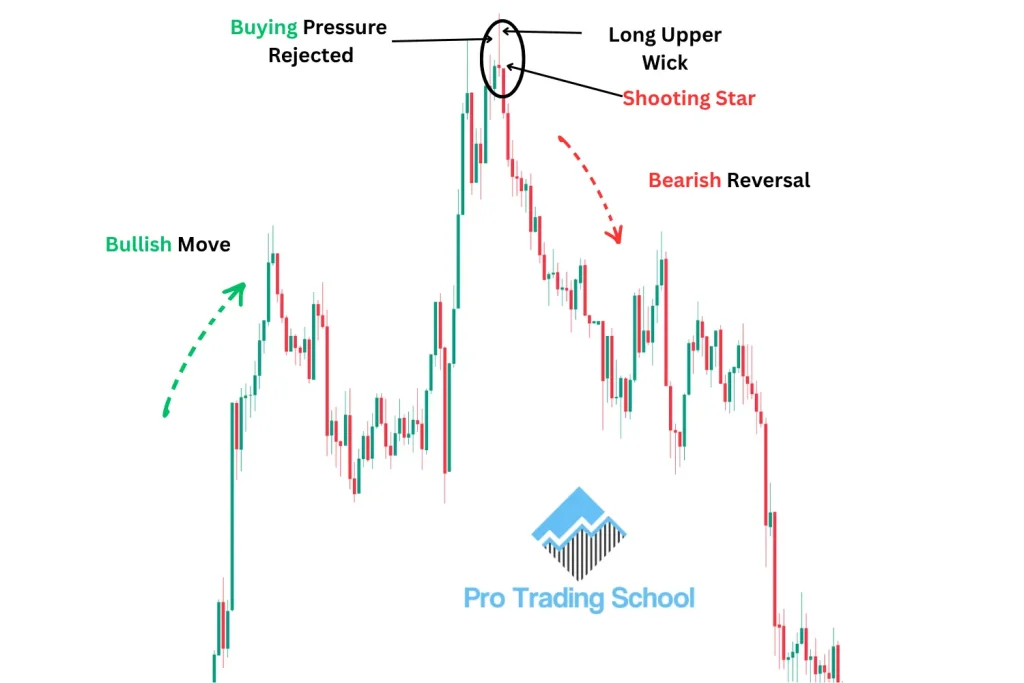
As you can see, the market was clearly trending upward, and buyers were dominating the market.
However, the formation of the Shooting Star changed the situation. Buyers attempted to push the market higher but failed, allowing sellers to take control.
After the Shooting Star formed, the market reversed and moved downward, confirming the potential bearish reversal signaled by the pattern.
If you want to learn more about this bearish reversal pattern and discover how to trade it effectively, check out our complete guide to the Shooting Star Candlestick Pattern.
4. Dragonfly Doji Candlestick Pattern
The Dragonfly Doji is another exhaustion candlestick pattern. It has a distinctive T-shape, with a long lower wick and the open, close, and high located at or near the same level.
This candlestick represents the battle between buyers and sellers. At first, sellers were in control and pushed the market significantly lower.
However, buyers reacted strongly, rejected the lower prices, and pushed the market all the way back up near the opening price before the session ended.
When a Dragonfly Doji appears after an extended downtrend, it can indicate that sellers are becoming exhausted and buyers are beginning to fight back.
This rejection of lower prices suggests that selling pressure is weakening and that a potential bullish reversal may be approaching.
Look at the chart example below.
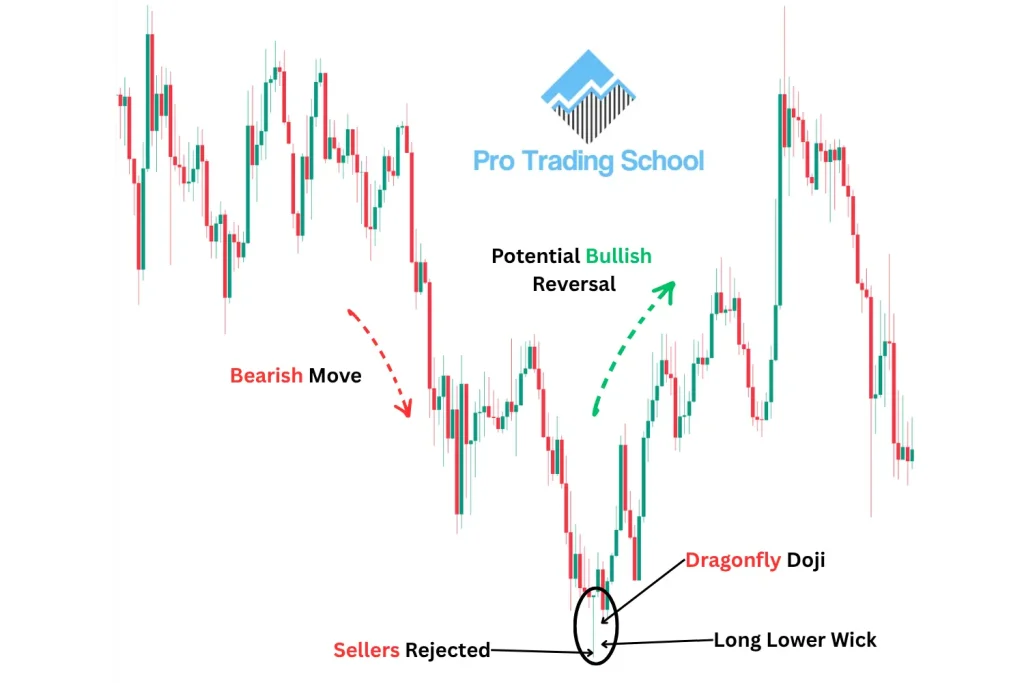
As you can see, the market was trending downward, with sellers dominating and continuously pushing prices lower.
However, when the Dragonfly Doji appeared, it signaled seller exhaustion and showed that buyers were willing to defend lower prices.
After the pattern formed, buyers took control and pushed the market higher, resulting in a bullish reversal.
Want to explore this pattern in more detail? Check out our complete guide to the Dragonfly Doji Candlestick Pattern, where we cover four powerful trading strategies and practical examples.
5. Gravestone Doji Candlestick Pattern
The Gravestone Doji is the opposite version of the Dragonfly Doji and can signal a potential market reversal from bullish to bearish.
It is characterized by a long upper wick, with the open, close, and low located at or near the same level.
This pattern shows that buyers initially pushed the price significantly higher. However, sellers stepped in, rejected the higher prices, and pushed the market back down near the opening price before the session closed.
This strong rejection can be a sign that buyers are becoming exhausted and sellers are beginning to gain control.
Look at the chart example below.
As you can see, the market was trending upward, with buyers showing strength and continuously pushing prices higher. Then, a Gravestone Doji candlestick appeared near the top of the move.
The formation of this exhaustion candlestick indicated that buying pressure was weakening and that sellers were beginning to take control.
As a result, the market reversed and moved downward, confirming the potential bearish reversal signaled by the Gravestone Doji.
Want to learn more about this bearish reversal pattern? Check out our complete guide to the Gravestone Doji Candlestick Pattern, where we cover four proven ways to identify and trade potential bearish reversals.
Exhaustion Candlestick Pattern Strategies
Now that you have a better understanding of what an exhaustion candlestick is and have seen some of the most common exhaustion candlestick patterns, there is one important thing you need to remember: these patterns are not a holy grail.
This means that you should not trade an exhaustion candlestick simply because it appears on your chart.
Exhaustion alone is not always enough to confirm a reversal, as what looks like exhaustion could simply be a temporary pause or profit-taking before the market continues in the same direction.
For this reason, we need to combine exhaustion candlestick patterns with other technical analysis tools to confirm their signals and increase the probability of a successful trade.
In this section, we will cover three trading strategies that combine exhaustion candlestick patterns with important areas on the chart.
1. Hammer Exhaustion Candle at a Demand Zone Strategy
The first strategy consists of identifying a demand zone and waiting for a Hammer candlestick to form when the market returns to that zone.
Look at the chart example below.
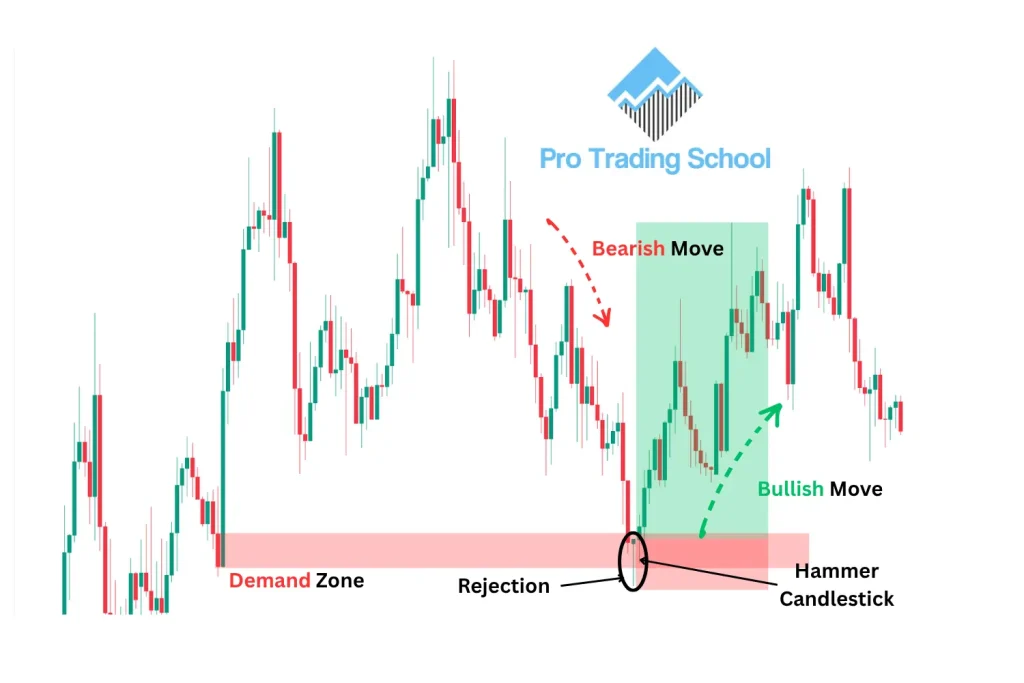
As you can see, the market made a strong move upward from a specific price area. This strong reaction suggests that there was significant buying pressure in the area, making it an interesting zone to watch if the market returns to it.
We can mark the area from which the strong bullish move originated as a demand zone. Instead of immediately buying when the price returns to the zone, we wait for additional confirmation.
This is where the Hammer exhaustion candle becomes useful.
As you can see, once the market retraced back to the demand zone, a Hammer candlestick formed.
The long lower wick shows a strong rejection of lower prices and suggests that selling pressure is becoming exhausted while buyers are stepping back into the market.
The combination of the demand zone and Hammer candlestick gives us stronger confirmation than using either signal alone.
To trade this setup, you can place your entry at the close of the Hammer, your stop loss below the pattern or demand zone, and your profit target at the next important price level.
As you can see in this example, the market moved higher after the Hammer formed and eventually reached the target as expected.
2. Shooting Star at a Supply Zone Strategy
The next strategy consists of combining the Shooting Star exhaustion candlestick with a supply zone.
A supply zone is an area where strong selling pressure previously entered the market and caused a significant move downward.
When the market returns to this area, we can watch for signs that buyers are losing momentum and sellers are beginning to regain control.
This is where an exhaustion candlestick such as the Shooting Star can provide useful confirmation.
Look at the chart example below.
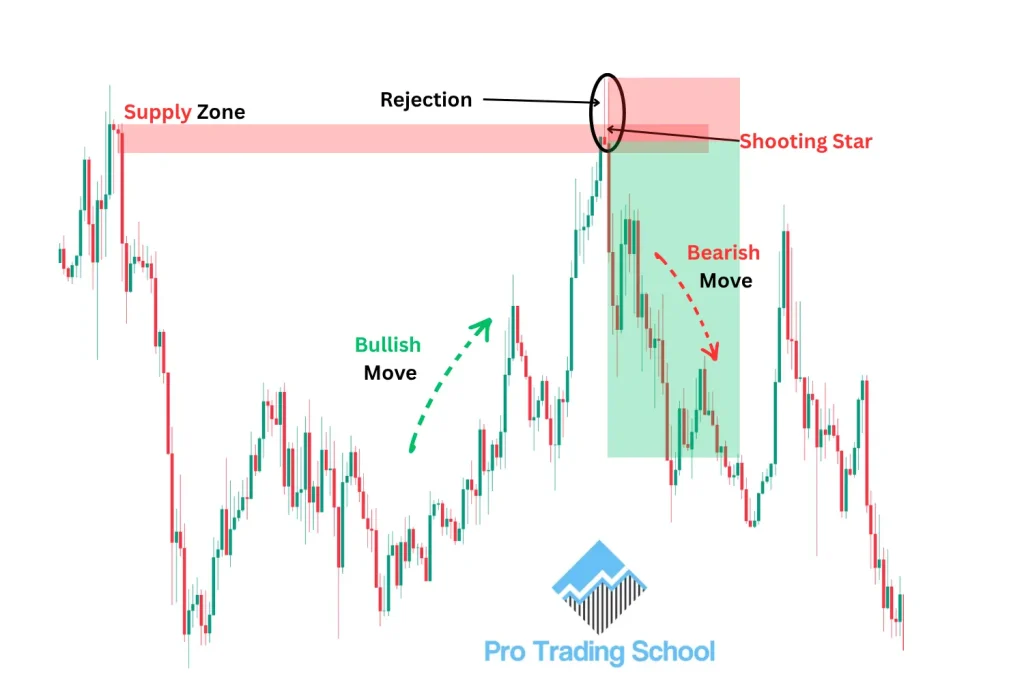
As you can see, the market made a strong move downward from a specific price area. We can identify this area as a potential supply zone and wait for the market to retrace back to it.
Once the price returned to the supply zone, a clear Shooting Star formed. The long upper wick shows that buyers attempted to push the market higher but were strongly rejected by sellers. This indicates potential buyer exhaustion and suggests that another bearish move could follow.
To trade this setup, you can place your entry at the close of the Shooting Star, your stop loss above the pattern or supply zone, and your profit target at the next important price level.
As you can see, the market reversed from the supply zone and moved downward as expected.
3. Dragonfly Doji at a Demand Zone Strategy
The final strategy combines the Dragonfly Doji exhaustion candlestick with a demand zone.
Look at the chart example below.
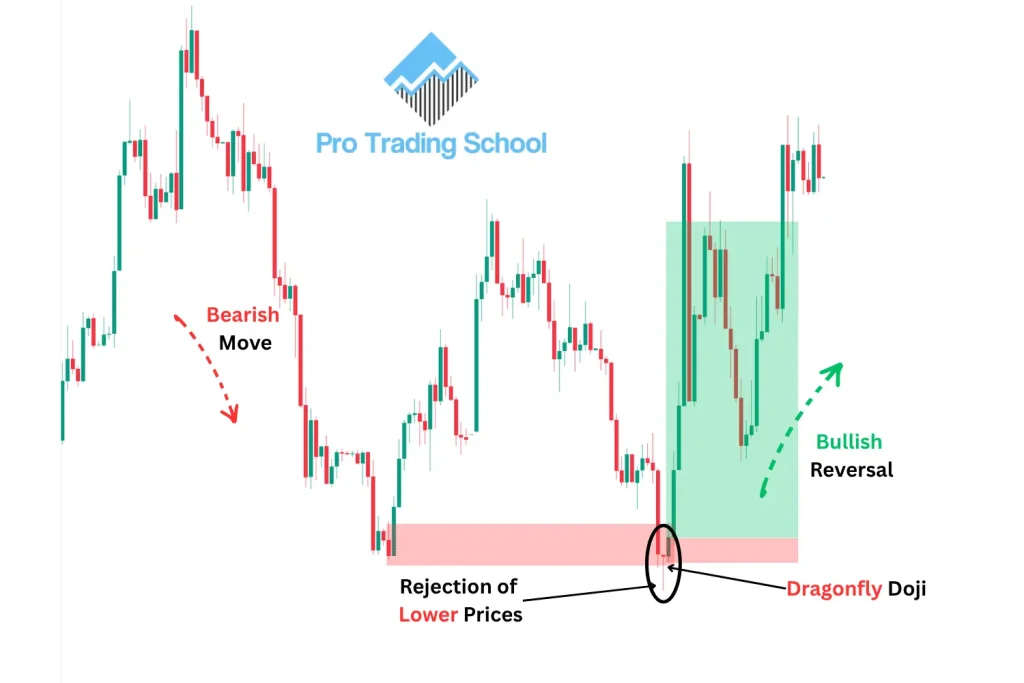
As you can see, we have a clear demand zone created before a strong bullish move. We mark this area and wait for the market to retrace back to it rather than entering immediately.
Once the market returned to the demand zone, a Dragonfly Doji formed. The long lower wick shows that sellers initially pushed the price lower, but buyers reacted strongly and pushed the price back up before the candle closed.
This rejection of lower prices indicates potential seller exhaustion. Because the pattern also formed at an important demand zone, we have additional confirmation that buyers may be preparing to take control.
As a trader, you can wait for the Dragonfly Doji to form and then place your entry at the close of the candle, your stop loss below the pattern or demand zone, and your profit target at the next important price level.
As you can see in this example, buyers took control after the pattern formed, and the market moved upward toward the target.
Important Note
Exhaustion candlestick patterns are not a holy grail, and neither are the strategies discussed above. Sometimes these setups will work, and sometimes they will fail.
Their effectiveness can depend on many factors, including the market environment, overall trend, volatility, market cycle, and the location where the pattern forms.
For this reason, you should always protect your trades with a stop-loss order and follow proper risk and money management.
The goal is not to win every trade, but to manage your risk consistently so that losing trades do not significantly damage your trading account over the long run.
Conclusion
Exhaustion candlestick patterns can help traders identify when the current trend is losing momentum and a potential reversal may be approaching.
Patterns such as the Hammer, Shooting Star, Dragonfly Doji, and Gravestone Doji can reveal important changes in the balance between buyers and sellers.
However, these patterns should not be traded in isolation. Their signals become more meaningful when they appear at important areas such as support and resistance levels, supply and demand zones, or after an extended market move.
The key is to wait for the right market context, look for confirmation, and always manage your risk properly.
Remember that no candlestick pattern guarantees a reversal, but when used correctly, exhaustion patterns can become a valuable addition to your trading strategy.