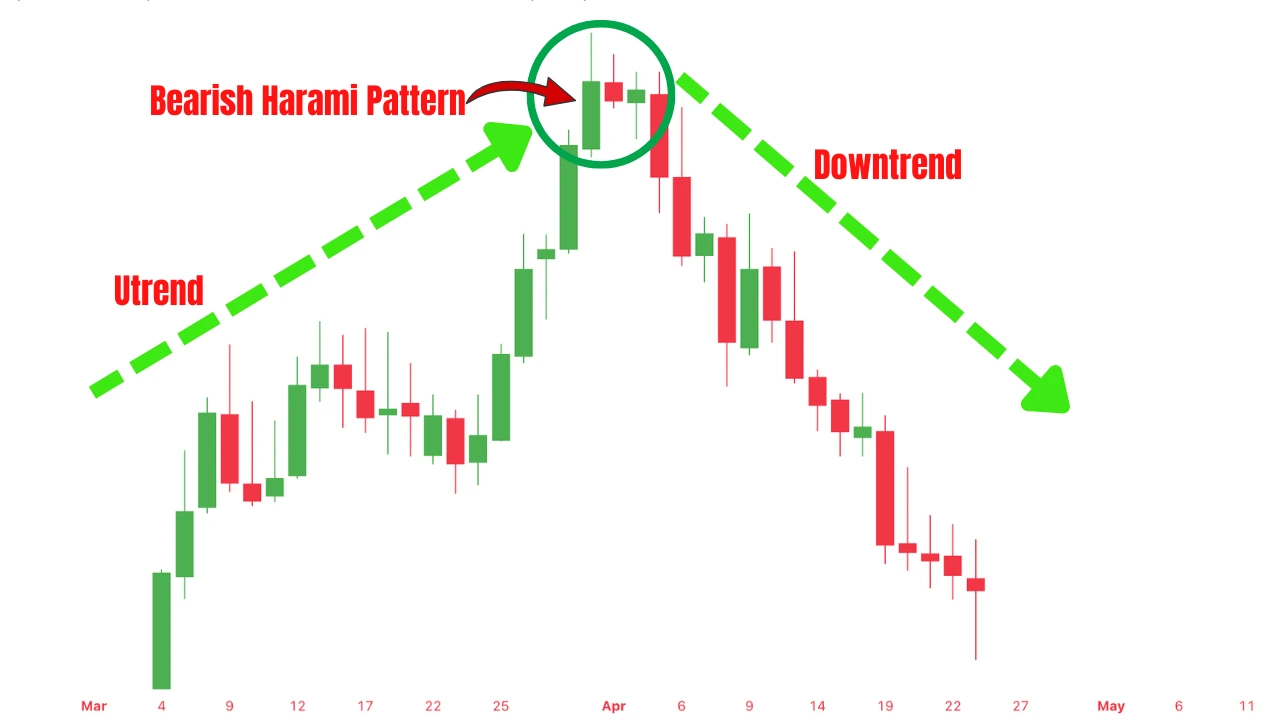
The Bearish Harami candlestick pattern is a two-candle formation that signals a potential trend reversal when it appears at the end of an uptrend.
It can also act as a bearish continuation pattern when it forms during an existing downtrend, suggesting that sellers may be preparing to push prices lower after a brief pause.
Bearish Harami Candlestick Pattern Example
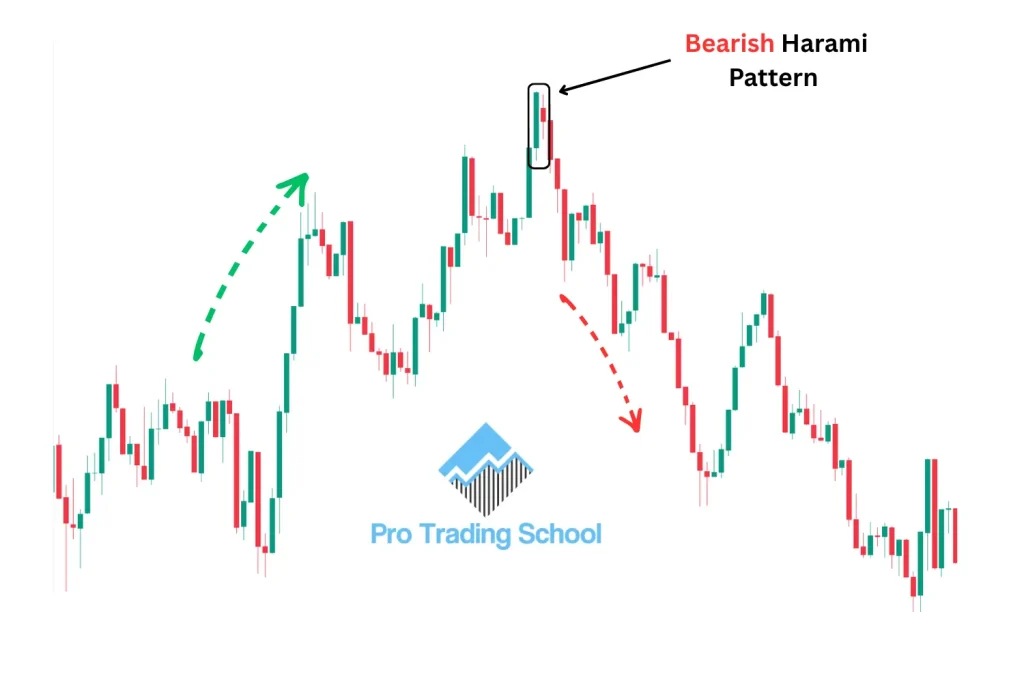
The chart above shows a clear Bearish Harami candlestick pattern forming at the end of an established uptrend.
As you can see, the first candle is a large bullish candle, indicating that buyers are still firmly in control of the market.
The second candle is a smaller bearish candle that forms completely within the body of the first candle, signaling that bullish momentum is weakening and the market is entering a period of indecision.
When the Bearish Harami candlestick pattern appears after a prolonged uptrend, it often suggests that buyers are losing control while sellers are beginning to gain strength.
Although the pattern does not guarantee a reversal, it warns that the uptrend may be coming to an end and that a new downtrend could be about to begin.
Want to learn more candlestick patterns? Check out our 33 Candlestick Patterns Cheat Sheet (Simple Visual Guide) to discover the most important bullish and bearish reversal and continuation patterns every trader should know.
What Does the Bearish Harami Candlestick Pattern Mean?
When the Bearish Harami candlestick pattern forms, it signals that buyers are losing momentum and that the market is entering a period of indecision or consolidation.
While the pattern does not confirm a reversal on its own, it warns that bullish pressure is weakening and that sellers may soon take control.
Look at the chart example below:
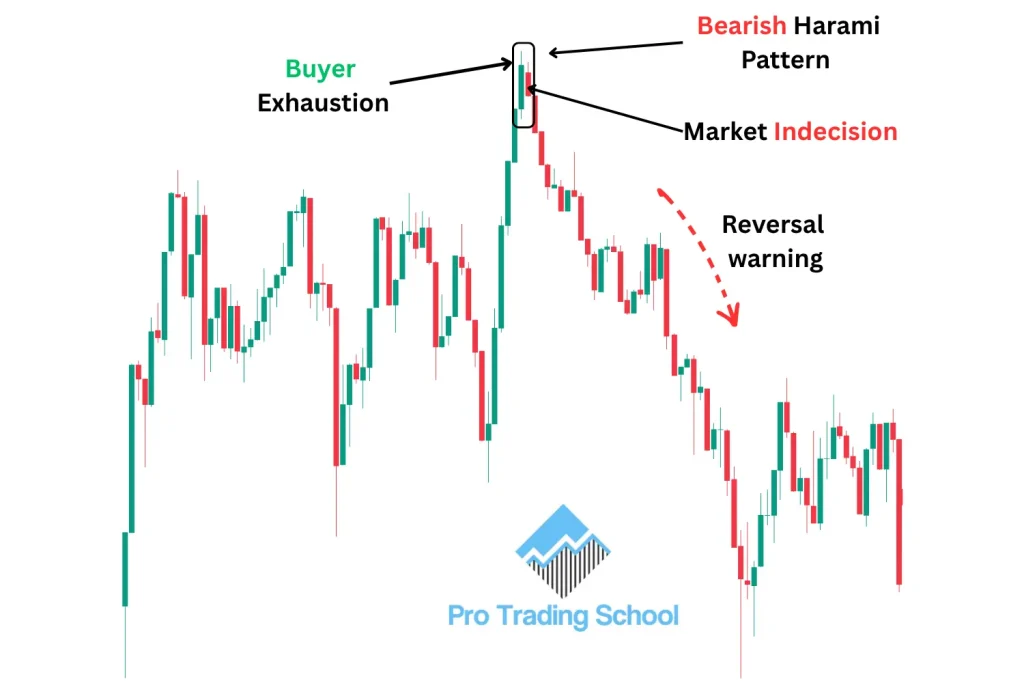
As you can see, the market was in a strong uptrend, showing that buyers were firmly in control. Then, a Bearish Harami candlestick pattern formed.
The large bullish candle reflects strong buying pressure, while the smaller bearish candle contained within the first candle’s body shows that buyers are struggling to continue pushing prices higher.This loss of momentum often causes traders to question whether the uptrend can continue.
As confidence among buyers begins to fade, many start taking profits, reducing buying pressure. At the same time, sellers become more active, creating a pullback.
If selling pressure continues to increase after the pattern forms, the pullback can develop into a full trend reversal, shifting the market from an uptrend to a downtrend.
Important: A Bearish Harami is an early warning signal, not a confirmation of a reversal. Traders should wait for additional confirmation, such as a bearish confirmation candlestick, a break below support, or increased selling volume, before entering a short trade.
How to Identify a Bearish Harami Candlestick Pattern
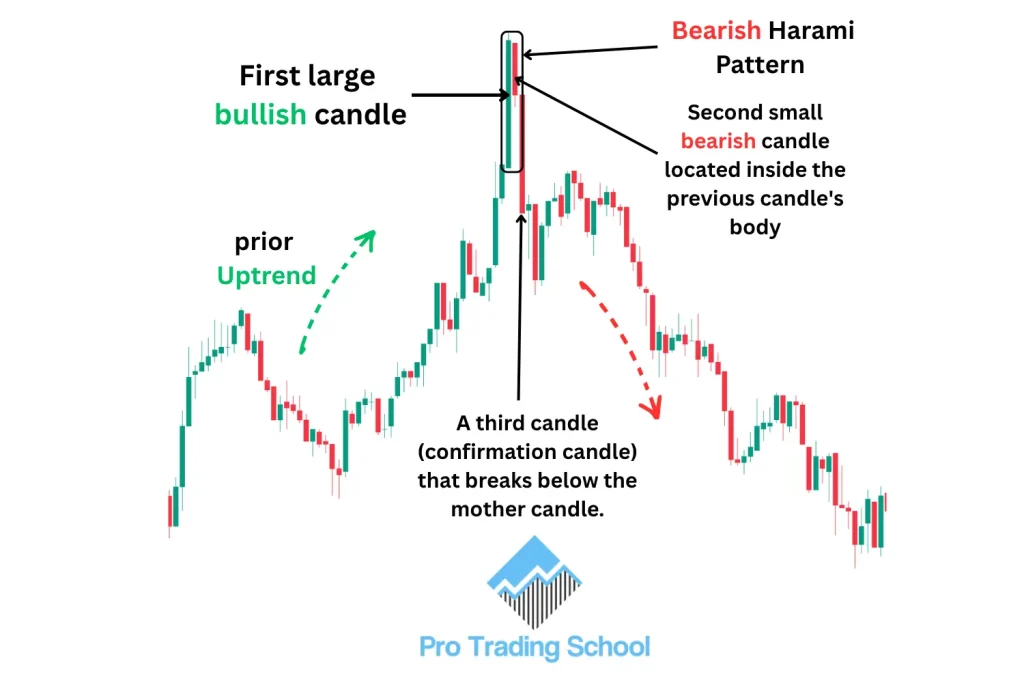
The Bearish Harami candlestick pattern appears frequently across all financial markets. However, not every Bearish Harami is worth trading.
To identify high-probability setups, you should evaluate the pattern using the following five criteria:
1. A Prior Uptrend
A valid Bearish Harami candlestick pattern should form after a clear and sustained uptrend. This shows that buyers have been in control before the pattern appears.
If the market is moving sideways or ranging, the pattern is still technically a Bearish Harami, but it is generally considered less reliable because there is no established bullish trend to reverse.
2. A Strong Bullish First Candle
The first candle should be a large bullish candle, often called the mother candle. It reflects strong buying pressure and confirms that buyers are still dominating the market before the potential reversal begins.
3. A Smaller Bearish Second Candle
The second candle should be bearish and significantly smaller than the first candle. This indicates that buying momentum is weakening and that sellers are beginning to challenge the prevailing uptrend.
4. The Second Candle Forms Inside the First Candle
The body of the second candle must be completely contained within the real body of the first candle. This “inside candle” structure is what defines the Bearish Harami pattern.
It signals indecision, showing that neither buyers nor sellers have full control and that the market is temporarily pausing after a strong bullish move.
5. A Bearish Confirmation Candle
The third candle should be a strong bearish candle that closes below the low of the mother candle (or at least below the low of the Bearish Harami pattern).
This confirmation is important because it shows that sellers have taken control and increases the probability of a bearish reversal.
Tip: Never trade a Bearish Harami based on the two-candle pattern alone. Waiting for a bearish confirmation candle can help filter out false signals and improve the quality of your trading setups.
Bullish Harami at the Bottom vs. Bearish Harami at the Top
The Bullish Harami and Bearish Harami are opposite candlestick patterns that signal a potential change in market direction.
The chart below compares the Bullish Harami and Bearish Harami candlestick patterns, highlighting their key differences.
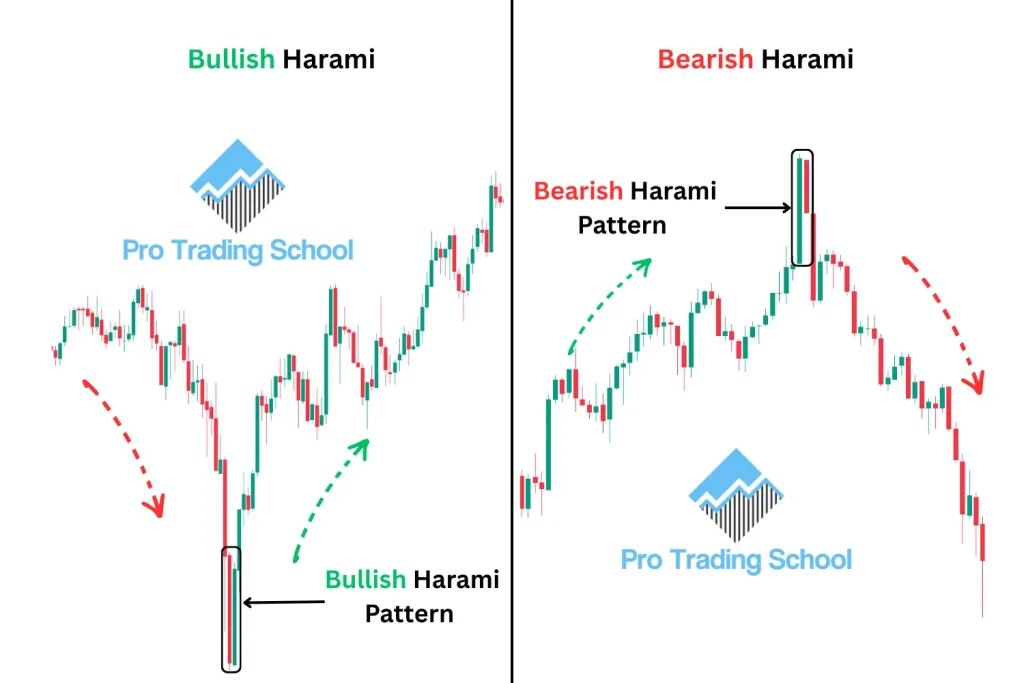
Although they share the same two-candle structure, they appear in different market conditions and have opposite trading implications.
The table below highlights the key differences between the Bullish Harami and Bearish Harami candlestick patterns.
| Feature | Bullish Harami | Bearish Harami |
|---|---|---|
| Market Trend | Forms after a downtrend | Forms after an uptrend |
| Signal | Potential bullish reversal | Potential bearish reversal |
| First Candle | Large bearish candle | Large bullish candle |
| Second Candle | Small bullish candle inside the first candle | Small bearish candle inside the first candle |
| Market Psychology | Sellers are losing momentum while buyers begin to step in. | Buyers are losing momentum while sellers begin to take control. |
| Confirmation | A bullish candle closing above the pattern | A bearish candle closing below the pattern |
| Trading Bias | Look for buying opportunities | Look for selling opportunities |
Although both patterns indicate a possible trend reversal, confirmation is essential before entering a trade.
Professional traders typically wait for a strong confirmation candle, a break of a key support or resistance level, or additional confluence from technical indicators before making a trading decision.
Remember: A Bullish Harami is most effective when it forms near a major support level or demand zone, while a Bearish Harami tends to produce stronger signals when it appears near a key resistance level or supply zone. This additional confluence can significantly improve the probability of a successful trade.
If you’re interested in the bullish counterpart of this pattern, read our Bullish Harami Candlestick Pattern: Trading Strategies guide to learn how to identify and trade bullish reversal setups.
Bearish Harami Cross Candlestick Pattern
The Bearish Harami Cross candlestick pattern is a variation of the Bearish Harami that signals a potential bearish trend reversal.
It consists of a large bullish mother candle followed by a Doji whose body is completely contained within the body of the first candle.
Unlike a standard Bearish Harami, the second candle is a Doji, which represents strong market indecision.
This shows that after a strong bullish move, buyers are no longer able to maintain upward momentum, while sellers are beginning to challenge their control.
When the Bearish Harami Cross appears at the top of an established uptrend, it warns that the bullish trend may be losing strength and that a bearish reversal could be developing.
Bearish Harami Cross Example
Look at the chart example below:
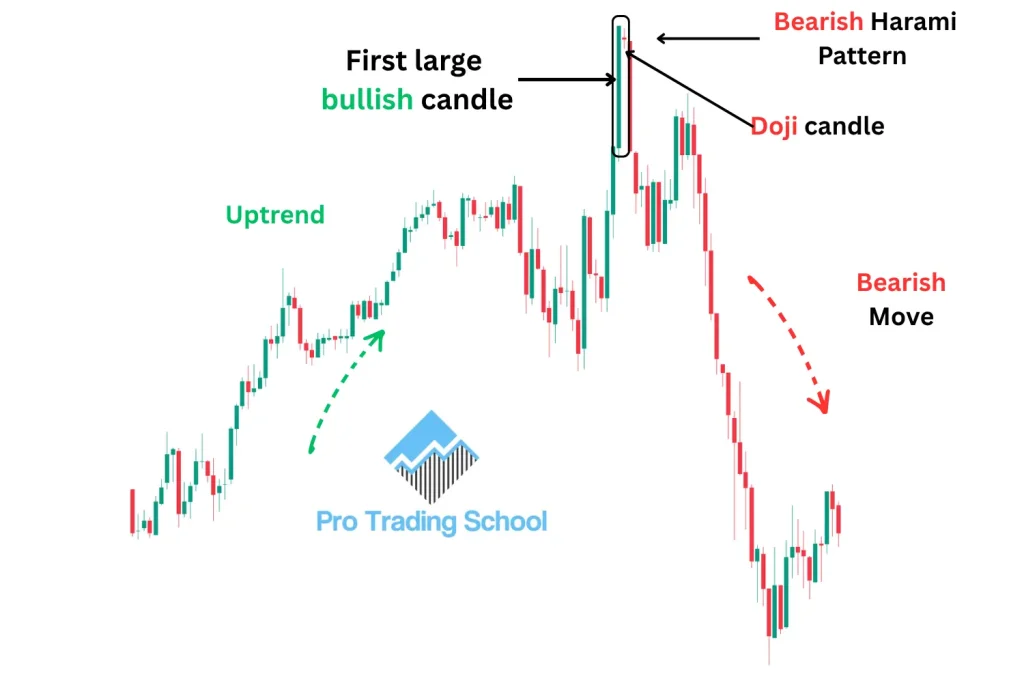
The market is in a strong uptrend, confirming that buyers are firmly in control. After this advance, a Bearish Harami Cross candlestick pattern forms.
The large bullish mother candle reflects strong buying pressure, while the Doji inside the mother candle signals that the market has entered a period of indecision. Neither buyers nor sellers are able to gain control, indicating that bullish momentum is fading.
This shift in momentum often causes bullish traders to take profits, while encouraging sellers to enter the market.
The bearish reversal is confirmed when the third candle closes below the low of the mother candle, demonstrating that sellers have taken control. Once this confirmation occurs, the probability of a downward move increases significantly.
Trading Tip: Never enter a short trade based solely on the Bearish Harami Cross. Wait for a bearish confirmation candle and, ideally, combine the pattern with a resistance level, supply zone, trendline, or overbought indicator to improve the probability of a successful trade.
Bearish Harami vs. Bearish Engulfing
The Bearish Harami and Bearish Engulfing are two popular bearish reversal candlestick patterns that appear after an uptrend.
The chart below compares the Bearish Harami and Bearish Engulfing candlestick patterns, highlighting their key differences in structure and reversal signals.
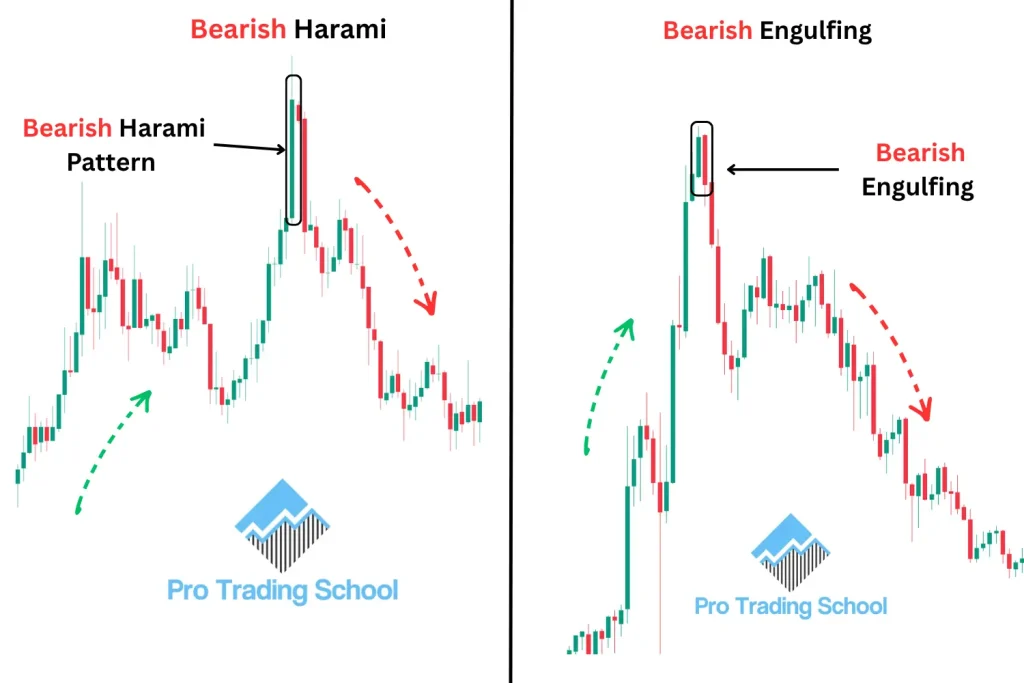
Although both suggest that buyers are losing control and a downward reversal may be approaching, they differ significantly in their structure, strength, and reliability.
The Bearish Harami consists of a large bullish candle followed by a smaller bearish candle that forms completely inside the body of the first candle.
This pattern signals that bullish momentum is slowing and the market is entering a period of indecision.
Since it represents hesitation rather than aggressive selling, traders usually wait for a bearish confirmation candle before entering a trade.
In contrast, the Bearish Engulfing pattern is a stronger reversal signal. It forms when a large bearish candle completely engulfs the body of the previous bullish candle.
This aggressive move shows that sellers have overwhelmed buyers in a single session, making the pattern generally more reliable than a Bearish Harami.
The table below compares the key differences between the Bearish Harami and Bearish Engulfing candlestick patterns.
| Feature | Bearish Harami | Bearish Engulfing |
|---|---|---|
| Signal Strength | Moderate | Strong |
| Market Psychology | Buyers are losing momentum | Sellers have taken control aggressively |
| First Candle | Large bullish candle | Small bullish candle |
| Second Candle | Small bearish candle inside the first candle | Large bearish candle that completely engulfs the previous candle |
| Confirmation Needed | Yes, strongly recommended | Recommended, but the pattern is stronger on its own |
| Best Location | At resistance after an uptrend | At resistance after an uptrend |
| Trading Bias | Potential bearish reversal | Stronger bearish reversal |
While both patterns can provide profitable trading opportunities, the Bearish Harami is better viewed as an early warning signal, whereas the Bearish Engulfing offers stronger evidence that sellers have taken control.
In both cases, the highest-probability setups occur when the pattern forms near a key resistance level, supply zone, or trendline, and is confirmed by increased selling pressure or a bearish confirmation candle.
If you’d like to see how the Bearish Engulfing pattern forms in real market conditions, explore our 12 Bearish Engulfing Pattern Examples guide featuring annotated trading charts and practical examples.
Conclusion
The Bearish Harami candlestick pattern is a reliable early warning signal that buyers are losing momentum and a bearish reversal may be developing.
While it can be a valuable trading tool, it is most effective when combined with key resistance levels, technical confluence, and a bearish confirmation candle.
With proper risk management, the Bearish Harami can help traders identify high-probability selling opportunities.
Frequently Asked Questions
Is the Bearish Harami candlestick pattern reliable?
Yes, the Bearish Harami candlestick pattern can be reliable when it forms after a strong uptrend and is confirmed by a bearish candlestick.
Its accuracy improves significantly when it appears near a resistance level, supply zone, or trendline.
What confirms a Bearish Harami pattern?
The best confirmation is a strong bearish candle that closes below the low of the pattern (or the mother candle). Many traders also look for increased selling volume or additional technical confluence before entering a short trade
Can the Bearish Harami pattern fail?
Yes. Like all candlestick patterns, the Bearish Harami can produce false signals, especially in sideways markets or strong bullish trends. This is why confirmation and proper risk management are essential.
What is the best strategy for trading a Bearish Harami?
One of the most effective strategies is to trade the Bearish Harami at a key resistance level or supply zone, wait for a bearish confirmation candle, place a stop-loss above the pattern’s high, and target the next support level or use a favorable risk-to-reward ratio.










You are genius sir