
A bullish engulfing candlestick pattern is a two-candle price formation that signals strong buying pressure in the market.
The pattern forms when a small bearish candle is followed by a larger bullish candle, and the body of the second candle completely engulfs the body of the first candle.
This pattern can act as a continuation signal when it appears during an uptrend, or as a reversal signal when it forms at the end of a downtrend, indicating that buyers may be taking control of the market.


In simple terms, the bullish engulfing pattern shows that buyers have completely overwhelmed sellers within two candles.
Table of Contents
Key Takeaways
- The bullish engulfing pattern is a two-candle formation that signals a shift from sellers to buyers.
- It becomes more reliable when it forms in the right market context, such as:
- after a pullback in an uptrend
- at a key support level
- after a liquidity sweep
- after a pullback in an uptrend
- The pattern can be used in different strategies, including:
- trend-following setups
- moving average strategies
- trend line trading
- range-bound markets
- reversal setups against the trend
- trend-following setups
- A bullish engulfing candle alone is not enough — it should always be combined with:
- market structure
- key levels
- confirmation signals
- market structure
- The pattern works best in trending markets and performs poorly in choppy or sideways conditions.
- Proper risk management is essential, as not every setup will lead to a winning trade.
- The bullish engulfing pattern is not a signal to blindly follow, but a tool to help you understand when buyers are taking control of the market.
Bullish Engulfing Candlestick Pattern Anatomy
The bullish engulfing candlestick pattern consists of two candles that appear consecutively on the chart. Each candle reveals important information about the battle between buyers and sellers.
To correctly identify this pattern, traders must understand the following characteristics:

1. Two Candles in Total
The bullish engulfing pattern always consists of two consecutive candles.
2. The First Candle Is Bearish
The first candle is a bearish candle, meaning the closing price is below the opening price, showing that sellers were in control during that period.
- On green and red charts, the first candle is typically red.
- On black and white charts, the first candle appears as a black candle, usually with a relatively small body.
3. The Second Candle Is Bullish
The second candle is a bullish candle, meaning the closing price is above the opening price, indicating strong buying pressure.
- On green and red charts, the second candle is green and usually larger, showing strong bullish momentum.
- On black and white charts, the second candle appears as a white candle.
4. The Second Candle Engulfs the First Candle’s Body
The most important characteristic of the pattern is that the real body of the second candle completely engulfs the real body of the first candle.
If the second candle does not fully cover the body of the first candle, the formation cannot be considered a true engulfing candlestick pattern.
5. The Real Body Is More Important Than the Wicks
When analyzing this pattern, traders focus mainly on the real bodies of the candles rather than the wicks (or shadows).
The wicks may vary in size, but the key condition is that the second candle’s body fully covers the first candle’s body.
Understanding the structure of a bullish engulfing pattern is only the first step. To trade it effectively, you also need to know how to confirm a bullish engulfing candle and avoid weak or misleading signals.
The Psychology Behind the Bullish Engulfing Pattern
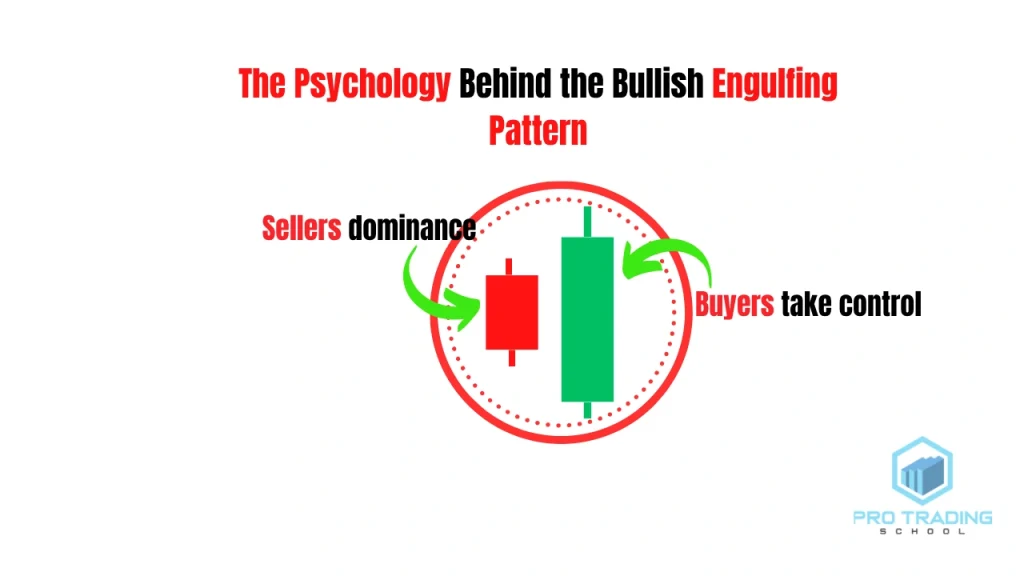
The bullish engulfing candlestick pattern represents a clear battle between sellers and buyers.
The first candle shows sellers in control during a specific period of time, pushing the market lower. However, the second candle shows buyers taking control, completely overpowering the previous selling pressure.
This shift in momentum often signals that buyers are becoming stronger than sellers, which can lead to a continuation of the trend or even a market reversal.
Example 1: Bullish Engulfing Pattern in an Uptrend
Look at this chart example.

In this situation, the market is already trending upward, which means buyers are generally in control.
However, during one trading period, a small bearish candle appears, suggesting that sellers attempted to push the market lower.
The next candle forms a strong bullish engulfing candle, completely covering the previous candle’s body. This shows that buyers quickly regained control and absorbed the selling pressure.
This situation confirms that buyers remain dominant, and the market is likely to continue moving upward.
Example 2: Bullish Engulfing Pattern at the End of a Downtrend
Now look at another chart example.

In this case, the market is trending downward, meaning sellers are dominating the market.
As price reaches a key support level, a bullish engulfing pattern appears.
The first small bearish candle confirms that sellers are still in control, continuing the downward movement.
However, the second bullish candle shows that buyers suddenly stepped in and pushed the market higher, completely engulfing the previous candle.
This strong buying reaction suggests that buyers are taking control of the market, and the downtrend may be ending.
When the bullish engulfing pattern forms near a key support level, it often indicates that:
- Sellers are taking profits
- New buyers are entering the market
This combination can trigger a potential upward move in price.
To fully understand this pattern, it’s important to know the difference between bullish and bearish engulfing patterns.
Bullish Engulfing Candlestick Pattern Example
The Bitcoin–US Dollar daily chart provides a clear example of how the bullish engulfing candlestick pattern can signal a potential shift in market momentum.

In this example, the market had been trending downward for several weeks, showing strong selling pressure. Eventually, price reached a key support level, where buyers initially stepped in and pushed the market higher. After this reaction, the market pulled back again toward the same support area.
When price returned to this level a second time, a clear bullish engulfing candlestick pattern formed.
This pattern indicated that sellers attempted to break below the support level but failed. The strong bullish candle that followed completely engulfed the previous bearish candle, showing that buyers had regained control of the market.
From a price-action perspective, this suggests that the battle between buyers and sellers ended with buyers gaining dominance, increasing the probability of a bullish move.

After the formation of this bullish engulfing pattern, the market began a strong upward movement. Bitcoin rose from approximately $86,000 on April 9, 2025, and continued climbing until it reached around $122,000 on October 6, 2025, marking a significant bullish rally.
By carefully observing the chart and identifying the bullish engulfing pattern near a key support level, traders can better understand what is happening in the market and anticipate potential future price movements.
If you want to see more bullish engulfing pattern chart examples, check out this guide with 8 real trading setups.
Important: Use the Bullish Engulfing Pattern as Confirmation
It is important to understand that traders do not rely on the bullish engulfing pattern to predict future price movements on its own.
Instead, this pattern is used as a confirmation signal that supports an existing trading setup.
Professional traders typically combine the bullish engulfing pattern with other elements such as:
- key support and resistance levels
- trend direction
- liquidity zones
- institutional buying pressure
When these factors align, the bullish engulfing pattern can provide strong confirmation that buyers are gaining control of the market.
Why the Bullish Engulfing Pattern Is Important in Trading
The bullish engulfing candlestick pattern is important because it provides valuable real-time information about the balance between buyers and sellers.
By analyzing this pattern, traders can better understand whether buyers are gaining control of the market or if a trend may be about to change direction.
The bullish engulfing pattern can be useful for different types of traders, including trend followers and contrarian traders.
Using the Bullish Engulfing Pattern to Join a Strong Trend
If you are a trend-following trader, the bullish engulfing pattern can help you join an existing trend when you missed the early entry.
Look at this chart example.

In this situation, the market is clearly trending upward, which means buyers are dominating the market.
However, the price is moving strongly, and there is no obvious key support level where traders can wait for a traditional pullback entry.
So what can you do in this situation?
Instead of chasing the price, you can wait for a price action signal that confirms buyers are still in control.
As shown on the chart, the market forms a bullish engulfing pattern. This pattern shows that sellers attempted to push the market lower during that period, but their effort failed.
The strong bullish candle that followed completely engulfed the previous bearish candle, confirming that buyers quickly regained control.
This signal indicates that buyers are still dominating the market despite the temporary selling pressure, giving trend traders an opportunity to enter the market and ride the continuation of the uptrend.
As the chart shows, the market continued moving higher after the formation of the bullish engulfing pattern.
In this way, the bullish engulfing pattern can help traders find opportunities to join an already established trend.
Using the Bullish Engulfing Pattern to Trade Reversals
The bullish engulfing pattern can also be useful for contrarian traders who specialize in trading reversals.
Look at another chart example.

In this case, the market was clearly trending downward, which means sellers were controlling the market.
Eventually, price reached a level where the market reacted several times, forming a support level.
When price attempted to break this level again for the third time, sellers failed to push the market lower. Instead, the market formed a bullish engulfing candlestick pattern.
This pattern suggests that sellers were losing momentum, while buyers were starting to step into the market.
The strong bullish candle that engulfed the previous bearish candle indicated that buyers had absorbed the selling pressure, increasing the probability of a trend reversal.
As shown in the chart, the market moved higher after the formation of the bullish engulfing pattern, confirming the shift in momentum.
Important Trading Note
The bullish engulfing pattern is not a “holy grail” trading signal.
Traders should not expect the market to move in their favor every time this pattern appears.
Instead, the bullish engulfing pattern should be used as a confirmation signal, combined with other technical tools such as:
- key support and resistance levels
- trend direction
- moving averages
- trend lines
- liquidity zones
When these elements align with the bullish engulfing pattern, the probability of a successful trade can increase significantly.
Bullish Engulfing Pattern Trading Strategies
Now let’s move to the bullish engulfing pattern trading strategies.
In this section, you will learn six powerful ways to trade this pattern.
1. Trading the Bullish Engulfing Pattern With the Trend
This is one of the most reliable strategies you can use.
It is simple, but very effective.
How the Strategy Works
First, you need to identify a clear uptrend.
Then:
- Wait for price to break above a resistance level
- Wait for a pullback into that level
- Watch for a bullish engulfing candlestick pattern
What Happens on the Chart

As you can see in the chart:
- The market is trending upward
- Price breaks above a key resistance level
- Then it pulls back to that level
When price returns to the level:
- It gets rejected
- A bullish engulfing pattern forms
This is a critical moment.
What the Pattern Tells You
The bullish engulfing pattern shows that:
- Sellers tried to push the price lower
- But buyers completely overpowered them
This indicates:
The retracement is likely over, and a new impulsive move upward is beginning.
Entry, Stop Loss, and Target

Once the bullish engulfing candle closes:
- Entry: at the close of the candle
- Stop Loss: below the pattern
- Target: the next key level
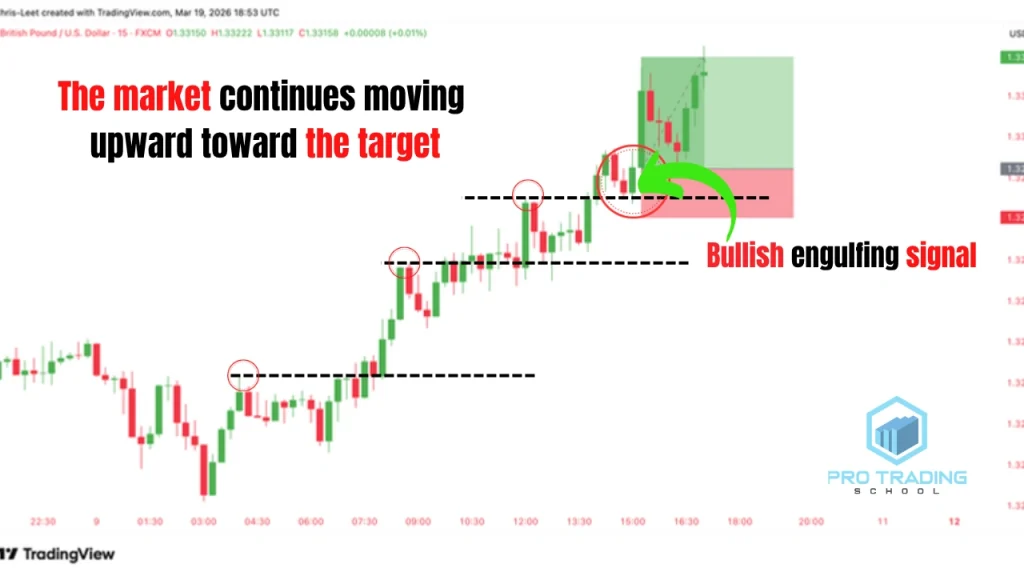
As expected, the market continues moving upward toward the target.
Important Note
Before taking any trade, you must perform a top-down analysis.
Make sure that:
You are trading in the direction of the higher time frame trend.
Advantages of This Strategy
1-You trade with the trend, which increases your probability of success
2-You enter at the end of the pullback (buy low)
3-You use a powerful confirmation signal
Disadvantages of This Strategy
1-Markets trend only about 20–30% of the time, so opportunities can be limited
2-Trends can reverse at any moment
3-Sometimes the market moves strongly and does not retrace, causing missed trades.
2. Trading the Bullish Engulfing Pattern with Moving Averages
Now let’s move to another powerful strategy:
Step 1 — Add Moving Averages to Your Chart
First, let me show you how to set up the moving averages.
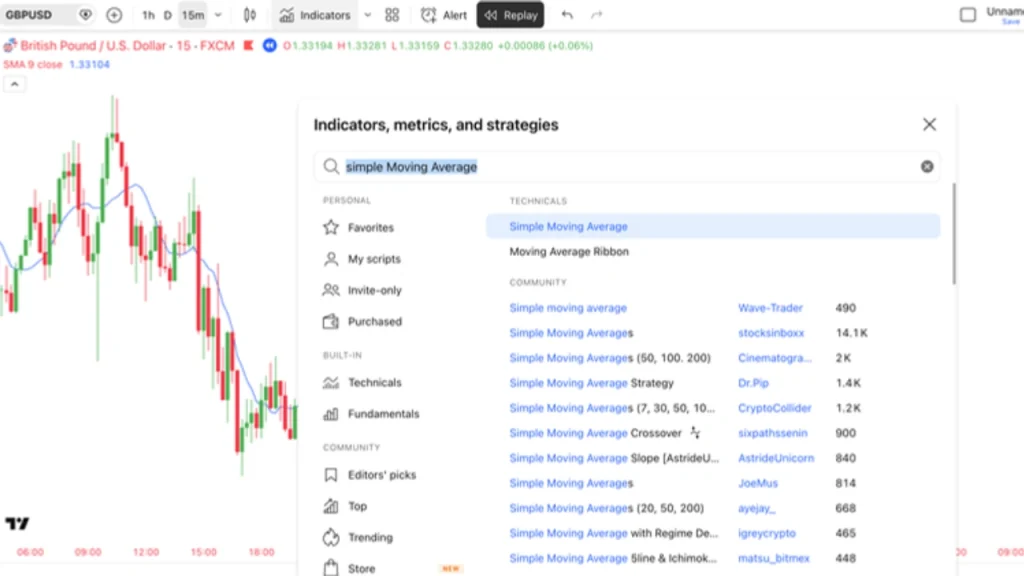
How to Add a Simple Moving Average:
- Go to your chart on TradingView
- Click on “Indicators” at the top
- Search for “Moving Average”
- Click on “Moving Average” to add it to your chart
Customize the First Moving Average:
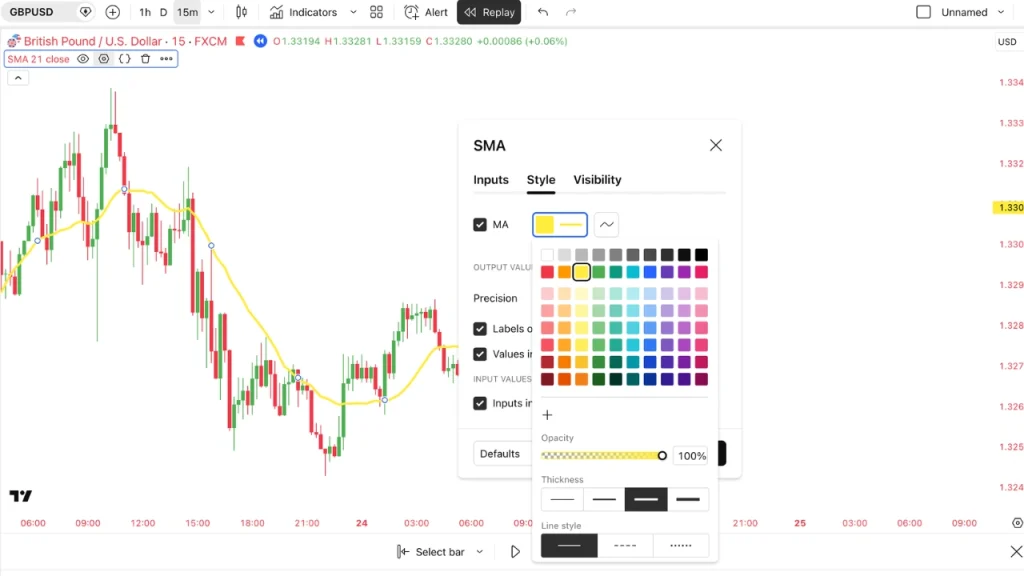
- Click on the moving average line
- Go to Settings
- Change the length to 21
- Change the color to yellow
Add the Second Moving Average:
- Repeat the same steps
- Add another Moving Average
- Change the length to 50
- Change the color to blue
Now you have:

- 21 Simple Moving Average (Yellow)
- 50 Simple Moving Average (Blue)
Step 2 — Understand the Strategy
This strategy is simple and powerful.
You will combine:
- Trend identification
- Pullback entry
- Candlestick confirmation
Step 3 — Entry Rules (Step-by-Step)
Follow these steps carefully:
- Wait for the 21 moving average to cross above the 50 moving average
- This crossover signals the beginning of an uptrend
- Wait for a pullback toward the 21 moving average
- Watch for a bullish engulfing candlestick pattern
- Enter the trade at the close of the engulfing candle
Step 4 — What Happens on the Chart
As you can see in the chart:

- The 21 moving average crosses above the 50 moving average
- This indicates that buyers are taking control
- The market establishes an uptrend
Then:
- Price pulls back toward the 21 moving average
- A bullish engulfing pattern forms at that level
Step 5 — What the Pattern Tells You
The bullish engulfing pattern at the 21 moving average shows that:
- Sellers tried to push price lower
- But buyers stepped in and rejected the pullback
This indicates:
The pullback is likely over, and the market is ready to continue upward.
Step 6 — Entry, Stop Loss, and Exit

- Entry: at the close of the bullish engulfing candle
- Stop Loss: below the pattern
- Exit: keep the trade open as long as price stays above the 21 moving average
Close the trade when:
A candle closes below the 21 moving average.
Step 7 — Trade Management

As shown in the chart:
- After the bullish engulfing pattern, the market continues moving up
- You follow the trend
- You stay in the trade as long as price respects the 21 moving average
Once a candle breaks and closes below the 21 moving average:
- You exit the trade
Advantages of This Strategy
- Clear trend confirmation using moving averages
- You enter at the end of the pullback
- Combines technical structure + candlestick confirmation
- Helps you stay in the trade longer
Disadvantages of This Strategy
- Moving averages are lagging indicators
- False crossovers can happen in sideways markets
- Strong trends may not always retrace to the 21 moving average
Trading the Bullish Engulfing Pattern During Strong Trends
One of the biggest frustrations you will face as a trader is this:

The market is trending strongly… but it never gives you a pullback.
You wait.
You stay disciplined.
But price keeps moving without you.
As a result, you feel like you are missing profitable opportunities.
But here is the truth:
Strong trends require a different entry approach.
Instead of waiting for a deep retracement, you need to learn how to enter during momentum.
Why Pullbacks Are Rare in Strong Trends
in a strong uptrend:
- Buyers are highly aggressive
- Institutions keep accumulating positions
- Selling pressure is weak
This creates:
- Large bullish candles
- Minimal retracements
- Continuous upward movement
Because of this, waiting for a perfect pullback can cause you to miss the entire move.
The Second-Chance Entry Strategy
To solve this problem, you need a continuation signal.
This is where candlestick patterns become extremely useful.
Some of the most powerful continuation patterns include:
- Doji candlestick pattern
- Inside bar pattern
- Bullish engulfing candlestick pattern
In this strategy, you will use the bullish engulfing pattern as a second-chance entry signal.
How to Trade the Bullish Engulfing Pattern in Strong Trends
Follow these steps carefully:
Step 1 — Identify a Strong Uptrend
Look for:
- One move upward without a pullback.
- Strong bullish candles
- Clear upward momentum
Step 2 — Wait for a Small Pullback
In strong trends, pullbacks are usually:
- Short
- Shallow
- Quick
This often appears as:
- A small bearish candle
- Or a brief pause in price
Step 3 — Wait for a Bullish Engulfing Pattern
After the small pullback, watch for:

A bullish engulfing candle that fully covers the previous candle.
This is your key signal.
Step 4 — Execute the Trade

- Entry: at the close of the bullish engulfing candle
- Stop Loss: below the pattern
- Target: the next key level or resistance zone
What the Bullish Engulfing Pattern Really Tells You
The bullish engulfing pattern in this context reveals something critical:
- Sellers attempted to create a pullback
- But buyers immediately absorbed the selling pressure
- The market is ready to continue in the direction of the trend
In simple terms:
The trend is still strong, and buyers remain in control.
Why This Strategy Works
This strategy works because it aligns with institutional behavior.
In strong trends:
- Institutions do not wait for deep retracements
- They continue buying aggressively
- Minor pullbacks are quickly rejected
- The bullish engulfing candle is the footprint of that aggressive buying.
Advantages of This Strategy
- Allows you to enter strong trends without waiting for deep pullbacks
- Helps you avoid missing major moves
- Uses a clear and powerful confirmation signal
- Works well in high-momentum markets
Disadvantages of This Strategy
- Higher risk if the trend suddenly weakens
- False signals can occur in choppy markets
- Requires strong discipline to avoid entering too early
Important Disclaimer
The bullish engulfing pattern is not a guaranteed signal.
- Sometimes it works
- Sometimes it fails
However:
When used in the right market conditions, it becomes a high-probability setup.
To succeed in the long run, you must always apply:
- Proper risk management
- Consistent execution
- Strong market context analysis
Key Takeaway
When the market is trending strongly, waiting for perfect pullbacks can cost you opportunities.
Instead:
Use the bullish engulfing pattern as a second-chance entry to join the trend while momentum is still strong.
4. Trading the Bullish Engulfing Pattern with Trend Lines
Now let’s move to another powerful strategy:
Trading the bullish engulfing pattern with trend lines.
This strategy allows you to combine:
- Market structure
- Dynamic support
- Candlestick confirmation
What Is a Trend Line?

A trend line is a simple but powerful tool used to identify the direction of the market.
It is a line drawn on the chart that connects key swing highs or swing lows, helping you visualize the overall trend.
In an uptrend:
- The trend line connects higher lows
In a downtrend:
- The trend line connects lower highs
How to Draw a Trend Line
Drawing a trend line is simple.
Follow these steps:

- Identify two clear swing points (highs or lows)
- Connect them with a straight line
- Adjust the line so it fits the price structure naturally
Important:
Do not focus too much on whether the line touches the wicks or the candle bodies.
The goal is to draw a logical and clean structure that represents the trend.
Strategy 1 — Trend Line Bounce with Bullish Engulfing
This is the most common way to use this strategy.
How It Works
- Identify a clear uptrend
- Draw a bullish trend line connecting higher lows
- Wait for price to retrace back to the trend line
- Look for a bullish engulfing pattern at the trend line
- Enter the trade at the close of the engulfing candle
What Happens on the Chart
As you can see:

- The market is trending upward
- A trend line is drawn connecting the higher lows
- Price retraces back to the trend line
At that level:
- A bullish engulfing pattern forms
What This Means
This setup tells you that:
- Sellers tried to push the price lower
- But buyers stepped in at the trend line and rejected the pullback
This indicates:
The retracement is likely over, and the market is ready to continue upward.
Entry, Stop Loss, and Target

- Entry: at the close of the bullish engulfing candle
- Stop Loss: below the pattern
- Target: the next key level
As expected, the market continues moving upward.
Strategy 2 — Trend Line Break and Retest with Bullish Engulfing
This is a more advanced and powerful setup.
How It Works
- Identify a downtrend
- Draw a bearish trend line connecting lower highs
- Wait for price to break above the trend line
- Wait for a pullback (retest) to the broken trend line
- Look for a bullish engulfing pattern
- Enter at the close of the engulfing candle
What Happens on the Chart
As you can see:

- The market is trending downward
- A bearish trend line is clearly respected
- Price breaks above the trend line
Then:
- Price retraces back to test the broken trend line
- A bullish engulfing pattern forms
What This Means
This setup tells you something very important:
- The bearish trend line is broken
- Sellers are losing control
- Buyers are starting to dominate
The retest provides:
A high-probability, low-risk opportunity to enter a new uptrend early.
Entry, Stop Loss, and Target

- Entry: at the close of the bullish engulfing candle
- Stop Loss: below the pattern
- Target: the next key level
As shown in the chart, the market moves upward as expected.
Why This Strategy Works
Trend lines represent dynamic support and resistance.
When combined with a bullish engulfing pattern:
- You get confirmation of buyer strength
- You enter at a key reaction point
- You align with the market structure
Advantages of This Strategy
- Combines structure + confirmation
- Works in both trend continuation and reversals
- Provides high reward-to-risk opportunities
- Easy to identify on the chart
Disadvantages of This Strategy
- Trend lines can be subjective
- False breakouts can occur
- Requires practice to draw accurate trend lines
Key Takeaway
The bullish engulfing pattern becomes significantly more powerful when it forms:
At a trend line or after a trend line break and retest.
This combination allows you to:
- Enter trends with precision
- Confirm market direction
- Improve your overall trading accuracy
5. How to Trade the Bullish Engulfing Pattern Against the Trend
Trading the bullish engulfing pattern with the trend is more reliable and provides high-probability setups.
However:
Learning how to trade against the trend can help you catch high reward-to-risk opportunities.
But there is one important rule:
You should never trade against the trend using candlestick patterns alone.
Instead, you need to combine the pattern with advanced concepts used by institutional traders.
One of the most powerful concepts is:
Liquidity Sweep
What Is a Liquidity Sweep?

A liquidity sweep occurs when the market:
- Breaks a key level
- Triggers stop-loss orders
- Traps traders on the wrong side
- Then reverses in the opposite direction
This is how smart money enters the market.
Market Context — What Happens Before the Setup
Look at the chart.

- The market is in a clear downtrend
- Sellers are in control
- As a trend trader, you would normally look for selling opportunities
Then something important happens:
- Price reaches a level and reacts strongly upward
- It comes back again and reacts from the same level
This creates a key support level.
At this point:
The market is no longer clearly trending — it is starting to transition.
What Happens Next — The Trap
Now pay close attention.
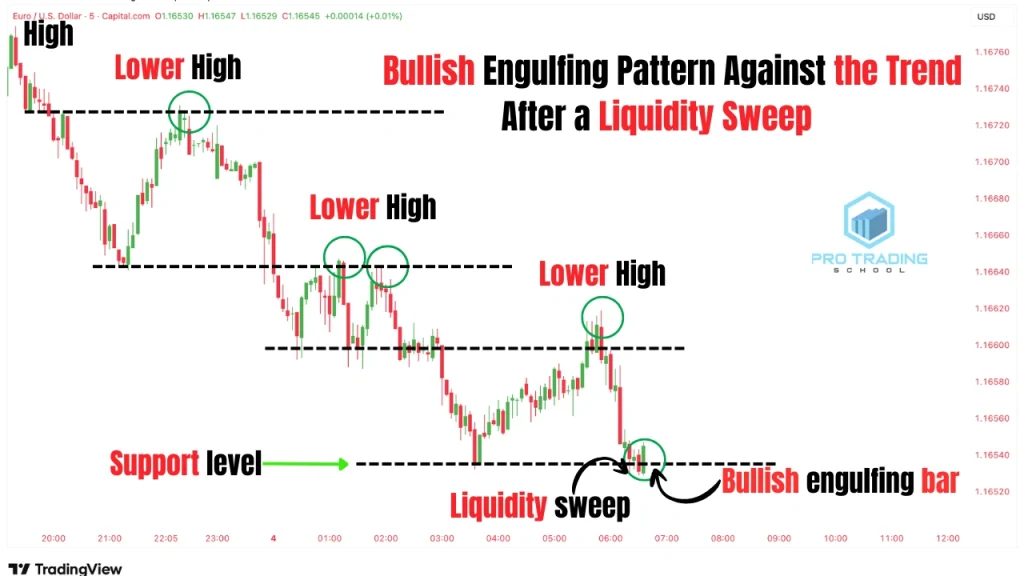
- Price breaks below the support level
- Many traders think this is a breakout
- Sellers enter the market
- Buyers who entered earlier get stopped out
But then:
Price suddenly reverses and closes above the level, forming a bullish engulfing pattern.
What Does This Mean?
This is a classic liquidity sweep.
Here is what really happened:
- The market moved below support to trigger stop-losses
- It trapped breakout sellers
- It collected liquidity from both sides
Then:
Buyers stepped in and took full control of the market.
The Role of the Bullish Engulfing Pattern
The bullish engulfing pattern in this setup is critical.
It confirms that:
- The liquidity sweep is complete
- Sellers are trapped
- Buyers are now in control
In other words:
The market is ready to reverse.
How to Trade This Setup
Follow these steps:
Step 1 — Identify a Downtrend
Step 2 — Mark a Key Support Level
Step 3 — Wait for a Break Below the Level
Step 4 — Look for a Strong Rejection
Step 5 — Confirm with a Bullish Engulfing Pattern
Entry, Stop Loss, and Target

- Entry: at the close of the bullish engulfing candle
- Stop Loss: below the liquidity sweep low
- Target: the next key resistance level
Why This Strategy Works
This setup works because it follows smart money behavior.
Institutional traders:
- Need liquidity to enter large positions
- Use stop-loss clusters to fill orders
- Create false breakouts to trap retail traders
The liquidity sweep + bullish engulfing pattern shows:
The trap is complete, and the real move is about to begin.
Advantages of This Strategy
- Provides high reward-to-risk trades
- Allows early entry into a new trend
- Based on institutional trading logic
- Works well at key levels
Disadvantages of This Strategy
- Requires strong understanding of market structure
- False sweeps can occur
- More complex than trend-following strategies
Important Note
Trading against the trend is more advanced.
You should only take these setups when:
- There is a clear liquidity sweep
- The level is well defined
- The engulfing pattern is strong and clear
Key Takeaway
The bullish engulfing pattern becomes extremely powerful when it appears:
After a liquidity sweep at a key level.
This combination allows you to:
- Trade against the trend safely
- Identify market reversals early
- Align with smart money behavior
6. Trading the Bullish Engulfing Pattern in a Range-Bound Market
Now let’s move to the final strategy:
Trading the bullish engulfing pattern in a range-bound market.
What Is a Range-Bound Market?

A range-bound market occurs when price moves sideways between two levels:
- A support level (bottom of the range)
- A resistance level (top of the range)
In this market condition, there is no clear trend. Buyers and sellers are in equilibrium.
This means:
You must adapt your strategy.
How to Trade in a Range
During a range-bound market:
You should only trade at the boundaries.
That means:
- Buy at support
- Sell at resistance
Avoid trading in the middle of the range, where the market is uncertain.
Strategy 1 — Buying at Support with a Bullish Engulfing Pattern
How It Works
- Identify a clear range (support and resistance)
- Wait for price to reach the support level
- Look for a bullish engulfing pattern
- Enter at the close of the engulfing candle
What Happens on the Chart
As you can see:

- The market is moving horizontally
- Price reaches the support level again
- A bullish engulfing pattern forms
What This Means
This setup tells you:
- Sellers tried to break the support
- But buyers stepped in and rejected the move
This indicates:
The market is likely to move back toward the resistance level.
Entry, Stop Loss, and Target

- Entry: at the close of the bullish engulfing candle
- Stop Loss: below the support level
- Target: the resistance level
As expected, the market moves upward toward the target.
Strategy 2 — Breakout, Retest, and Bullish Engulfing
Now let’s look at another powerful setup.
How It Works
- Wait for price to break above the resistance level
- Do not enter immediately
- Wait for a pullback (retest)
- Watch for a bullish engulfing pattern
- Enter at the close of the engulfing candle
What Happens on the Chart

- The market breaks above the range
- Price retraces back to the broken resistance (now support)
- A bullish engulfing pattern forms
What This Means
This setup confirms that:
- The breakout is valid
- Buyers are still in control
- The market is likely to continue upward
Entry, Stop Loss, and Target
- Entry: at the close of the engulfing candle
- Stop Loss: below the pattern or below the new support
- Target: the next key level
As shown in the chart above, the market continues moving upward.
Why This Strategy Works
Range-bound markets are driven by:
- Support acting as a buying zone
- Resistance acting as a selling zone
The bullish engulfing pattern confirms:
Buyers are defending support or validating a breakout.
Advantages of This Strategy
- Clear structure with defined levels
- High probability setups at key zones
- Works well for both reversals and breakouts
- Easy to identify visually
Disadvantages of This Strategy
- False breakouts can occur
- Ranges can suddenly turn into trends
- Requires patience and discipline
Key Takeaway
In a range-bound market:
The bullish engulfing pattern is most effective when used at support or after a breakout retest.
This allows you to:
- Trade with structure
- Confirm market direction
- Improve your entry timing
Limitations of the Bullish Engulfing Candlestick Pattern
The bullish engulfing candlestick pattern is one of the most powerful trading setups.
However:
It is not a perfect signal, and it has several limitations that every trader must understand.
1. Not All Bullish Engulfing Patterns Work
One of the most important things to understand is:
Not every bullish engulfing pattern leads to a successful trade.
Sometimes:
- The pattern forms
- The market gives a false signal
- Price reverses against your position
This is why:
You must always apply proper risk management.
2. Risk-to-Reward Ratio Can Be Unfavorable
In some cases, the setup may look strong, but:
- The stop loss is too large
- The target is too close
This creates a poor risk-to-reward ratio.
As a trader, you should always ask:
Is this trade worth the risk?
Even if the setup is valid:
A trade with a low reward compared to the risk should be avoided.
3. Works Best in Specific Market Conditions
The bullish engulfing pattern performs best when used in the right context.
It works very well:
- In a clear uptrend
- After a pullback to a key support level
- With strong bullish momentum
It can also work against the trend:
- When combined with advanced concepts such as liquidity sweeps
4. Performs Poorly in Choppy Markets
The biggest weakness of this pattern is:
Sideways or choppy market conditions
In these markets:
- Price moves randomly
- There is no clear direction
- Buyers and sellers are in equilibrium
As a result:
- The bullish engulfing pattern often produces false signals
Key Takeaway
The bullish engulfing pattern is a powerful tool, but:
Its effectiveness depends on market context, risk management, and proper execution.
To use it effectively:
- Trade it in trending markets
- Combine it with key levels and structure
- Avoid choppy conditions
- Always manage your risk
Conclusion
The bullish engulfing candlestick pattern is one of the most effective tools you can use to understand market behavior.
But as you have seen throughout this guide:
It is not just a pattern — it is a reflection of the battle between buyers and sellers.
When used correctly, it can help you:
- Identify high-probability trading opportunities
- Time your entries with precision
- Trade in alignment with market structure
However, its true power comes from context.
The bullish engulfing pattern becomes highly effective when it is combined with:
- Trend direction
- Key support and resistance levels
- Moving averages
- Trend lines
- Liquidity sweeps
- Market structure
At the same time, you must remember:
No strategy works all the time.
That is why successful traders focus on:
- Risk management
- Discipline
- Consistency
Instead of chasing perfect setups.
Final Thought
If there is one thing you should take away from this article, it is this:
The bullish engulfing pattern is not a signal to blindly follow — it is a tool to help you understand when buyers are taking control of the market.
Master the context, manage your risk, and stay disciplined.
That is how you turn a simple candlestick pattern into a powerful trading strategy.
FAQ — Bullish Engulfing Candlestick Pattern
What is a bullish engulfing pattern?
A bullish engulfing pattern is a two-candle formation that signals a potential shift from selling pressure to buying pressure. It is the opposite of the bearish engulfing candlestick pattern.
It occurs when:
- A small bearish candle is followed by
- A larger bullish candle that completely “engulfs” the previous one
This pattern shows that buyers have taken control of the market after sellers attempted to push the price lower.
It is commonly used by traders to identify potential reversal or continuation opportunities, depending on the market context.
It’s also important to understand the difference between patterns, especially when comparing the piercing pattern vs bullish engulfing setups.
What is the success rate of a bullish engulfing pattern?
The success rate of a bullish engulfing pattern is not fixed and depends heavily on the market conditions.
In general:
- It tends to perform better in trending markets, especially after a pullback
- It is more reliable when it forms at key support levels or important zones
- It becomes stronger when combined with tools like trend analysis or liquidity concepts
Rather than focusing on a specific percentage, traders should focus on:
Using the pattern in the right context and applying proper risk management.
What is an example of an engulfing pattern?
An example of a bullish engulfing pattern can be seen when:
- The market is moving downward or pulling back
- A small bearish candle forms
- The next candle opens lower and closes higher, fully covering the previous candle
This indicates that buyers have absorbed the selling pressure and are pushing the price upward.
Such setups are often used as entry signals, especially when they appear near support or after a retracement.
Is a bullish engulfing pattern always accurate?
No, the bullish engulfing pattern is not always accurate.
Like any trading signal:
- It can produce false signals
- It does not guarantee a price reversal
Its effectiveness depends on:
- Market structure
- Trend direction
- Overall context
For this reason:
The pattern should always be combined with other forms of analysis and proper risk management.
What’s the best timeframe for bullish engulfing?
The bullish engulfing pattern can appear on any timeframe, but its reliability varies.
- Higher timeframes (such as 1H, 4H, and Daily) tend to produce more reliable signals
- Lower timeframes can generate more setups but may include more noise and false signals
Many traders prefer to:
Use higher timeframes for trend direction and lower timeframes for entry confirmation.
Does the bullish engulfing pattern work in all markets?
The bullish engulfing pattern can be used in different markets such as forex, stocks, and cryptocurrencies. However, its performance depends on volatility, liquidity, and market conditions. It tends to work best in markets with clear trends and strong participation.










Your great work assisted me to fully understand what the bullish engulfing candlestick patterns was
Thank you very much for the feedback.I appreciate it
Thanks alot, I have now understood how,when to use the engulfing candlestick. Waiting for more awesome content.Thanks once again