
The Morning Star is a bullish reversal candlestick pattern that typically forms at the end of a downtrend.
It signals that selling pressure is weakening and buyers may be starting to take control of the market. As a result, many traders use this three-candle formation to identify potential trend reversals and buying opportunities.
The pattern tends to be more reliable when it forms at key support levels, demand zones, or other areas where institutional buyers may be active.
When combined with additional technical analysis tools, it can provide a high-probability trading setup.
However, one important concept that many traders overlook is that the Morning Star is not limited to trend reversals.
It can also act as a bullish continuation signal during an existing uptrend. For example, after a breakout above a major resistance level, the market may pull back to retest that level as new support.
If a Morning Star forms during the retest, it can signal that buyers are stepping back into the market and that the uptrend is likely to continue.
Key Takeaways
-The Morning Star is a bullish reversal candlestick pattern that typically forms at the end of a downtrend.
-It consists of three candles: a bearish candle, a small indecision candle, and a bullish confirmation candle.
-The pattern signals a potential shift in control from sellers to buyers.
-Morning Star formations tend to be more reliable when they appear at key support levels or demand zones.
-The pattern can also act as a bullish continuation signal during an uptrend after a pullback.
-Traders often combine it with support and resistance levels, moving averages, Bollinger Bands, and other technical analysis tools.
-Common entry techniques involve entering at the close of the third candle and placing a stop loss below the pattern.
-Like any trading setup, the Morning Star does not work every time and should be combined with proper risk management and higher-timeframe analysis.
Morning Star Candlestick Pattern Characteristics
The Morning Star is a three-candlestick bullish reversal pattern that forms after a downtrend and signals a potential shift from bearish momentum to bullish momentum.

First Candle
The first candle is a strong bearish candle that confirms sellers are still in control of the market and that the current downtrend remains intact.
Second Candle
The second candle is usually a small bullish or bearish candle, and it represents market indecision or a slowdown in selling pressure.
In some cases, the second candle forms as a Doji candlestick, which reflects equilibrium between buyers and sellers.
This candle indicates that sellers are losing momentum while buyers are starting to enter the market.
Third Candle
The third candle is a strong bullish candle that closes above the midpoint of the first candle. This candle confirms that buyers have taken control of the market and increases the probability of a bullish trend reversal.
Morning Star Chart Pattern Example

The Morning Star is a bullish reversal pattern that typically forms at the end of a downtrend and signals a potential shift from bearish to bullish market conditions.
It represents a transfer of control from sellers to buyers and often marks the beginning of a new upward move.
The pattern becomes even more significant when it forms at a key support level or within a demand zone, where buying pressure is likely to emerge.
One important detail that many traders overlook is that this three-candle formation can also act as a bullish continuation signal.
During an uptrend, it may appear when the market retests a former resistance level that has turned into support after a breakout.
In this situation, the pattern can indicate that buyers are defending the new support level and preparing for another move higher.
In the chart example above, you can clearly identify a Morning Star formation after a sustained decline.
The market had been making lower lows and lower highs, confirming that sellers were in control.
However, the appearance of the pattern suggested that bearish momentum was beginning to fade and that a trend reversal could be developing.
The first candle reflects strong selling pressure and confirms seller dominance. The second candle shows indecision, indicating that sellers are losing momentum while buyers begin to step into the market.
The third candle is a strong bullish candle that confirms buyers have taken control. This shift in market sentiment often signals that prices are likely to move higher, which is exactly what happened in the chart example above.
While the Morning Star is one of the most reliable bullish reversal patterns, it is not the only candlestick setup worth learning. To expand your knowledge, check out our 33 Candlestick Patterns Cheat Sheet (Simple Visual Guide), where you’ll discover the most important bullish, bearish, and indecision patterns used by traders.
Morning Star Pattern With a Doji

In the chart example above, you can clearly see a variation of the Morning Star pattern that contains a Doji as the middle candle.
Many traders consider this version to be one of the strongest because the Doji reflects a high level of market indecision between buyers and sellers.
What Does This Pattern Mean?
To understand the message behind this formation, it is important to analyze the role of each candle.
The first candle confirms strong seller dominance and shows that bearish momentum is still in control. At this stage, most traders expect the downtrend to continue.
The second candle is a Doji, which signals indecision and a temporary pause in the market. This is a critical part of the pattern because it suggests that selling pressure is beginning to weaken.
After a strong decline, the market is no longer moving lower with the same conviction, indicating that the balance between buyers and sellers is starting to shift.
As you can see, the Doji plays an important role in this variation of the Morning Star by highlighting market indecision and a potential shift in momentum. If you would like to learn more about how to trade Doji formations, check out our Doji Candlestick Pattern: Best Entry and Exit Trading Strategies guide.
The third candle provides the confirmation traders are looking for. A strong bullish close shows that buyers have stepped in aggressively and taken control from sellers.
This change in momentum often signals that the downtrend may be ending and that a bullish reversal is likely to develop.
When a Morning Star with a Doji forms near a support level, demand zone, or another important area on the chart, it can provide an even stronger indication that buyers are preparing to push prices higher.
Difference Between the Morning Star and Evening Star Pattern
There is a significant difference between the Morning Star and the Evening Star pattern, even though both are three-candlestick reversal formations.

The Morning Star is a bullish reversal pattern that forms at the end of a downtrend. It signals that selling pressure is weakening and that buyers may be preparing to reverse the market higher.
Traders often use this pattern to identify potential buying opportunities after a sustained decline.
The Evening Star is the bearish counterpart of the Morning Star. It forms at the end of an uptrend and signals that buying pressure may be fading.
As a result, it can indicate the beginning of a downward reversal and potential selling opportunities.
The key difference lies in the shift of market control. A Morning Star reflects a transfer of power from sellers to buyers.
The first candle shows strong selling pressure, the second candle reflects indecision, and the third candle confirms that buyers have taken control.
An Evening Star tells the opposite story. The first candle shows strong buying pressure, the second candle signals hesitation or indecision, and the third candle confirms that sellers have gained control of the market.
In simple terms, the Morning Star is a bullish signal that appears after a downtrend, while the Evening Star is a bearish signal that appears after an uptrend.
If you want to learn how to identify and trade this powerful bearish setup, check out our Evening Star Candlestick Pattern Explained: 5 Powerful Bearish Reversal Signals guide.
How to Trade the Morning Star Candlestick Pattern
When it comes to trading the Morning Star pattern, there is no single approach that works for every trader.
The best strategy often depends on your trading style, whether you are a scalper, day trader, swing trader, or position trader. In this section, we will cover three practical ways to trade this bullish reversal signal.
Trading the Morning Star at a Key Support Level
The idea behind this strategy is straightforward. First, identify a clear downtrend and a significant support level.
Then, wait for the market to test that level. If a Morning Star formation appears at support, it can provide an early signal that the downtrend is losing momentum and that buyers may be preparing to push prices higher.
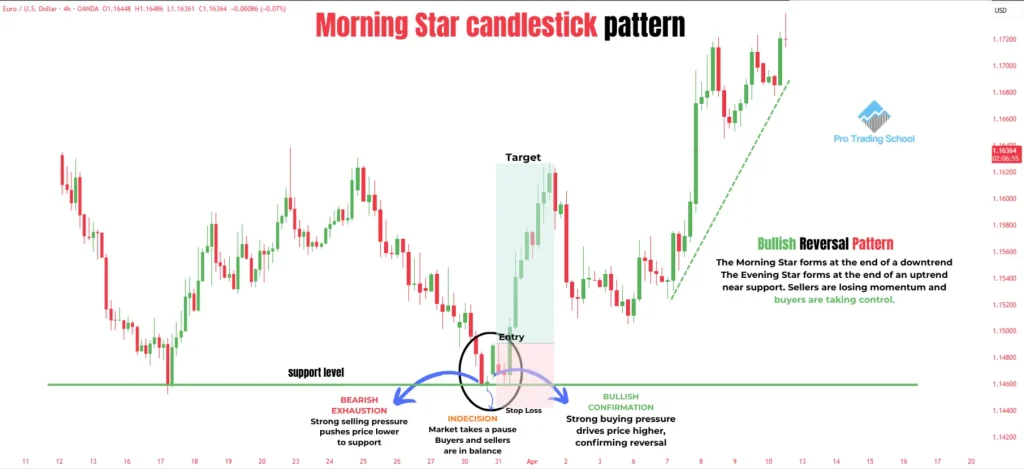
As shown in the chart above, the market was trending lower before reaching a key support level and bouncing.
After the initial rebound, price retraced back to the same support area. When the Morning Star formed during this retest, it provided additional confirmation that the level was still attracting buyers.
From a market psychology perspective, this setup tells an interesting story. The first candle shows that sellers are still attempting to break below support and continue the downtrend.
However, the second candle reveals hesitation and indecision. This is an important clue because strong trends rarely pause at critical levels unless one side of the market is losing conviction. When indecision appears at support, it often suggests that sellers are no longer in complete control.
The third candle provides the confirmation. Buyers step into the market aggressively and push prices higher, creating a clear shift in control from sellers to buyers. This transfer of power is what makes the setup attractive to many traders.
Entry, Stop Loss, and Take Profit
- Entry: Enter at the close of the third bullish candle.
- Stop Loss: Place your stop loss below the low of the pattern or below the Doji if the pattern contains one.
- Take Profit: Target the next major resistance level or use a predefined risk-to-reward ratio.
In the example above, the market moved significantly higher after the pattern formed, generating a reward-to-risk ratio greater than 3:1.
Important Note
Like any trading setup, the Morning Star is not a holy grail. It does not work every time, and no candlestick pattern can guarantee future price movements.
Successful trading requires proper risk management, position sizing, and a solid understanding of higher-timeframe market structure.
Before taking any trade, it is always a good idea to perform a top-down analysis and ensure that the setup aligns with the broader market trend.
When the Morning Star appears at a key support level and is supported by higher-timeframe confluence, its probability of success can improve significantly.
Trading the Morning Star With Moving Averages
In this strategy, we will combine the Morning Star pattern with two simple moving averages. The goal is to trade bullish continuation setups in the direction of the dominant trend while using moving averages to identify high-probability pullback opportunities.
The first moving average is the 200 Simple Moving Average (SMA), which we use to determine the overall market trend.
When price is trading above the 200 SMA, the market is generally considered to be in an uptrend. This helps us focus only on buying opportunities and avoid trading against the prevailing trend.
The second moving average is the 50 Simple Moving Average (SMA). In this strategy, it acts as a dynamic support level where price may retrace before continuing higher.
As mentioned earlier, the Morning Star is not only a bullish reversal pattern. It can also be used as a bullish continuation signal when it forms during an existing uptrend. This is exactly how we will use it here.
Look at the chart below.
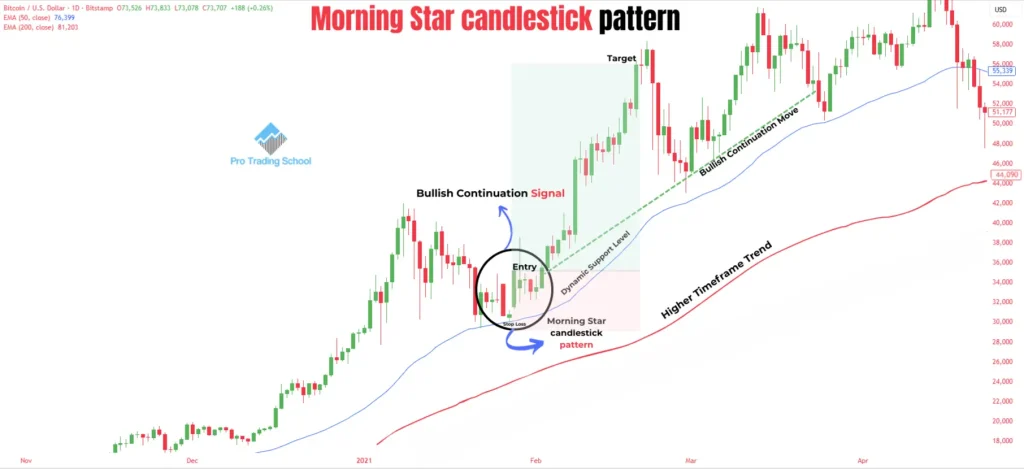
As you can see, the market was trading above the 200 SMA, confirming an established uptrend.
After an impulsive move higher, price pulled back toward the 50 SMA, which was acting as dynamic support.
When the Morning Star formed at this area, it signaled that buyers were stepping back into the market and that the pullback was likely coming to an end.
From a market psychology perspective, the retracement represents temporary profit-taking rather than a change in trend.
The first candle of the pattern shows that sellers are still attempting to push prices lower. The second candle reflects indecision, suggesting that bearish momentum is weakening.
The third candle confirms that buyers have regained control and are ready to continue the primary uptrend.
Entry, Stop Loss, and Take Profit
- Entry: Enter at the close of the third bullish candle.
- Stop Loss: Place the stop loss below the low of the pattern or below the Doji candle if one is present.
- Take Profit: Target the next major resistance level or use a predefined risk-to-reward ratio.
As shown in the example above, once the pattern was completed, the market resumed its upward movement and continued in the direction of the dominant trend.
This is why many traders combine moving averages with candlestick patterns—to find low-risk entries during pullbacks while trading with the overall market direction.
Trading the Morning Star With Bollinger Bands
Another powerful way to trade the Morning Star candlestick pattern is by combining it with the Bollinger Bands indicator.
This strategy helps traders identify oversold market conditions and potential bullish reversals with greater precision.
The Bollinger Bands indicator consists of three lines:
- The middle band, which is usually a 20-period moving average
- The upper band
- The lower band
The bands automatically expand and contract depending on market volatility. When volatility increases, the bands widen, and when volatility decreases, the bands become narrower.
Traders commonly use the Bollinger Bands to identify overbought and oversold market conditions. In a downtrend, price tends to move toward the lower Bollinger Band, which often acts as a dynamic support zone where selling pressure may start weakening.
When trading the Morning Star pattern, we focus on the lower Bollinger Band because it can help us identify areas where the market may be oversold.
The idea behind this strategy is simple. We wait for the market to decline toward the lower Bollinger Band during a bearish move.
If a Morning Star candlestick pattern forms near or directly on the lower band, it signals that sellers may be losing momentum and that buyers are beginning to step into the market.
The Morning Star pattern becomes more reliable when the third bullish candle closes strongly away from the lower Bollinger Band. This indicates rejection of lower prices and increases the probability of a bullish reversal.
However, traders should avoid taking every Morning Star signal that forms near the Bollinger Bands. Market context remains extremely important. The best setups usually occur when the pattern aligns with:
- A strong support level
- A demand zone
- A liquidity sweep
- Higher time frame bullish structure
- Increasing bullish momentum
Look the chart example below :
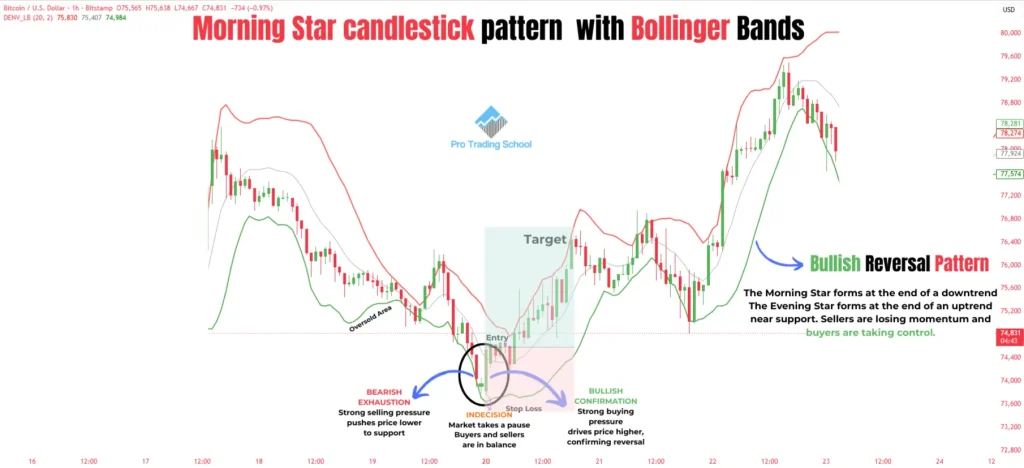
As shown in the chart example, the market declines aggressively and touches the lower Bollinger Band.
After the oversold move, a Morning Star pattern forms near the lower band, signaling exhaustion from sellers and a possible bullish reversal.
Traders can enter the trade at the close of the third bullish candle, place the stop-loss below the Morning Star setup, and target the next resistance level or the middle Bollinger Band as a first profit target.
One important advantage of this strategy is that it helps traders avoid chasing the market after extended bearish moves. Instead, traders wait patiently for confirmation that selling pressure is weakening before entering a trade.
What Time Frame Is Best for the Morning Star Pattern?
The Morning Star candlestick pattern works on all time frames, which makes it a versatile trading pattern for both day traders and swing traders.
Day traders often use the Morning Star pattern on lower time frames such as the 5-minute chart or the 15-minute chart to identify short-term bullish reversal opportunities and entry signals.
Swing traders, on the other hand, commonly use the pattern on higher time frames such as the 4-hour chart or the daily chart to identify larger market reversals and potential trend continuation setups.
However, the most important factor is not the time frame itself, but the overall market analysis and trading context. Like all candlestick patterns, the Morning Star has limitations and does not work equally well in every market condition.
For example, the Morning Star pattern tends to perform poorly in choppy or sideways markets where price action lacks clear direction.
In contrast, the pattern becomes more reliable in trending markets, especially when it forms at key support levels, demand zones, moving averages, or after a liquidity sweep.
To improve the accuracy of the Morning Star pattern, traders often combine it with other technical analysis tools and confirmation techniques.
Pros and Cons of the Morning Star Candlestick Pattern
In this section, we will cover the most important advantages and disadvantages of the Morning Star candlestick pattern.
Understanding the pros and cons of this pattern will help you recognize its strengths, limitations, and the market conditions where it performs best.
| Pros of the Morning Star Pattern | Cons of the Morning Star Pattern |
| Provides an early signal of a potential bullish trend reversal | Can produce false signals in choppy or sideways markets |
| Easy to identify on price charts across different markets and time frames | The pattern alone is not enough without market context and confirmation |
| Works well with support and resistance levels | Weak patterns with small bullish confirmation candles are less reliable |
| Can be combined with technical indicators such as moving averages and Bollinger Bands | News events and high volatility can invalidate the setup quickly |
| Offers clear entry, stop-loss, and take-profit levels | Risk-to-reward ratio may become poor if the stop-loss is too large |
| Effective in both reversal and bullish continuation setups | Beginners may confuse it with similar candlestick patterns |
| Reflects market psychology and the shift from sellers to buyers | Does not guarantee a trend reversal even when perfectly formed |
| Can be used by day traders, swing traders, and position traders | Requires patience and discipline to wait for confirmation |
| Works well in trending markets with strong momentum | Less effective during low-volume market conditions |
| Helps traders identify exhaustion in bearish moves | Some setups fail when traded against the higher time frame trend |
Conclusion
The Morning Star candlestick pattern is one of the most popular bullish reversal patterns in technical analysis.
It reflects a gradual shift in momentum where sellers begin losing control and buyers start taking over the market.
What makes the Morning Star powerful is the psychology behind the pattern. The market moves from strong bearish pressure, to hesitation and indecision, and finally to bullish momentum.
This transition can provide valuable clues about a possible trend reversal, especially when the pattern forms at important support levels or after an extended downtrend.
However, no candlestick pattern is perfect. The Morning Star works best when combined with proper market analysis, trend structure, and other technical confirmation tools.
Traders should focus on quality setups, manage risk carefully, and avoid trading the pattern blindly in poor market conditions.
Frequently Asked Questions About the Morning Star Candlestick Pattern
How to Confirm a Morning Star Signal?
A Morning Star signal becomes more reliable when it forms at an important support level, demand zone, or after a strong downtrend.
Traders also look for confirmation from other technical analysis tools such as volume, moving averages, trendlines, or momentum indicators. A strong bullish third candle is especially important because it shows that buyers are taking control of the market.
What Does the Morning Star Mean in Trading?
In trading, the Morning Star candlestick pattern represents a possible shift in momentum from sellers to buyers.
It reflects a transition where bearish pressure starts weakening and bullish momentum begins to appear. Traders often use the pattern to identify potential bullish reversals after a downtrend.
Is the Morning Star Bullish or Bearish?
The Morning Star is a bullish candlestick pattern. It usually forms after a bearish trend and signals a potential reversal to the upside. The pattern suggests that sellers are losing control of the market while buyers are becoming stronger.
Is the Morning Star Good for Day Trading?
Yes, the Morning Star pattern can be used for day trading, especially on lower time frames such as the 5-minute and 15-minute charts.
However, traders should avoid using the pattern alone. The best day trading setups usually occur when the Morning Star forms near key support levels or aligns with the overall market trend.
What Are the Three Candlesticks of a Morning Star?
The Morning Star pattern consists of three candles:
- The first candle is a strong bearish candle that confirms selling pressure.
- The second candle is a small candle or a Doji that reflects market indecision.
- The third candle is a strong bullish candle that confirms buyers are taking control of the market.
How Reliable Is the Morning Star Pattern?
The Morning Star can be a reliable bullish reversal pattern when traded in the right market conditions.
It tends to perform better in trending markets and when combined with support levels, volume confirmation, or other technical analysis tools.
However, like all trading patterns, it can still produce false signals, especially in choppy or sideways markets.










Hy I am abdisa from ethiopia
Your materials are very educative I’m learning a lot