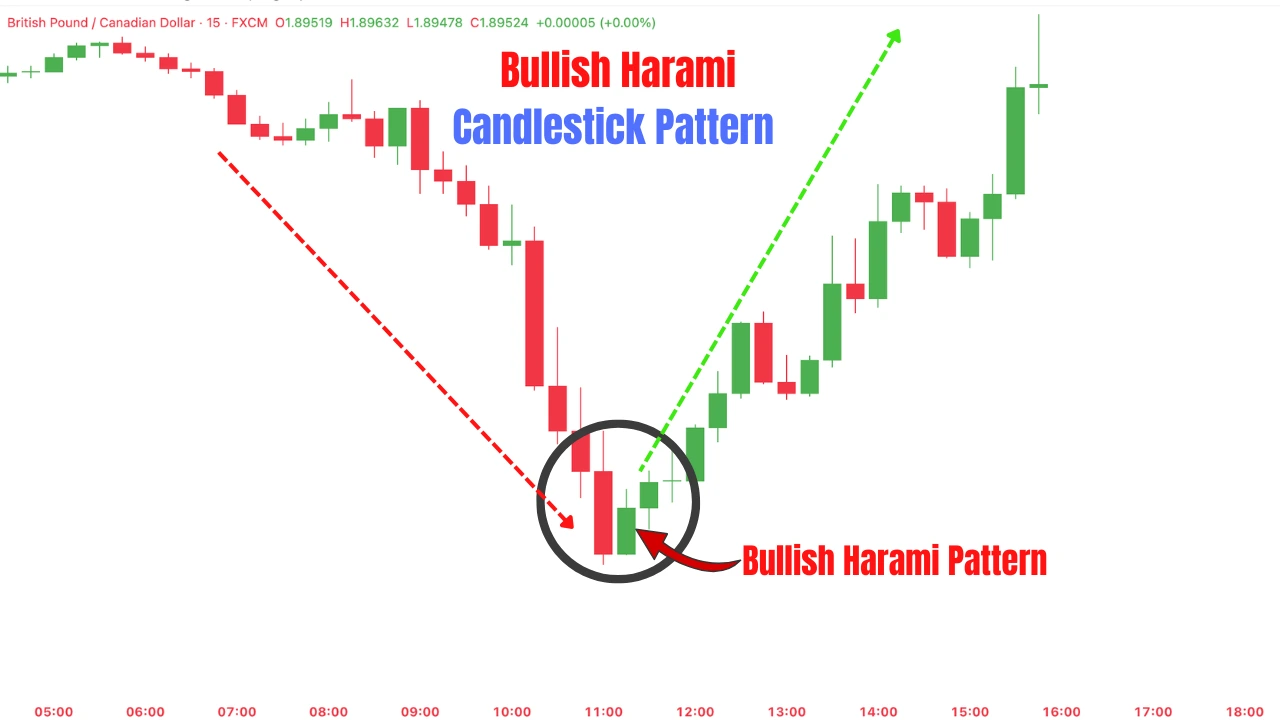
The Bullish Harami Candlestick Pattern is a bullish reversal pattern consisting of two candlesticks that forms after a downtrend.
It indicates that selling pressure is weakening and a potential market bottom is forming. A breakout above the Bullish Harami Candlestick Pattern confirms the reversal and signals a possible transition from a downtrend to a new uptrend.
Bullish Harami Pattern Example
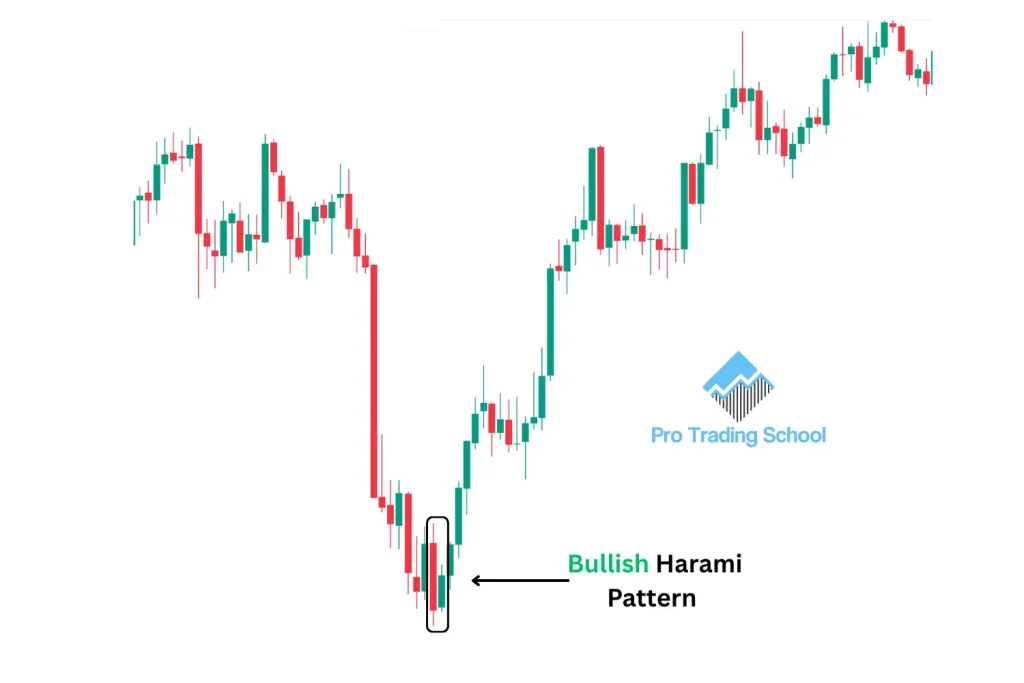
The Bullish Harami Candlestick Pattern is a two-candlestick bullish reversal pattern. The first candlestick is known as the mother bar, while the second, smaller candlestick is called the baby bar.
To form a valid Bullish Harami Pattern, the body of the second candlestick must be completely contained within the body of the first candlestick.
As shown in the chart example above, the market was in a clear downtrend, indicating that sellers were in full control.
A Bullish Harami Candlestick Pattern then formed, signaling that bearish momentum was beginning to weaken. The first candlestick (the mother bar) is a large bearish candle, followed by a smaller bullish candle (the baby bar) that forms entirely within the body of the mother bar.
Although the pattern suggests that selling pressure is fading, traders should wait for a bullish breakout above the high of the Bullish Harami Pattern before entering a long trade.
This breakout acts as confirmation that buyers have taken control and that the market is more likely to reverse into a new uptrend.
Bullish Harami Pattern Anatomy
Understanding the Bullish Harami Candlestick Pattern is essential because recognizing its structure correctly will help you avoid confusing it with other candlestick patterns and reduce costly trading mistakes.
Take a look at the chart example below.
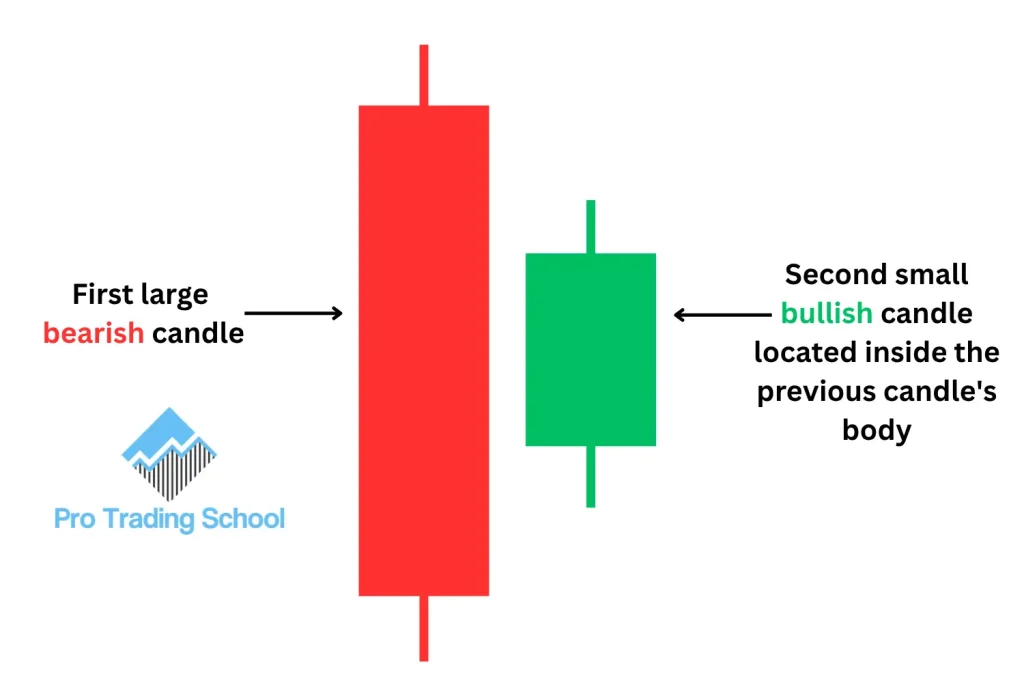
As you can see, the first candlestick is a large bearish candle known as the mother candle. The second candlestick is a smaller bullish candle, often called the baby candle, and its entire body must be contained within the body of the mother candle.
This is the defining characteristic of a valid Bullish Harami Pattern. If the body of the second candle extends outside the body of the mother candle, or if it closes above the mother candle’s body, the formation is not a Bullish Harami Candlestick Pattern.
When identifying this pattern, always focus on the relationship between the two candlesticks. The size of the mother candle and the position of the baby candle are the key elements that distinguish the Bullish Harami Pattern from other bullish reversal candlestick patterns.
Want to learn the bearish counterpart? Read our Bearish Harami Candlestick Pattern guide to discover how this reversal pattern signals weakening buying pressure and potential downtrends.
Want to learn the bearish counterpart? Read our Bearish Harami Candlestick Pattern guide to discover how this reversal pattern signals weakening buying pressure and potential downtrends.
Bullish Harami Pattern Psychology
Understanding the psychology behind the Bullish Harami Candlestick Pattern is essential if you want to trade it successfully.
Rather than memorizing its appearance, you should understand what is happening between buyers and sellers as the pattern develops.
Take a look at the chart example below.
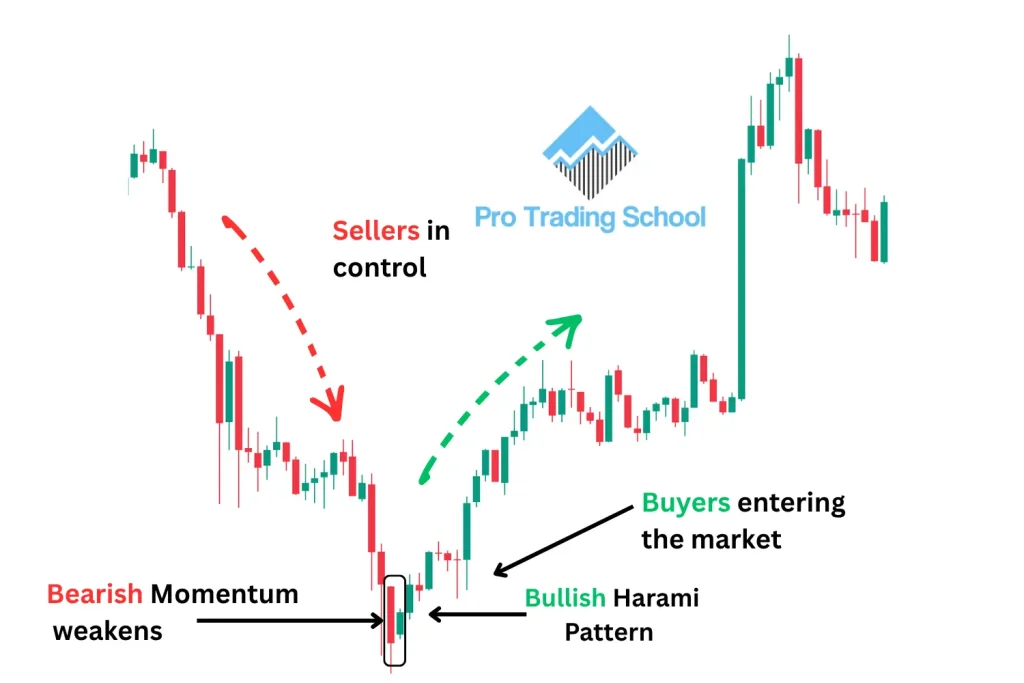
As you can see, the market is in a clear downtrend, which tells us that sellers are firmly in control and continue to push prices lower.
When the Bullish Harami Pattern forms, it signals a temporary pause in the bearish momentum and growing indecision between buyers and sellers.
The first candlestick, known as the mother candle, is a large bearish candle that confirms sellers are still dominating the market.
The second candlestick is a much smaller bullish candle that forms completely inside the body of the mother candle, indicating that selling pressure is beginning to weaken and buyers are starting to fight back.
You can think of the mother candle as a temporary trading range. The open of the mother candle acts as resistance, while its close acts as support.
The second candlestick, often referred to as the inside bar or baby candle, remains trapped within this range, showing that neither buyers nor sellers have gained full control.
When a Bullish Harami Candlestick Pattern forms at a major support level, inside a demand zone, or after a liquidity sweep, it becomes a much stronger bullish reversal signal.
These confluence factors suggest that sellers are losing momentum while buyers are preparing to take control of the market.
The final confirmation comes when the price breaks above the high of the mother candle. This breakout shows that buyers have overcome the temporary consolidation, confirming the Bullish Harami Pattern and increasing the probability of a strong move to the upside.
Want to learn more? Check out our 33 Candlestick Patterns Cheat Sheet (Simple Visual Guide) to discover the most important bullish and bearish candlestick patterns every trader should know.
Bullish Harami Pattern at a Support Level Strategy
One of the highest-probability ways to trade the Bullish Harami Candlestick Pattern is to combine it with a well-established support level.
While the pattern can appear anywhere on a chart, it becomes significantly more reliable when it forms at an important area where buyers have previously entered the market.
Take a look at the chart example below.
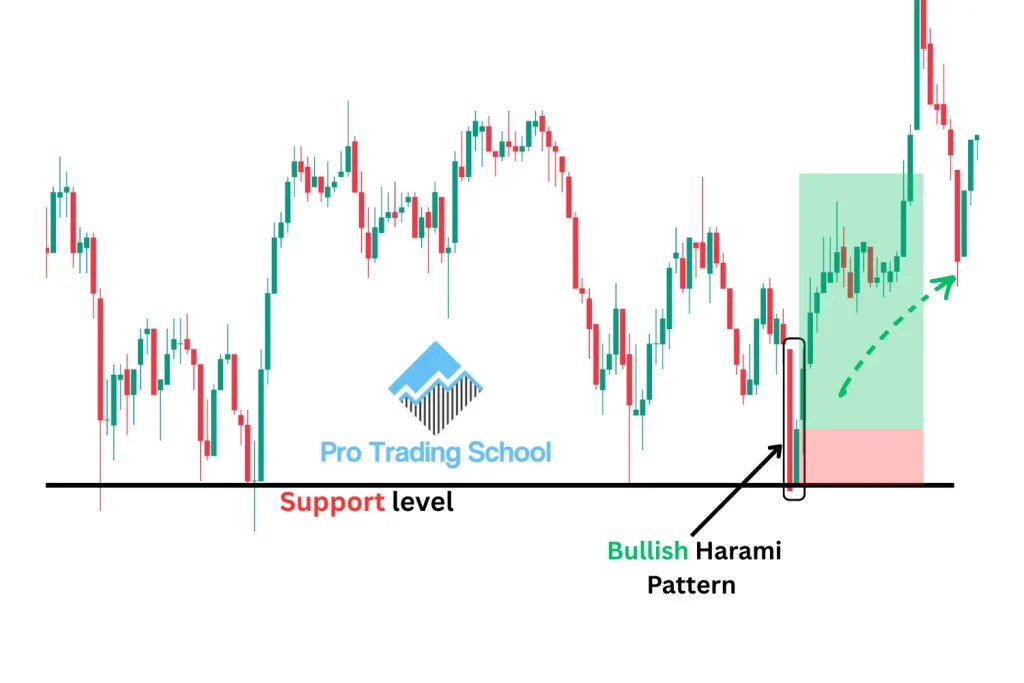
As you can see, the market was in a clear downtrend before reaching a price level where buyers stepped in and reversed the decline.
This created a key support level, an area where demand proved strong enough to stop the selling pressure.
Later, the market retraced back to retest this support level. Instead of breaking below it, a Bullish Harami Candlestick Pattern formed.
The first candlestick is a large bearish mother candle, followed by a smaller bullish inside bar whose body is completely contained within the mother candle.
This formation signals that bearish momentum is fading and that buyers are beginning to challenge the sellers.
Why Does This Strategy Work?
A support level represents an area where buyers have previously overwhelmed sellers and pushed the market higher. Because of this, both institutional and retail traders often monitor these levels closely for new buying opportunities.
When the price revisits a key support level, buyers frequently step in to defend it. If a Bullish Harami Pattern develops at the same location, it provides additional evidence that selling pressure is weakening and that demand is returning to the market.
The pattern itself reflects a shift in market sentiment. The large bearish mother candle shows that sellers initially remained in control, but the smaller bullish inside bar reveals that the downward momentum has stalled.
Once the price breaks above the high of the Bullish Harami Candlestick Pattern, buyers confirm their strength and increase the probability of a bullish reversal.
Entry, Stop Loss and Profit Target
There are two common ways to enter this setup:
- Aggressive Entry: Enter a long position at the close of the bullish inside bar, anticipating a breakout.
- Conservative Entry: Wait for the price to break above the high of the Bullish Harami Candlestick Pattern before entering the trade. This provides additional confirmation that buyers have taken control.
For risk management, place your stop loss below the low of the Bullish Harami Pattern or slightly below the support level.
Your profit target can be the next significant resistance level or any predefined risk-to-reward ratio that fits your trading plan.
As shown in the chart example, once the breakout occurred, buyers regained control and the market continued higher, validating the bullish reversal.
Although this is a simple and highly effective trading strategy, it should never be used in isolation.
Always perform a top-down analysis, identify the overall market trend, and ensure that the support level aligns with the higher-timeframe structure.
Trading the Bullish Harami Candlestick Pattern in the direction of the dominant trend on higher timeframes will significantly improve the quality of your setups and increase your long-term consistency.
Bullish Harami Pattern with a Moving Average Strategy
The Bullish Harami Candlestick Pattern is commonly known as a bullish reversal pattern. However, it can also be used as a trend continuation pattern when combined with a moving average.
In this strategy, we use the 50-period Simple Moving Average (SMA) as a dynamic support level and the Bullish Harami Pattern as a signal that the pullback is ending and the primary uptrend is ready to resume.
Take a look at the chart example below.
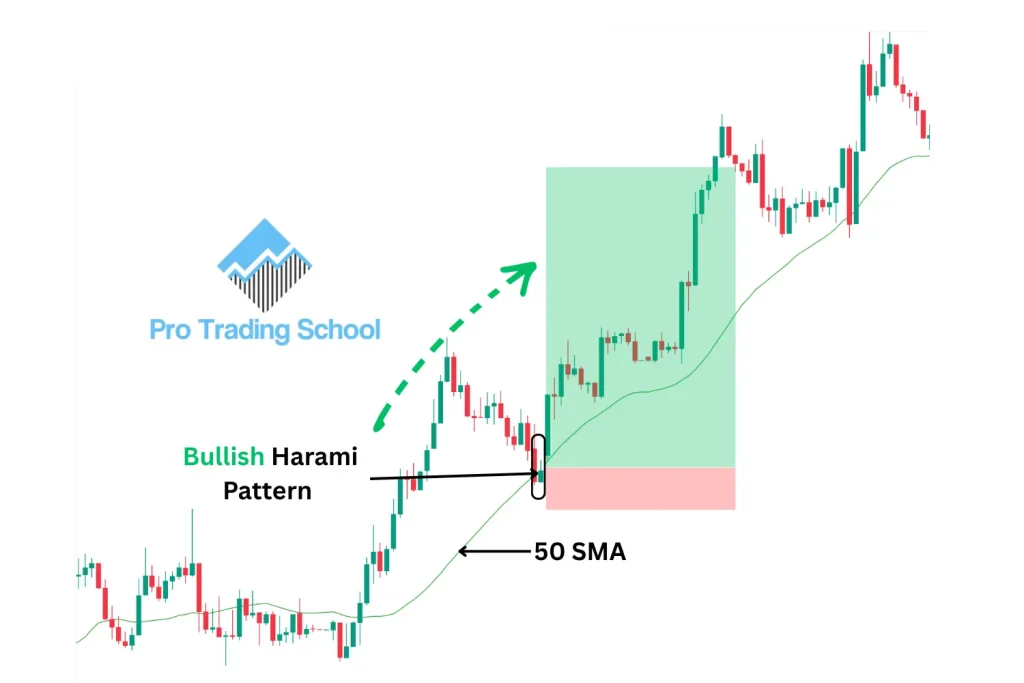
As you can see, the market is in a strong uptrend, indicating that buyers are in control. Throughout the trend, the 50-period Simple Moving Average acts as a dynamic support level, repeatedly attracting buyers whenever the price retraces.
When the market pulls back to the 50 SMA, a Bullish Harami Candlestick Pattern forms. The large bearish mother candle shows that sellers temporarily gained control during the retracement.
However, the smaller bullish inside candle reveals that selling pressure is fading and buyers are beginning to regain strength.
This shift in momentum suggests that the corrective move is coming to an end and that the market is preparing for another impulsive move in the direction of the prevailing uptrend.
Entry, Stop Loss and Profit Target
There are two common ways to trade this setup:
- Aggressive Entry: Enter a long position at the close of the second (inside) candle, anticipating that the uptrend will resume.
- Conservative Entry: Wait for the price to break above the high of the mother candle before entering the trade. This provides additional confirmation that buyers have regained control.
Place your stop loss below the low of the Bullish Harami Pattern or below the recent swing low.
Your profit target can be the next key resistance level or any predetermined risk-to-reward ratio that fits your trading plan.
As shown in the example, the market resumes its uptrend after the breakout, demonstrating that the Bullish Harami Pattern can be a powerful trend continuation signal when it forms during a healthy pullback within an established bullish trend.
Best Practices
To improve the probability of success, keep the following guidelines in mind:
- Trade in the direction of the higher-timeframe trend. The Bullish Harami Pattern performs best when it aligns with the dominant market direction.
- Use the strategy on any market and timeframe. It can be applied to Forex, stocks, indices, commodities, cryptocurrencies, and futures, as well as on scalping, day trading, swing trading, or position trading timeframes.
- Always apply proper risk management. Never risk more than a predetermined percentage of your trading capital on a single trade, and maintain a favorable risk-to-reward ratio.
- Look for additional confluence. The setup becomes much stronger when the Bullish Harami Pattern aligns with other technical factors such as major support levels, trendlines, demand zones, Fibonacci retracements, volume analysis, or momentum indicators. Multiple confirmations increase the probability of a successful trade while helping filter out low-quality setups.
By combining the 50-period Simple Moving Average with the Bullish Harami Candlestick Pattern, traders can identify high-probability continuation setups and participate in established trends with clearly defined entry, stop-loss, and profit target levels.
Bullish Harami Pattern at a Demand Zone Strategy
One of the most effective ways to trade the Bullish Harami Candlestick Pattern is to combine it with a demand zone.
This strategy is designed to follow institutional order flow by using demand zones to identify high-probability buying areas and the Bullish Harami Pattern as a precise entry trigger.
Take a look at the chart example below.
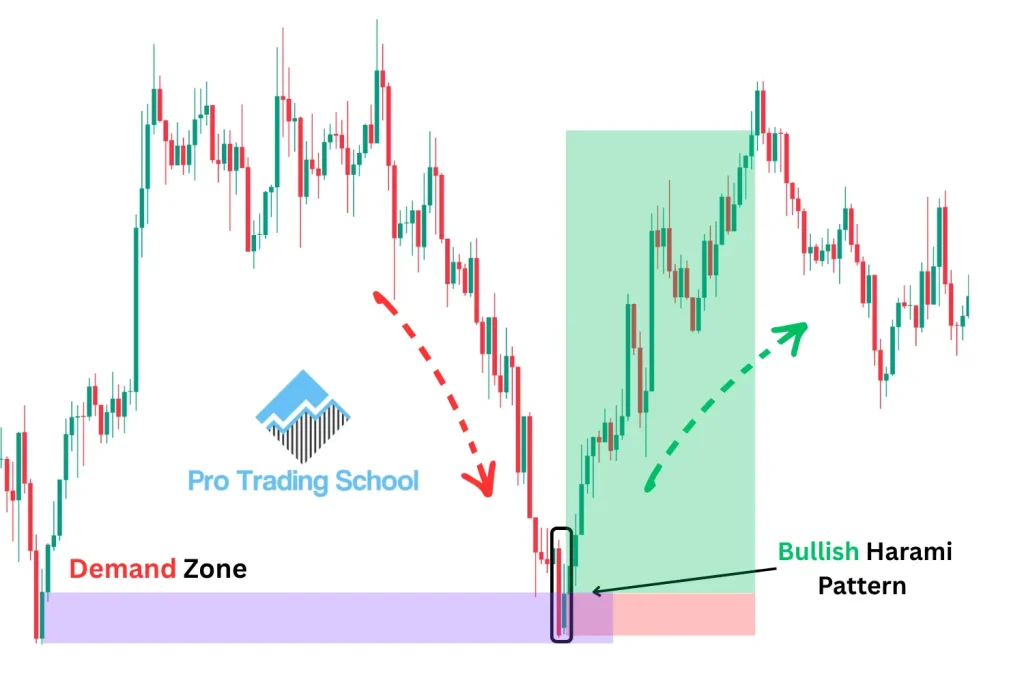
As you can see, the market was in a clear downtrend before reaching a price level where it reversed sharply to the upside.
Such strong impulsive moves are often associated with significant buying activity from institutional traders, such as banks, hedge funds, and other large market participants.
The area where this strong bullish move originated is known as a demand zone. These zones represent areas where buying demand previously exceeded selling pressure, causing the market to rally aggressively.
Unlike retail traders, institutional traders rarely execute their entire position with a single order. Instead, they typically accumulate positions gradually over time.
As a result, when the market retraces back to a previously established demand zone, there is often a higher probability that institutional buyers will defend the area by adding to their positions.
This is where the Bullish Harami Candlestick Pattern becomes valuable.
Rather than buying immediately when the price reaches the demand zone, we wait for price action to confirm that buyers are stepping back into the market.
When a Bullish Harami Pattern forms inside the demand zone, it provides additional evidence that selling pressure is weakening and that buyers are beginning to regain control.
Entry, Stop Loss and Profit Target
As shown in the chart example, the market retraces back into the demand zone before forming a Bullish Harami Candlestick Pattern. This pattern becomes our confirmation signal to look for a long trade.
There are two common entry techniques:
- Aggressive Entry: Enter at the close of the bullish inside candle.
- Conservative Entry: Wait for the price to break above the high of the mother candle before entering the trade.
Place your stop loss below the low of the Bullish Harami Pattern or slightly below the demand zone to allow the trade enough room to develop. Your profit target can be set at the next major resistance level or based on your preferred risk-to-reward ratio.
As illustrated in the example, buyers defended the demand zone, the Bullish Harami Pattern confirmed the shift in momentum, and the market continued higher as expected.
Risk Management
Although this strategy can produce high-probability trading opportunities, it is not a holy grail. No trading strategy has a 100% win rate, and losing trades are an unavoidable part of trading.
For this reason, proper risk management is just as important as finding a good entry. Always define your risk before entering a trade, place your stop loss at a logical technical level, and never risk more than a small percentage of your trading capital on a single position.
Consistent profitability comes from combining a proven trading strategy with disciplined money management, not from trying to avoid losing trades altogether.
Bullish Harami Pattern Pros and Cons
Like every candlestick pattern, the Bullish Harami Candlestick Pattern has both strengths and limitations.
Understanding its advantages and disadvantages will help you know when to trust the pattern and when to wait for additional confirmation before entering a trade.
| Pros | Cons |
|---|---|
| Easy to identify. The Bullish Harami Pattern has a simple two-candlestick structure, making it suitable for both beginner and experienced traders. | Requires confirmation. The pattern alone does not guarantee a bullish reversal. Waiting for a breakout above the mother candle or additional confirmation is highly recommended. |
| Provides early reversal signals. It can alert traders that selling pressure is weakening before a new uptrend begins. | Can produce false signals. When traded without considering market context, the pattern may fail and continue the downtrend. |
| Works across all financial markets. It can be used on Forex, stocks, cryptocurrencies, commodities, indices, and futures markets. | Less reliable in strong downtrends. A powerful bearish trend can easily invalidate the pattern if buyers fail to take control. |
| Suitable for all timeframes. The pattern can be traded by scalpers, day traders, swing traders, and long-term investors. | Market context is essential. The Bullish Harami Pattern performs much better when it forms at major support, demand zones, or other key technical levels. |
| Offers excellent risk-to-reward opportunities. Because the stop loss is usually placed below the pattern, traders can often achieve attractive reward-to-risk ratios. | Not a standalone trading strategy. It should be combined with trend analysis, support and resistance, moving averages, volume, or other forms of technical confirmation. |
| Works well with other technical tools. It can be combined with moving averages, demand zones, Fibonacci retracements, liquidity sweeps, trendlines, and momentum indicators to improve trade quality. | No pattern is 100% accurate. Like every technical analysis tool, losing trades are inevitable, making proper risk management essential. |
Overall, the Bullish Harami Candlestick Pattern is a powerful price action signal when traded in the right market context.
The highest-probability setups usually occur when the pattern forms at a major support level, inside a demand zone, or during a pullback within an established uptrend.
By combining the pattern with sound technical analysis and disciplined risk management, traders can significantly improve the quality of their trading decisions.
Conclusion
The Bullish Harami Candlestick Pattern is a reliable bullish price action signal when traded in the right market context.
For the best results, combine it with key support levels, demand zones, moving averages, and proper risk management to identify high-probability trading opportunities across all markets and timeframes.
Frequently Asked Questions
How accurate is the Bullish Harami Pattern?
The Bullish Harami Candlestick Pattern is considered a reliable bullish reversal signal when traded in the right market context.
Its accuracy increases significantly when it forms at key support levels, demand zones, or during pullbacks in an established uptrend.
Like any technical pattern, it should always be confirmed with a breakout above the mother candle and combined with proper risk management.
Is the Bullish Harami Pattern good for day trading?
Yes. The Bullish Harami Pattern works well for day trading, swing trading, and even long-term investing.
It can be traded on lower timeframes such as the 1-minute, 5-minute, and 15-minute charts, as well as higher timeframes like the daily and weekly charts.
Day traders often combine it with support and resistance, moving averages, and volume analysis for better confirmation.
Can Bullish Harami patterns fail?
Yes. No candlestick pattern is 100% accurate, and the Bullish Harami Pattern can produce false signals.
The probability of failure is higher when the pattern forms in the middle of a strong downtrend or without any supporting technical factors.
Using confirmation, trading with the trend, and applying proper stop-loss placement can help reduce losing trades.
What is the best strategy for trading a Bullish Harami Pattern?
The best strategy is to trade the Bullish Harami Candlestick Pattern at a key technical level, such as a major support level, demand zone, or the 50-period Simple Moving Average in an uptrend.
Waiting for a breakout above the mother candle and combining the pattern with other forms of technical analysis greatly improves the probability of a successful trade.









Thanks for your giving us more know about the market. So can I ask you do you have trading Room ???
Hej! Jag vill gärna få tillgång till fusklapparna för candlestick-mönster. Tack för att ni delar dem!