
If you’ve ever wondered what is the difference between bullish engulfing and bearish engulfing, you’re not alone. These two candlestick patterns are among the most powerful signals in trading, but many traders confuse them or use them incorrectly.
At first glance, they may look similar — both are two-candle patterns that show a shift in market momentum. But in reality, they represent completely opposite market conditions and trading opportunities.
Understanding the difference between bullish and bearish engulfing patterns will help you read price action more accurately, avoid common mistakes, and take better trading decisions with confidence.
In this guide, you’ll clearly learn how they differ, where they appear on the chart, and how to use each one effectively in your trading strategy.
What Is the Difference Between Bullish Engulfing and Bearish Engulfing?
What Is a Bullish Engulfing Pattern?
A bullish engulfing pattern is a two-candlestick pattern that forms on a price chart. The first candle is bearish (red), and the second candle is bullish (green).

For the pattern to be valid, the body of the second candle must completely engulf the body of the first bearish candle — meaning it opens lower and closes higher than the previous candle.
This pattern signals that buyers have overpowered sellers, absorbing all the selling pressure and pushing the price upward with strong momentum.
In terms of context, the bullish engulfing pattern can play two roles:
- Reversal signal — when it appears at the bottom of a downtrend, it suggests the selling pressure is exhausted and bulls are taking control.
- Continuation signal — when it forms during a pullback in an existing uptrend, it confirms that buyers are still dominant and the upward move is likely to resume.
If you want to master this setup in detail, check out this complete guide on the bullish engulfing candlestick pattern.
What Is a Bearish Engulfing Pattern?
A bearish engulfing pattern is the mirror image of the bullish engulfing pattern — and just as powerful.
It is also a two-candlestick pattern where the first candle is bullish (green) and the second candle is bearish (red).
The body of the second candle must fully engulf the body of the first candle, opening higher and closing lower than the previous candle.

This pattern signals that sellers have taken control from buyers, overwhelming the buying pressure and driving the price downward.
Just like its bullish counterpart, the bearish engulfing pattern serves two purposes depending on market context:
- Reversal signal — when it appears at the top of an uptrend, it warns that buying momentum is fading and bears are stepping in.
- Continuation signal — when it forms during a retracement in an existing downtrend, it confirms that sellers are still in control and the downward move is likely to continue.
If you want to go deeper into this setup, check out this complete bearish engulfing candlestick pattern strategy and examples guide.
Key Differences Between Bullish and Bearish Engulfing Patterns
While both patterns share the same two-candlestick structure, they carry opposite meanings and appear in completely different market conditions.
Understanding these differences is what separates traders who use engulfing patterns profitably from those who misread them.
1. Direction of the Signal

The most fundamental difference lies in what each pattern predicts. The bullish engulfing pattern delivers an upward signal, suggesting that price is likely to move higher.
The bearish engulfing pattern, on the other hand, delivers a downward signal, warning that price is likely to drop.
2. Candle Color and Order
Each pattern has a distinct candlestick sequence:
- Bullish engulfing — starts with a red (bearish) candle, followed by a larger green (bullish) candle that fully engulfs the first.
- Bearish engulfing — starts with a green (bullish) candle, followed by a larger red (bearish) candle that fully engulfs the first.
If you want to see how this pattern looks in real market conditions, check out these 12 bearish engulfing pattern examples (real chart).
3. Location on the Chart

Where the pattern forms is just as important as the pattern itself:
- The bullish engulfing pattern appears at the bottom of a downtrend, signaling a potential reversal to the upside.
- The bearish engulfing pattern appears at the top of an uptrend, signaling a potential reversal to the downside.
4. Market Psychology

Behind every candlestick pattern is a battle between buyers and sellers:
- The bullish engulfing pattern reveals that buyers have seized control from sellers, flooding the market with buying pressure strong enough to completely erase the previous bearish move.
- The bearish engulfing pattern reveals that sellers have overpowered buyers, driving the price down with enough force to fully swallow the previous bullish candle.
How to Identify a Bullish Engulfing Pattern

Step 1 — Check the Existing Trend
The first thing you need to do before anything else is identify the direction of the market. This step alone will tell you whether you are looking for a continuation or a reversal signal.
- If the market is in an uptrend — wait for the price to break above a resistance level, which then becomes a support level. When the price retraces back to that support level and a bullish engulfing pattern forms there, this is a trend continuation signal — meaning the uptrend is likely to resume.
- If the market is in a downtrend — wait for the price to reach a strong support level at the bottom of the trend. When a bullish engulfing pattern forms at that level, this is a reversal signal — meaning buyers are stepping in and the downtrend may be coming to an end.
Step 2 — Analyze the Candle Anatomy
Once you have identified the context, focus on the structure of the two candles:
- The first candle must be red (bearish), reflecting the existing selling pressure
- The second candle must be green (bullish), showing that buyers have taken over
- The second candle must be visibly larger than the first — a small second candle is a weak signal
- The body of the second candle must completely engulf the body of the first red candle — wicks do not count, only the bodies matter
Step 3 — Confirm With Volume
The final step is to check the trading volume on the second candle. A valid bullish engulfing pattern should come with a noticeable spike in volume, confirming that there is real buying pressure behind the move — not just a random price fluctuation. If the volume is low, treat the pattern with caution and wait for further confirmation.
If you want to see how this pattern looks in real market conditions, check out these 8 powerful bullish engulfing pattern chart examples.
How to Identify a Bearish Engulfing Pattern
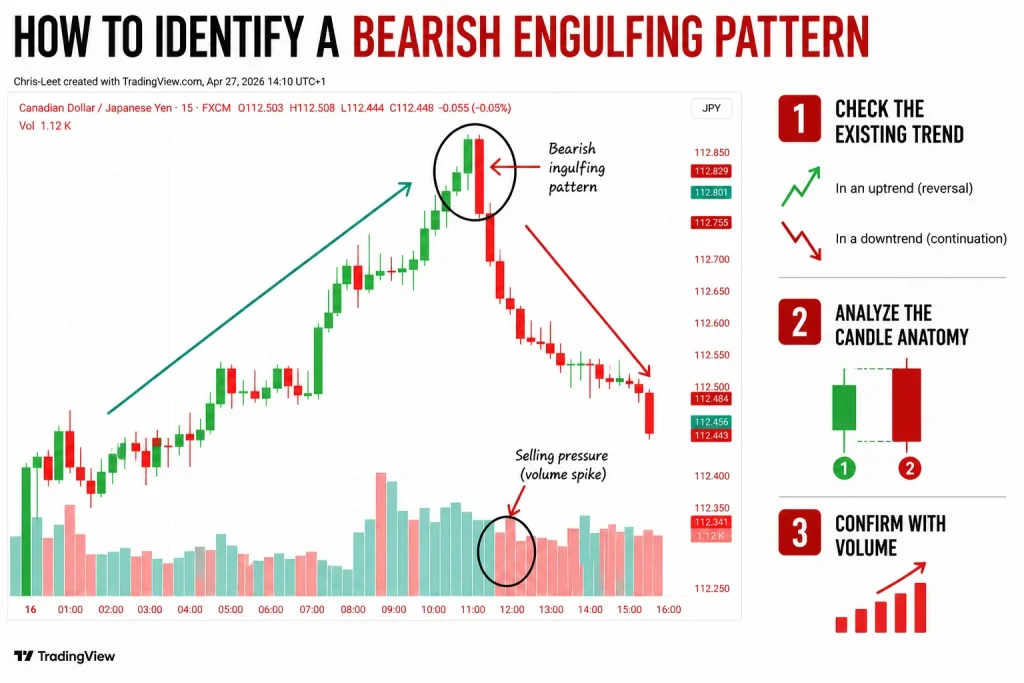
Step 1 — Check the Existing Trend
Just like with the bullish engulfing pattern, the first step is always to identify the direction of the market before anything else.
- If the market is in an uptrend — wait for the price to reach a strong resistance level at the top of the trend. When a bearish engulfing pattern forms at that level, this is a reversal signal — indicating that sellers are stepping in and the uptrend may be losing momentum and coming to an end.
- If the market is in a downtrend — wait for the price to break below a support level, which then becomes a resistance level. When the price retraces back to that resistance level and a bearish engulfing pattern forms there, this is a trend continuation signal — confirming that sellers are still in control and the downtrend is likely to continue.
Step 2 — Analyze the Candle Anatomy
Once the market context is clear, shift your focus to the structure of the two candles:
- The first candle must be green (bullish), reflecting the existing buying pressure
- The second candle must be red (bearish), showing that sellers have taken over
- The second candle must be noticeably larger than the first — a weak second candle means weak selling pressure
- The body of the second red candle must completely engulf the body of the first green candle — remember, only bodies matter, not wicks
Step 3 — Confirm With Volume
Always finish your analysis by checking the trading volume on the second candle. A genuine bearish engulfing pattern should be accompanied by a clear spike in volume, proving that there is real selling pressure driving the move.
A bearish engulfing pattern that forms on low volume is unreliable and should not be traded without additional confirmation.
What Do These Patterns Signal to Traders?

The Bullish Engulfing Pattern
The bullish engulfing pattern signals that buyers have taken control from sellers. When it forms after a retracement in an uptrend, it marks the end of the pullback and the beginning of a new move upwards — buyers see the lower price as a favorable opportunity to re-enter the market.
When it appears at the bottom of a downtrend near a support level, it signals that sellers are exhausted and buyers are strong enough to reverse the trend.
The Bearish Engulfing Pattern
The bearish engulfing pattern signals that sellers have taken control from buyers. When it forms after a retracement in a downtrend, it marks the end of the pullback and the beginning of a new move downwards — sellers see the higher price as a favorable opportunity to re-enter the market.
When it appears at the top of an uptrend near a resistance level, it signals that buyers are exhausted and sellers are strong enough to reverse the trend.
To understand how reliable this signal really is, learn how strong a bearish engulfing pattern can be in different market conditions.
How to Trade Bullish and Bearish Engulfing Patterns


The two charts above illustrate real trade setups — the first showing a bullish engulfing pattern with a clear entry, stop-loss and target, and the second showing the same for a bearish engulfing pattern.
Step 1 — Identify the Trend and Key Level
Before placing any trade, make sure you have clearly identified the market trend and a key level where the pattern is forming — whether that is a support level for bullish setups or a resistance level for bearish setups. A pattern that forms without these two conditions is not worth trading.
Step 2 — Wait for the Pattern to Fully Form
This is where patience becomes your most valuable trading skill. Never enter a trade before the second candle fully closes. An engulfing pattern is only valid once the second candle has completely formed — entering too early based on an unfinished candle is one of the most common and costly mistakes traders make.
Step 3 — Entry Point
Once the second candle has closed and the pattern is confirmed, you can enter the trade:
- Bullish engulfing — enter at the close of the second green candle
- Bearish engulfing — enter at the close of the second red candle
Step 4 — Place Your Stop-Loss
Protecting your capital is just as important as finding a good entry. Here is where to place your stop-loss:
- Bullish engulfing — place your stop-loss below the low of the engulfing candle
- Bearish engulfing — place your stop-loss above the high of the engulfing candle
This gives your trade enough room to breathe while keeping your risk clearly defined.
Step 5 — Set Your Profit Target
- Bullish trades — set your target at the next resistance level above the entry
- Bearish trades — set your target at the next support level below the entry
Always make sure the trade offers a minimum 1:2 risk to reward ratio before entering — meaning for every $1 you risk, you are targeting at least $2 in profit. If the ratio is not there, skip the trade.
Step 6 — Add Extra Confirmation
Before pulling the trigger, strengthen your confidence in the setup with these additional tools:
- Volume — make sure the second candle is backed by a noticeable spike in volume
- Higher timeframe analysis — always check a higher timeframe to make sure the trade aligns with the bigger picture trend. A bullish engulfing on the 1-hour chart is far more powerful when the daily chart is also bullish.
If you want to increase your accuracy, learn how to confirm a bullish engulfing candle using these proven rules.
Common Mistakes Traders Make With Engulfing Patterns

Mistake #1 — Treating Engulfing Patterns as a Holy Grail
One of the most dangerous mindsets a trader can have is believing that every engulfing pattern will work. Engulfing patterns are powerful trading signals — but they are not a holy grail.
Even the most perfectly formed pattern, appearing at the right level with volume confirmation, can still fail. The market is unpredictable by nature and no pattern wins 100% of the time.
The solution is simple — always place a stop-loss on every single trade, no exceptions. Your stop-loss is not a sign of doubt, it is your safety net. It protects your capital when the market moves against you so that one losing trade does not wipe out multiple winning ones.
To improve your accuracy, learn what confirms a bearish engulfing pattern before entering any trade.
Mistake #2 — Not Respecting Your Profit Target
This is arguably the most costly mistake traders make — and it is driven entirely by emotions. The trade goes in your favor, the price is moving towards your target, and then it starts to pull back slightly.
Fear kicks in, you panic, and you close the trade early — only to watch the price continue to your original target without you.
Closing a trade early before the target is hit does not just cost you profits — it destroys your money management strategy.
If your system is built on a 1:2 risk to reward ratio, closing early turns that ratio into 1:1 or worse, making your strategy unprofitable in the long run.
The solution is to practice the “set and forget” approach — once you have defined your entry, stop-loss and target, let the trade play out. Remove emotions from the equation and trust your analysis.
Mistake #3 — Taking Trades With a Poor Risk to Reward Ratio
Many traders spot what looks like a perfect engulfing pattern setup and jump straight into the trade out of excitement — without stopping to calculate whether the trade actually offers a favorable risk to reward ratio. This is a critical mistake that even experienced traders fall into.
Here is the truth — the risk to reward ratio is more important than the setup itself. A perfect engulfing pattern that only offers a 1:1 risk to reward ratio is not worth taking.
Why? Because even if you win 50% of your trades, you will never get ahead. You need a minimum of a 2:1 reward to risk ratio on every trade — meaning for every $1 you risk, you are targeting at least $2 in profit.
This is what separates consistently profitable traders from those who struggle in the long run. A trader with a decent setup but a strong risk to reward ratio will always outperform a trader with perfect setups but poor ratio management.
Before entering any engulfing pattern trade, always ask yourself — does this trade offer at least 2:1? If the answer is no, walk away and wait for a better opportunity. Patience and discipline always win over excitement.
Bullish vs. Bearish Engulfing: Quick Comparison Table
The table below summarizes everything we have covered in this guide, giving you a quick reference you can come back to whenever you need it:
| Bullish Engulfing | Bearish Engulfing | |
| Signal Direction | Upward | Downward |
| First Candle | Red (Bearish) | Green (Bullish) |
| Second Candle | Green (Bullish) | Red (Bearish) |
| Where it Forms | Bottom of a downtrend / Support level | Top of an uptrend / Resistance level |
| Market Psychology | Buyers overpowered sellers | Sellers overpowered buyers |
| What it Signals | Reversal or continuation to the upside | Reversal or continuation to the downside |
| Entry Point | Close of the second green candle | Close of the second red candle |
| Stop-Loss | Below the low of the engulfing candle | Above the high of the engulfing candle |
| Profit Target | Next resistance level | Next support level |
| Volume Confirmation | Spike in volume on second candle | Spike in volume on second candle |
| Risk to Reward | Minimum 2:1 | Minimum 2:1 |
Conclusion
Bullish and bearish engulfing patterns are two of the most reliable and widely used candlestick patterns in trading.
Understanding the difference between them — and more importantly, knowing how to trade them correctly — can make a significant difference in your trading results.
To summarize:
- Always identify the trend and key level before looking for the pattern
- Wait for the second candle to fully close before entering any trade
- Always use a stop-loss, respect your profit target and never take a trade without a minimum 2:1 risk to reward ratio
- Use volume and higher timeframe analysis as extra confirmation
Remember — no pattern works 100% of the time. What makes a trader consistently profitable is not finding perfect setups, but managing risk and sticking to a disciplined trading plan.










7 thoughts on “What is the difference between bullish engulfing and bearish engulfing?”
Comments are closed.