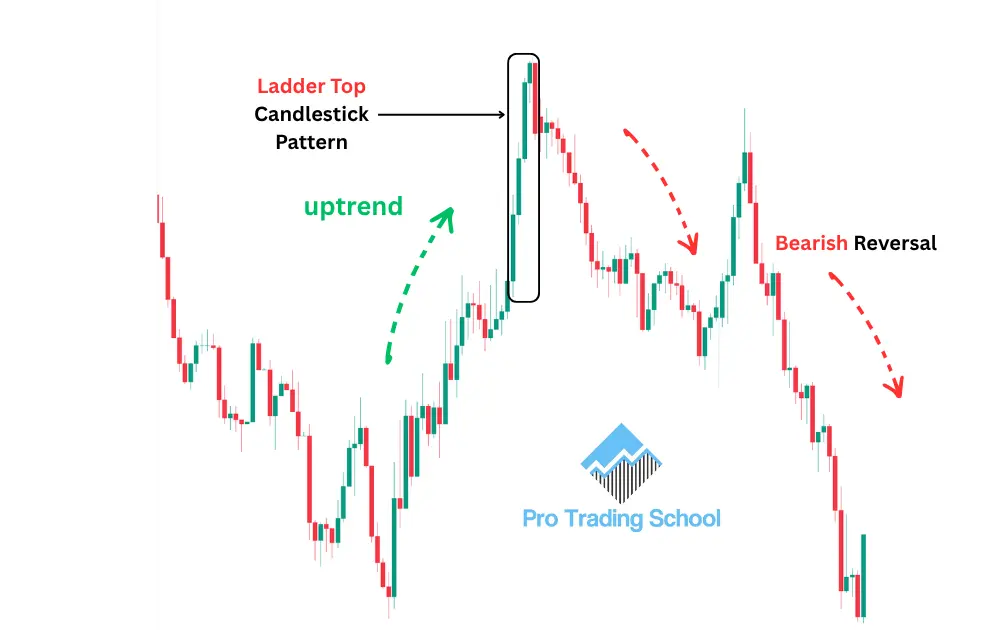
The Ladder Top candlestick pattern is a five-candle bearish reversal pattern that signals a potential shift from an uptrend to a downtrend.
It typically forms after a sustained bullish move and indicates that buying momentum is beginning to weaken.
When the Ladder Top pattern appears near a key resistance level, it suggests that buyers are losing control of the market while sellers are starting to gain strength.
Although the pattern does not guarantee a reversal on its own, it serves as an early warning that bearish pressure may be increasing.
For this reason, traders often combine the Ladder Top candlestick pattern with other technical analysis tools, such as support and resistance levels, trendlines, or momentum indicators, to improve the accuracy of their trading decisions.
Ladder Top Candlestick Pattern Example
The best way to understand the Ladder Top candlestick pattern is to see how it forms on a real price chart. The example below shows a complete Ladder Top pattern developing after a strong bullish trend.
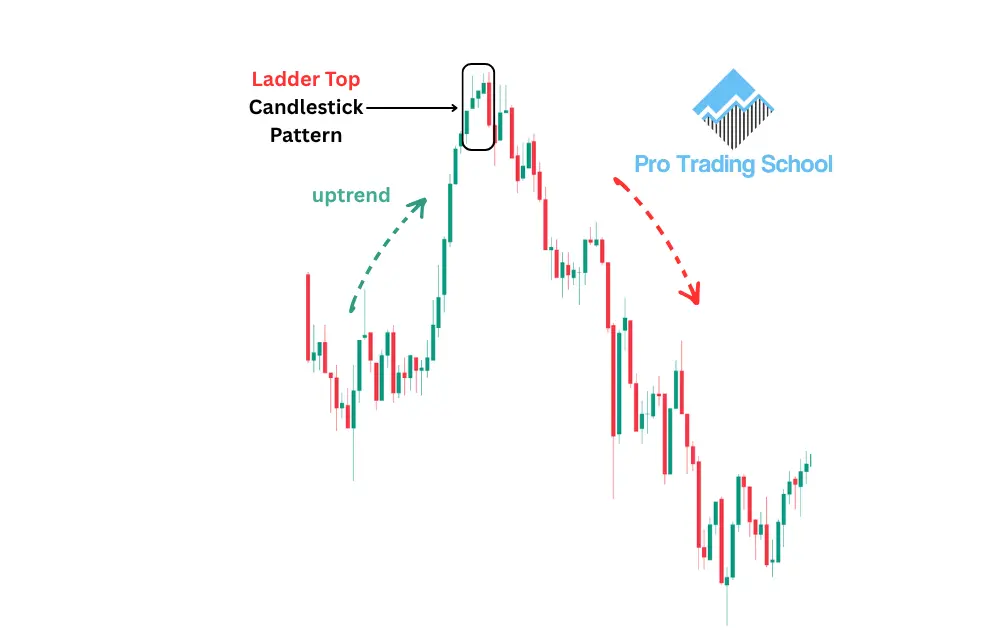
As shown in the chart, the market is initially in a clear uptrend, indicating that buyers are firmly in control. After a sustained bullish move, the Ladder Top candlestick pattern begins to form.
The pattern consists of five candlesticks. The first candle is a strong bullish candle that confirms the existing uptrend. It is followed by three smaller bullish candles, each showing that buying momentum is gradually weakening.
Finally, the fifth candle is a strong bearish candle that signals sellers have stepped in and overwhelmed the buyers.
This transition from strong bullish momentum to increasing selling pressure suggests that the uptrend may be coming to an end.
As a result, the market begins to reverse lower, making the Ladder Top candlestick pattern an important bearish reversal signal for price action traders.
To become more confident at recognizing chart patterns, explore our 33 Candlestick Patterns Cheat Sheet (Simple Visual Guide), where you’ll find visual examples and explanations of the most important candlestick patterns every trader should know.
Ladder Top Candlestick Pattern Psychology
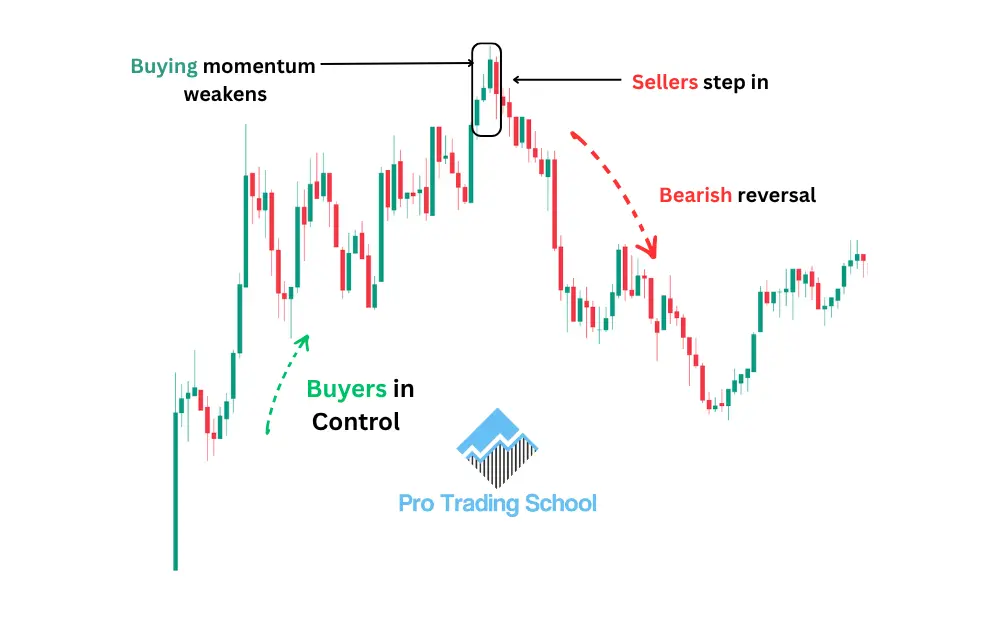
Every candlestick reflects the ongoing battle between buyers and sellers, and the Ladder Top candlestick pattern provides valuable insight into how market sentiment shifts from bullish to bearish.
The pattern begins with a strong bullish candle, confirming that buyers are still in control and the uptrend remains intact.
However, the next three bullish candles become progressively smaller, revealing that buying momentum is fading. Although buyers continue to push prices higher, they are doing so with less conviction, suggesting that sellers are gradually entering the market.
The final candle is a strong bearish candle that confirms sellers have taken control. This sharp shift in momentum signals that the uptrend is likely coming to an end and that a bearish reversal may be underway.
The Ladder Top candlestick pattern becomes even more reliable when it forms near a key resistance level, where selling pressure is often strongest.
In this scenario, the pattern not only reflects weakening buying momentum but also highlights a price area where sellers are more likely to defend, increasing the probability of a downward reversal.
Ladder Top Candlestick Pattern Trading Strategies
Now that you understand how the Ladder Top candlestick pattern forms and the psychology behind it, let’s explore three practical trading strategies that can help you identify high-probability bearish reversal setups.
Ladder Top Candlestick Pattern at a Resistance Level
One of the most effective ways to trade the Ladder Top candlestick pattern is to combine it with a major resistance level.
When the pattern forms at a price level where sellers have previously entered the market, the probability of a bearish reversal increases.
Take a look at the chart below.
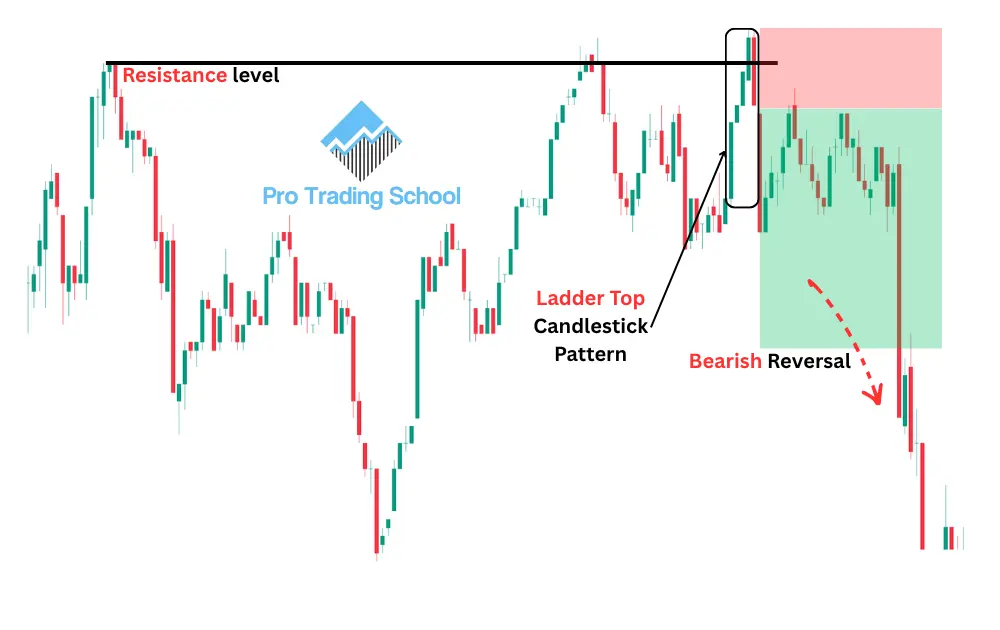
As you can see, the market is in an uptrend before reaching a resistance level and reversing lower. Price then rallies back to the same resistance level a second time, where sellers once again reject higher prices, confirming the validity of the level.
Later, the market tests the resistance level for a third time. This time, a Ladder Top candlestick pattern develops.
While it is not a textbook example, it still reflects the same underlying market psychology, with four consecutive bullish candles followed by a strong bearish candle.
The first four candles show that buyers are still attempting to push prices higher. However, the final bearish candle completely changes the market sentiment.
It engulfs the previous bullish candle, briefly breaks above the resistance level to trigger breakout buyers and stop-loss orders, and then closes back below the resistance.
This false breakout is a strong sign that sellers have regained control and that a bearish reversal may be about to begin.
A conservative entry is to place a sell order at the close of the final bearish candle, with a stop loss above the high of the pattern.
A logical profit target is the next key support level or the next significant price area where buyers may step in.
As the chart shows, the market reverses lower after the pattern forms, producing a successful bearish trade.
Important Note :
This trade setup is provided for educational purposes only and should not be considered financial advice.
Before entering any trade, it is important to consider additional factors such as the higher-timeframe trend, market structure, support and resistance levels, and proper risk management.
The Ladder Top candlestick pattern can be traded on all time frames, making it suitable for scalping, day trading, and swing trading.
However, it generally produces more reliable signals when traded in the direction of the higher-timeframe trend and combined with sound money management principles.
Ladder Top Candlestick Pattern at a Supply Zone
Another effective way to trade the Ladder Top candlestick pattern is to combine it with a supply zone. This strategy helps you align the bearish reversal pattern with an area where institutional selling pressure is likely to enter the market.
What Is a Supply Zone?
A supply zone is a price area where institutional traders have previously sold the market aggressively, causing a strong bearish move.
These large sell orders leave behind a price imbalance that often attracts sellers when the market revisits the same area. As a result, price frequently reacts by moving lower again.
The idea behind this strategy is simple. First, identify a valid supply zone. Then, wait for the market to retrace back to that zone and look for a Ladder Top candlestick pattern to form. When both conditions are present, the pattern provides a high-probability bearish entry signal.
Take a look at the chart below.
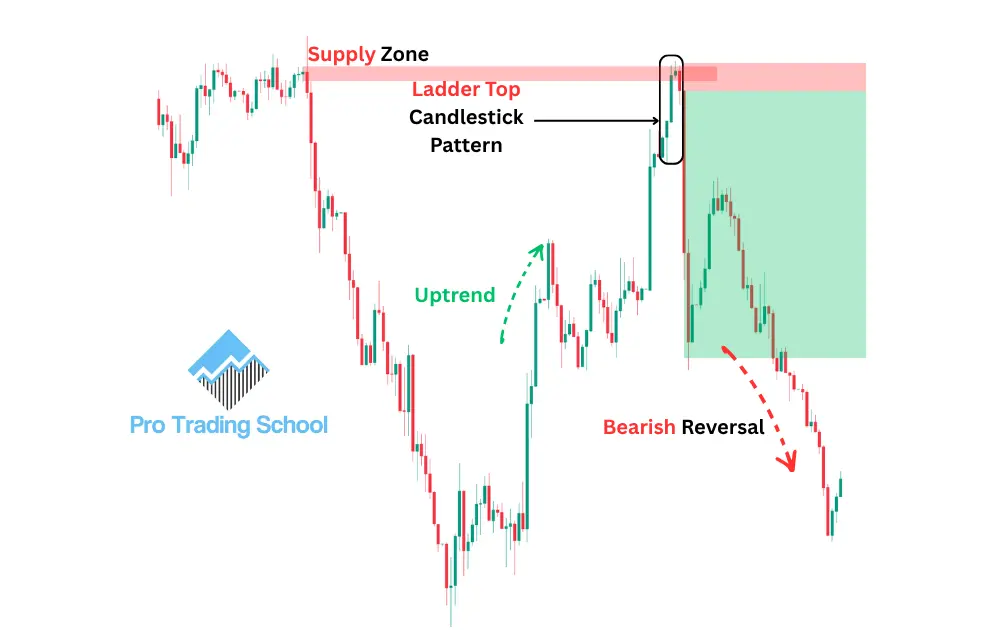
As you can see, the market declines sharply, forming a series of strong bearish candles. This aggressive move indicates that institutional sellers were active, allowing us to identify a valid supply zone.
Another reason this setup is significant is that the supply zone is located at the highest point of the recent price swing.
This increases its importance because there are no nearby supply zones above it competing for selling pressure. As a result, the probability of price reacting from this level is generally higher.
When the market eventually retraces back into the supply zone, a Ladder Top candlestick pattern forms.
The first four candles show that buyers are still attempting to push prices higher, but they fail to break through the supply zone.
The fourth bullish candle is strongly rejected, and the final bearish candle confirms that sellers have stepped back into the market and regained control. This shift in momentum provides a bearish entry signal.
A conservative approach is to place a sell order at the close of the final bearish candle, with a stop loss above the high of the pattern.
A logical profit target is the next key support level. As shown on the chart, the market reverses lower after the pattern forms, producing a favorable risk-to-reward trading opportunity.
Before taking this setup, make sure the supply zone is valid. It should be created by a strong bearish impulse with large bearish candles.
If the move away from the zone consists of small or mixed candles, it usually indicates weak selling pressure and a lower-quality supply zone.
Finally, always check the higher-timeframe trend to ensure your trade is aligned with the broader market direction, and apply sound risk management to protect your trading capital over the long term.
Ladder Top Candlestick Pattern with a Trendline
Another effective way to trade the Ladder Top candlestick pattern is to combine it with a bearish trendline.
In this strategy, the trendline acts as a dynamic resistance level, while the Ladder Top pattern provides the entry signal.
Instead of signaling a trend reversal, the pattern is used as a bearish continuation pattern within an existing downtrend.
Take a look at the chart below.
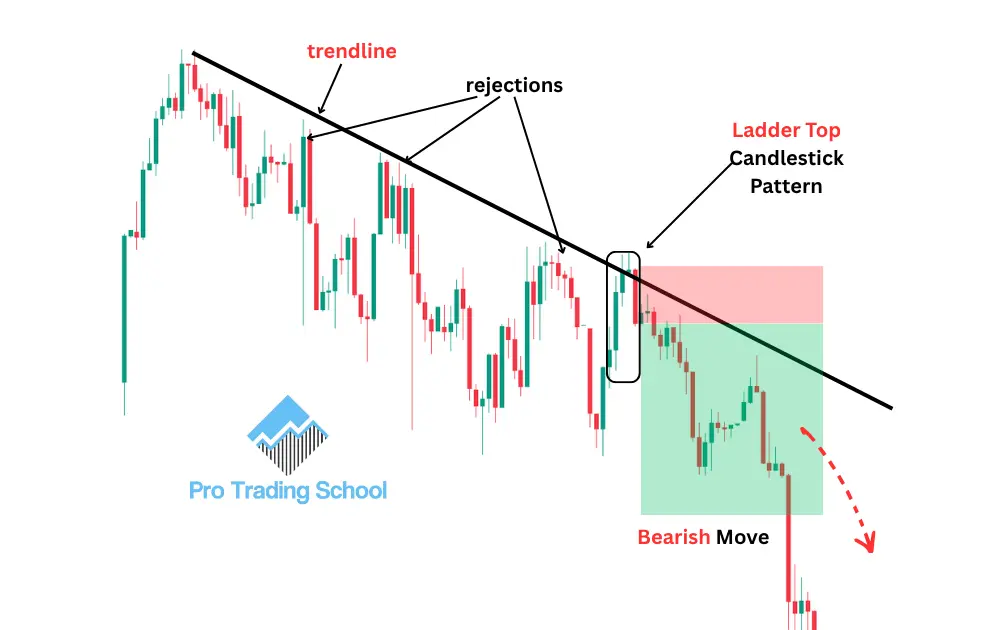
As you can see, the market is in a clear downtrend, indicating that sellers are in control. We have also identified a well-defined bearish trendline, which acts as a dynamic resistance level.
Each time price retraces toward the trendline, sellers step in and push the market lower, confirming that the downtrend remains intact.
Later, the market rallies back to retest the trendline once again. This time, a Ladder Top candlestick pattern forms right at the trendline resistance.
Although the pattern is traditionally known as a bearish reversal pattern, in this example it acts as a bearish continuation signal, confirming that the retracement has likely ended and that the downtrend is ready to resume.
A conservative entry is to place a sell order at the close of the final bearish candle, with a stop loss above the high of the pattern.
A logical profit target is the next key support level. As shown in the chart, the market continues moving lower after the pattern forms, producing a high-quality trade with an attractive risk-to-reward ratio.
For the best results, make sure the trendline is valid by confirming that it has been respected at least twice before the setup forms.
Also, trade in the direction of the higher-timeframe trend and always apply proper risk management to protect your trading capital.
Ladder Top Candlestick Pattern Pros and Cons
| Pros | Cons |
|---|---|
| Provides early reversal signals. The Ladder Top candlestick pattern can alert traders that bullish momentum is fading before a larger bearish move develops. | Requires confirmation. The pattern should not be traded on its own, as false signals can occur without additional confirmation from price action or technical analysis. |
| Easy to recognize. Its five-candle structure makes it relatively straightforward to identify once you understand its characteristics. | Appears infrequently. Compared to single- or two-candle patterns, the Ladder Top is less common, resulting in fewer trading opportunities. |
| Works well with technical confluence. The pattern becomes more reliable when it forms near resistance levels, supply zones, or bearish trendlines. | Less effective in sideways markets. During choppy or range-bound conditions, the pattern is more likely to produce unreliable signals. |
| Can be traded on any time frame. It is suitable for scalping, day trading, and swing trading, provided it is used within the appropriate market context. | Does not indicate profit targets. The pattern signals a potential reversal but does not specify where the market is likely to move, so traders must use support levels or other exit methods. |
| Offers favorable risk-to-reward opportunities. When combined with strong confluence, the pattern often allows for relatively tight stop losses and attractive reward potential. | Can be invalidated by strong bullish momentum. In highly bullish markets driven by strong fundamentals or institutional buying, the pattern may fail and price can continue higher. |
| Reflects market psychology. The gradual weakening of buying pressure followed by a decisive bearish candle helps traders understand the shift in control from buyers to sellers. | Can be difficult for beginners to interpret. New traders may confuse the Ladder Top with other multi-candle patterns or fail to evaluate the surrounding market conditions correctly. |
Conclusion
The Ladder Top candlestick pattern is a valuable bearish reversal pattern that can help traders identify when buying momentum is fading and sellers are beginning to take control.
While the pattern can provide high-quality trading opportunities, it should never be used in isolation.
Combining it with key technical tools such as resistance levels, supply zones, and trendlines can significantly improve the probability of a successful trade.
Like any trading strategy, consistent results come from following a well-defined trading plan, managing risk effectively, and waiting for high-quality setups rather than trading every pattern that appears.
By understanding the structure, psychology, and best trading strategies for the Ladder Top candlestick pattern, you can make more informed trading decisions and increase your confidence in the markets.
Frequently Asked Questions
Is the Ladder Top candlestick pattern bullish or bearish?
The Ladder Top candlestick pattern is a bearish candlestick pattern. It typically forms after an uptrend and signals that buying momentum is weakening while selling pressure is increasing.
Although it suggests a potential downward reversal, traders should always wait for confirmation before entering a trade.
How reliable is the Ladder Top candlestick pattern?
The reliability of the Ladder Top candlestick pattern depends on the market context. It generally produces stronger signals when it forms near a key resistance level, a supply zone, or a bearish trendline.
Combining the pattern with higher-timeframe analysis and sound risk management can significantly improve its effectiveness.
What is the best confirmation for the Ladder Top candlestick pattern?
The best confirmation is a bearish reaction after the pattern forms. Traders often look for a strong bearish close, increased selling momentum, or confluence with technical tools such as resistance levels, supply zones, moving averages, or trendlines before opening a short position.
Can beginners trade the Ladder Top candlestick pattern?
Yes. The Ladder Top candlestick pattern is suitable for beginners because its five-candle structure is relatively easy to recognize.
However, new traders should avoid relying on the pattern alone and instead combine it with other forms of technical analysis to reduce the risk of false signals.
Which markets can you trade with the Ladder Top candlestick pattern?
The Ladder Top candlestick pattern can be used in most financial markets, including Forex, stocks, cryptocurrencies, commodities, futures, and indices.
Since it is based on price action, the pattern can also be applied to multiple time frames, making it suitable for scalping, day trading, and swing trading.










Can it be used for bullish reversal ?
I need the trading book
I need the book