The Bullish Kicker Candlestick Pattern is one of the most powerful bullish reversal patterns traders can identify on a price chart.
What makes this pattern particularly interesting is the sudden shift in market sentiment it represents, as sellers lose control and buyers aggressively step into the market.
Unlike many candlestick patterns that develop gradually, the Bullish Kicker reflects a sharp transition from bearish to bullish momentum.
When it appears in the right market context, it can provide traders with an early indication that a downward move may be losing strength and a potential bullish reversal could be developing.
In this guide, you will learn what the Bullish Kicker Candlestick Pattern is, how to identify it on a chart, what it tells you about buyers and sellers, and how to trade it using practical trading strategies.
What Is a Bullish Kicker Candlestick Pattern?
The Bullish Kicker Candlestick Pattern is a two-candlestick reversal pattern that consists of a bearish or bullish candle followed by a strong bullish candle.
Look at the chart example below :
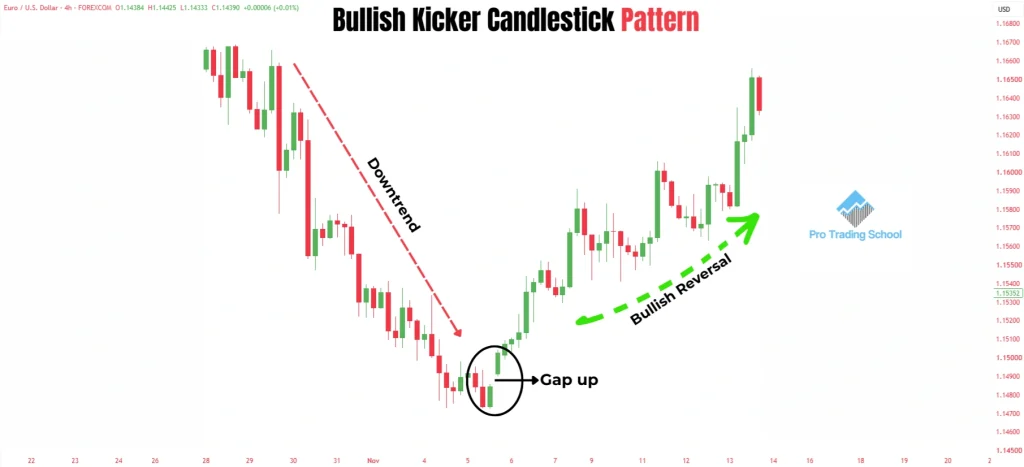
A key characteristic of this pattern is the gap between the two candles, which reflects a sudden and significant shift in market sentiment.
The Bullish Kicker typically appears at the end of a downtrend and signals a potential bullish reversal.
The first candle provides information about the current market pressure. If it is bearish, it suggests that sellers are still in control.
If it is bullish, it may indicate that buyers are beginning to step in, but at this stage, a reversal is not yet confirmed.
What makes the Bullish Kicker Pattern significant is the gap between the candles. After the gap occurs, a strong bullish candle forms, showing a sudden shift in market sentiment.
This second candle is what makes the difference: it indicates that buyers have stepped in aggressively and are now taking control of the market.
The combination of the gap and the strong bullish candle makes the Bullish Kicker a potentially powerful bullish reversal signal.
Bullish Kicker Candlestick Pattern Example
To help you identify the Bullish Kicker Candlestick Pattern correctly, take a look at the chart example below.
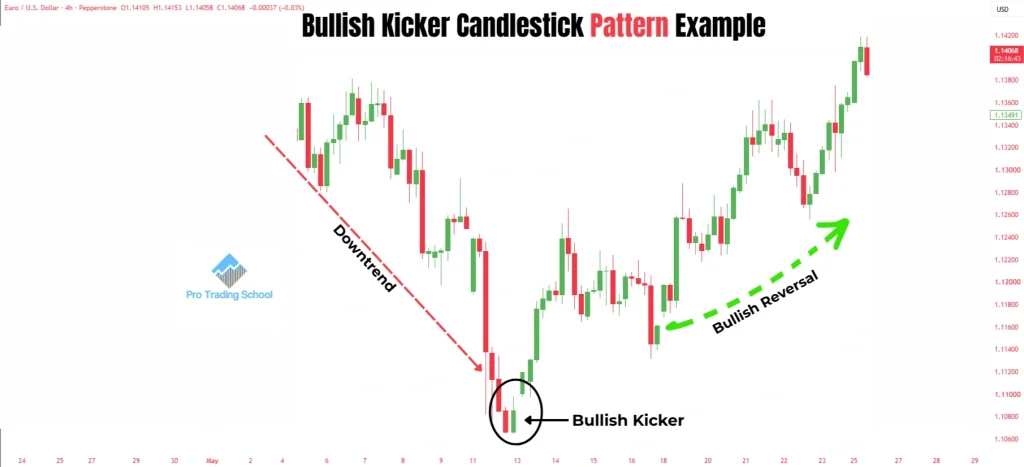
It shows how this type of sharp bullish transition can appear in real market conditions.
As you can see, the market was initially moving downward. A bullish candle then appeared, suggesting that buyers were beginning to challenge the existing selling pressure. However, this candle alone was not enough to confirm a reversal.
The key development came next: price gapped higher, revealing a sudden increase in buying pressure.
The bullish candle that formed after the gap provided additional confirmation that market sentiment had shifted significantly in favor of buyers.
Together, these signals suggested that the previous downtrend was losing control and that a potential new upward move was developing.
Important Note
Most educational examples of the Bullish Kicker Pattern show its textbook formation: a bearish candle followed by a gap higher and a strong bullish candle. This is the classic Bullish Kicker setup and the version traders should learn first.
However, real market charts do not always produce patterns that look as clean as textbook illustrations.
You may sometimes see a bullish candle begin the reversal before price gaps higher and another strong bullish candle follows.
While this variation communicates a similar idea, a rapid increase in buying pressure, it should not be confused with the classic Bullish Kicker Candlestick Pattern, which specifically begins with a bearish candle.
The important concept to understand from either situation is the sudden shift in market pressure. The gap and subsequent bullish strength can indicate that buyers have entered aggressively and that traders should pay attention to the possibility of a developing bullish move.
The Bullish Kicker is just one of many candlestick formations traders can use to read price action. If you want to discover more patterns, check out our 33 Candlestick Patterns Cheat Sheet, where you’ll find a simple visual guide to the most important bullish and bearish candlestick patterns.
Anatomy of the Bullish Kicker Candlestick Pattern
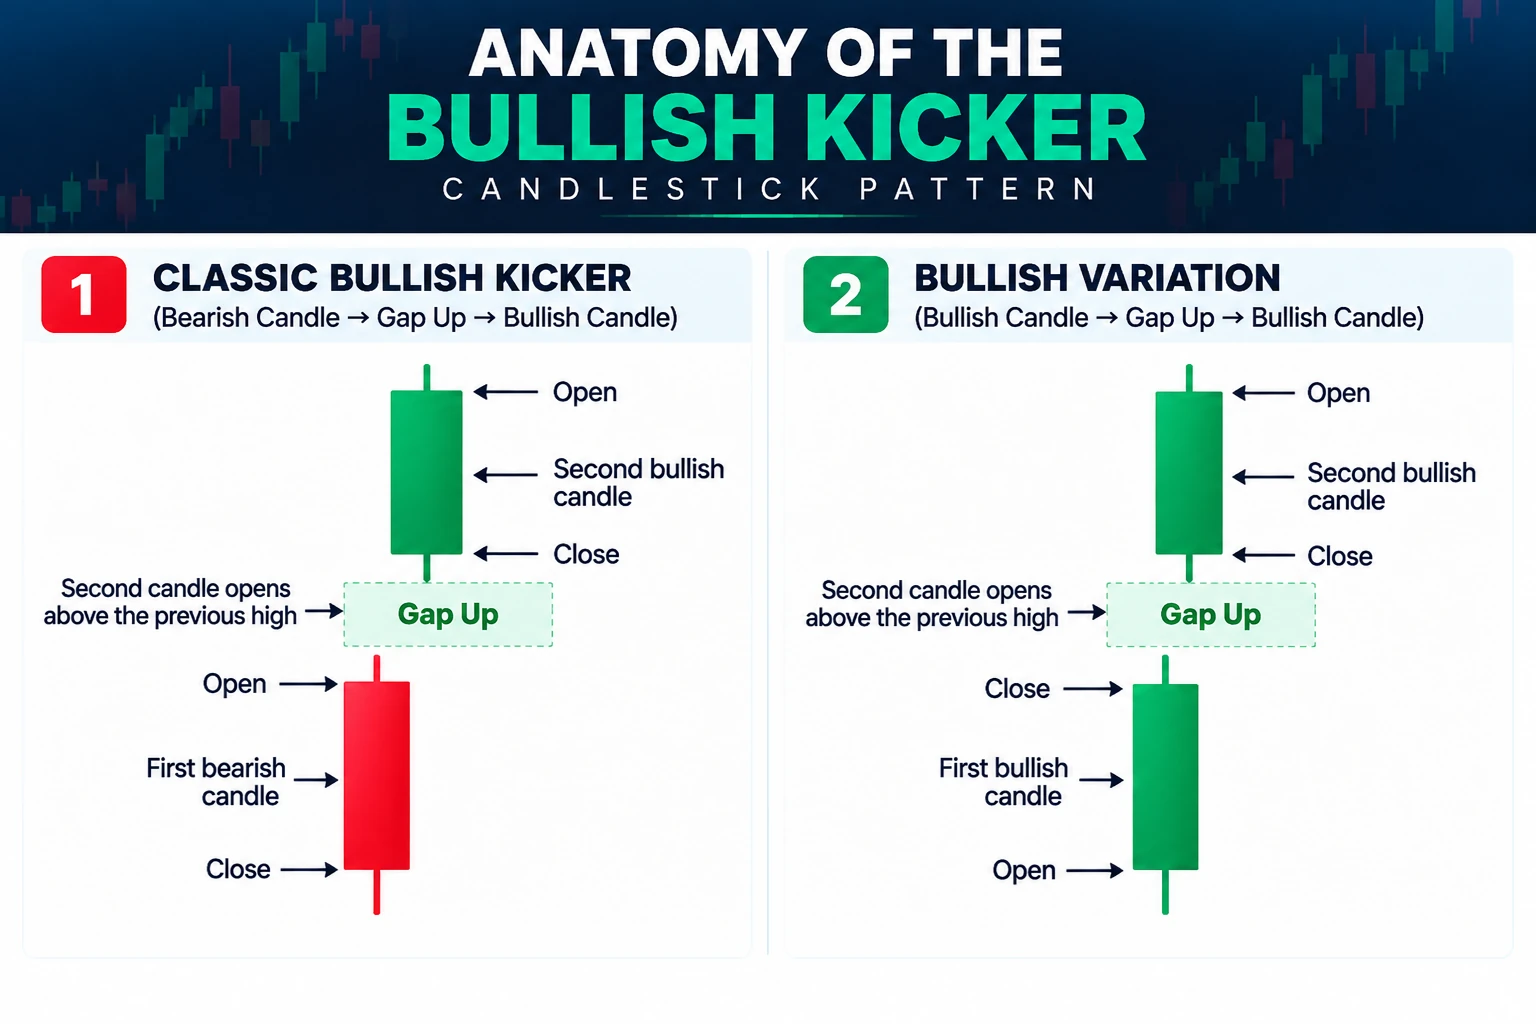
Now, let’s take a closer look at the anatomy of the Bullish Kicker Candlestick Pattern and understand what is happening behind each candle. Look at the chart example below :
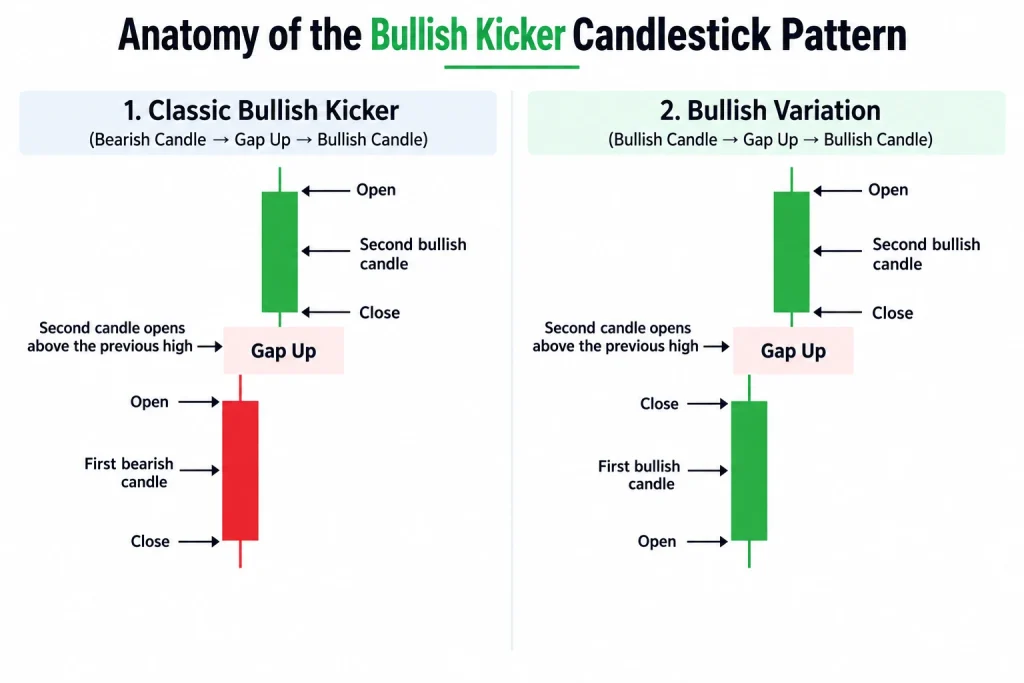
As you can see in the illustration above, the classic Bullish Kicker consists of two candlesticks separated by a gap.
The first candle is bearish: the market opens higher and closes lower, showing that sellers are still in control.
Then, instead of continuing downward, price suddenly gaps higher. The second candle opens above the previous price action and continues moving upward before closing as a strong bullish candle.
This is the textbook Bullish Kicker formation because it represents a very clear change in market sentiment.
The market moves from a bearish candle and selling pressure to a sudden gap higher followed by strong bullish momentum.
In other words, sellers appear to be in control during the first candle, but buyers aggressively take over during the second.
The second formation, shown on the right, is a variation that you may encounter on real charts.
In this case, the first candle is already bullish, suggesting that buyers are beginning to step into the market. Price then gaps higher, and another bullish candle forms above the gap and closes higher, showing that buying pressure has strengthened.
The main difference is therefore the first candle. The classic Bullish Kicker begins with a bearish candle, while the variation begins with a bullish candle.
What both formations have in common is the broader context: they appear after a downward move and are characterized by a gap higher followed by strong bullish price action.
The textbook Bullish Kicker can be relatively rare on real charts, particularly in markets where large price gaps are less common.
For this reason, traders may encounter variations of the underlying bullish transition more frequently. However,However, keep in mind that the classic Bullish Kicker Candlestick Pattern consists of a bearish candle, followed by a gap up and then a strong bullish candle.
Bullish Kicker Pattern at a Support Level Strategy
Now, let’s move on to Bullish Kicker trading strategies. The first strategy combines the Bullish Kicker Candlestick Pattern with a key support level to identify potential bullish reversal opportunities.
Take a look at the chart example below.
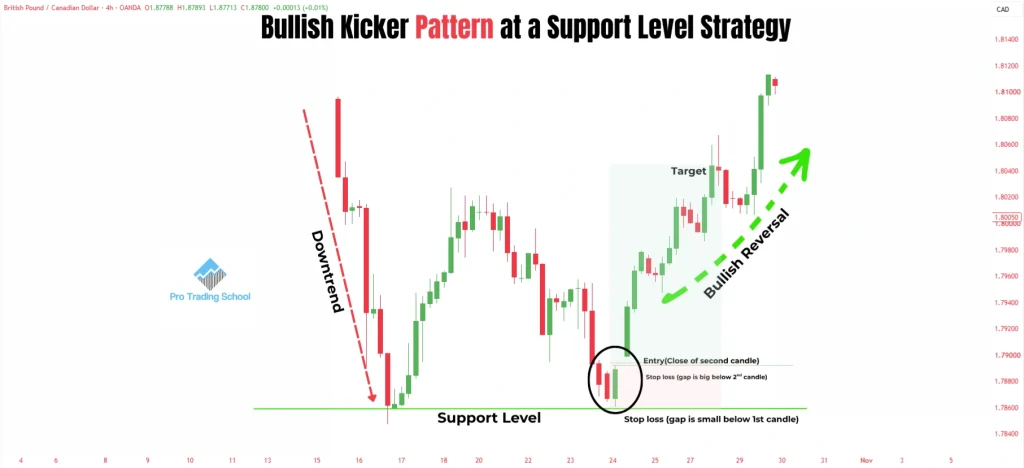
As you can see, the market was initially trending downward before reaching a key price level and reversing higher.
This reaction created a support level, an area where buyers had previously stepped into the market and pushed price upward.
After identifying the support level, the next step is to wait and observe how price behaves when it returns to this area.
In our example, the market retraced back toward the same support level, and this time a Bullish Kicker Pattern formed directly around the zone.
The appearance of the Bullish Kicker suggests that the retracement may be coming to an end and that buyers are beginning to take control again.
Instead of buying simply because price has reached support, the candlestick pattern provides additional confirmation that buying pressure has actually entered the market.
This is what makes the combination particularly useful. The support level provides the location, while the Bullish Kicker provides the timing.
Support identifies an area where buyers may be interested in entering the market, while the Bullish Kicker signals a sudden shift toward buying pressure.
In this example, a trader could consider entering at the close of the second bullish candle, with a stop loss placed below the pattern or the support area.
The next significant resistance level can then be used as a potential profit target. As the chart shows, price subsequently moved higher after the Bullish Kicker formed.
However, this should not be the only factor considered before entering a trade. One additional confirmation is to check the higher timeframe and determine whether the setup is aligned with the broader market direction.
A Bullish Kicker forming at support can carry more contextual significance when the higher timeframe also supports a bullish move.
Bullish Kicker Pattern with a Demand Zone Strategy
The second strategy consists of combining the Bullish Kicker Candlestick Pattern with a demand zone.
This approach uses the demand zone to identify an area where strong buying pressure previously entered the market, while the Bullish Kicker helps confirm that buyers may be stepping in again.
Take a look at the chart example below.
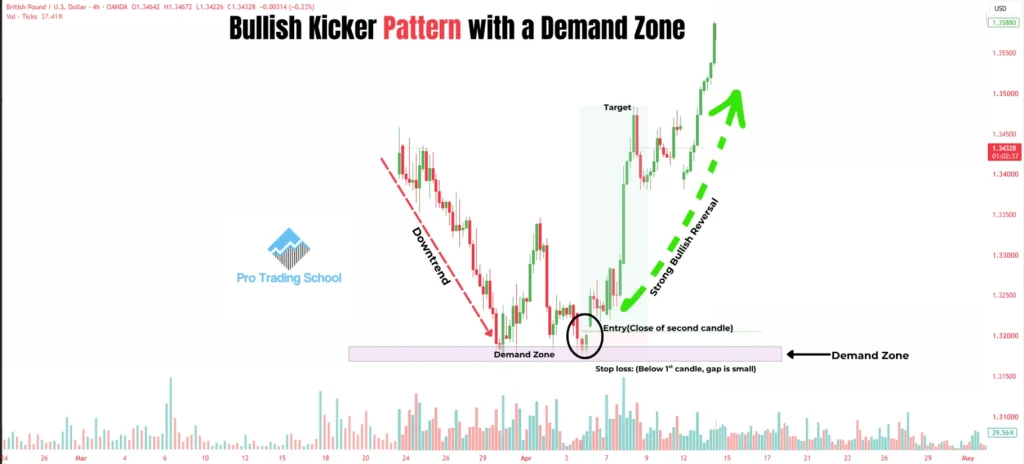
As you can see, the market was initially trending downward before reaching a specific price area and moving strongly higher.
The sharp move away from this area, characterized by large bullish candles and strong upward momentum, helps identify it as a potential demand zone rather than simply a support level.
Once the demand zone has been identified, the next step is to wait for price to retrace back toward it.
There is no need to enter immediately when price reaches the zone. Instead, we wait for additional confirmation that buyers are actually returning to the market.
In this example, when price retraced back into the demand zone, a Bullish Kicker Candlestick Pattern formed.
The gap higher followed by the strong bullish candle signals a sudden increase in buying pressure and provides additional confirmation that the demand zone may hold.
A trader could consider placing an entry at the close of the second bullish candle, with a stop loss below the pattern or demand zone.
The next significant resistance level can then be used as a potential profit target. As you can see in the example, price subsequently moved higher after the setup formed.
This strategy can also be strengthened by analyzing the higher timeframe before taking the trade.
Ideally, the setup should be aligned with the broader market direction rather than taken in isolation. Proper risk management is equally important, as no candlestick pattern can guarantee the outcome of an individual trade.
Important Note
The Bullish Kicker Candlestick Pattern is not a holy grail. Like every trading setup, it will sometimes work and sometimes fail. This is why a stop loss and proper position sizing are essential parts of the strategy.
The objective is not to win every trade, but to manage losses when a setup fails while maintaining a favorable risk-to-reward ratio when trades move in your favor.
Over a sufficiently large sample of trades, the combination of a tested strategy, disciplined risk management, and consistent execution is more important than the outcome of any single Bullish Kicker setup.
Conclusion
The Bullish Kicker Candlestick Pattern is a powerful reversal pattern that can help traders identify a potential shift from bearish to bullish momentum.
However, instead of trading the pattern in isolation, combining it with key areas such as support levels or demand zones can provide stronger confirmation.
Always consider the broader market context, manage your risk carefully, and remember that no candlestick pattern works every time.