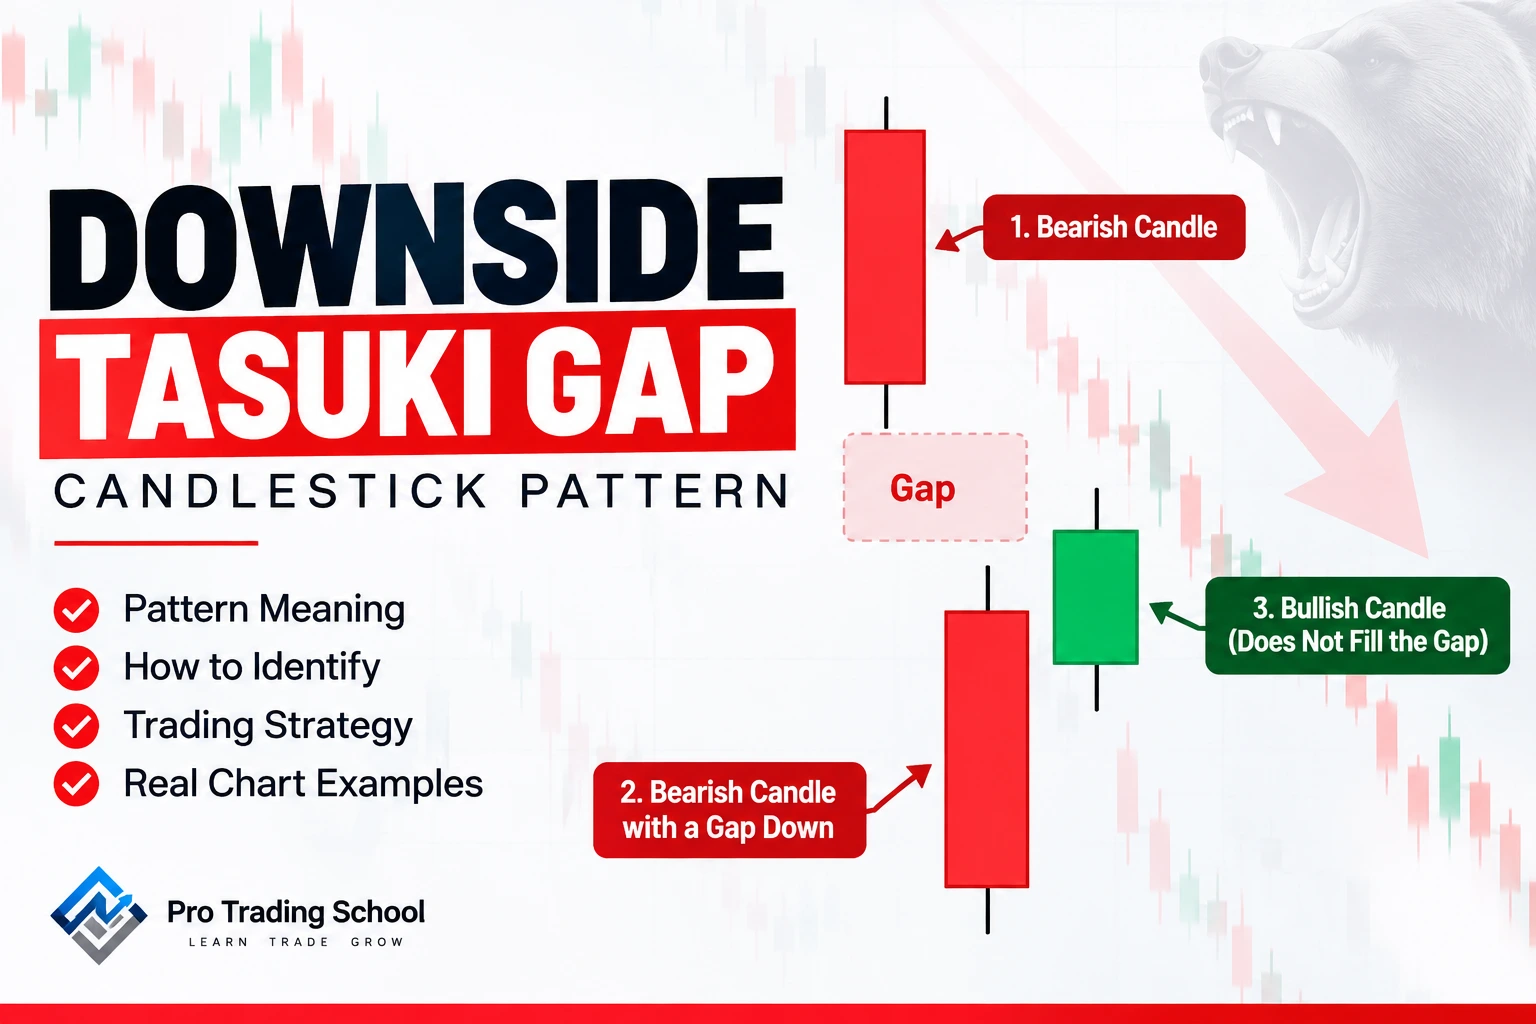
The Downside Tasuki Gap candlestick pattern is a bearish continuation pattern that typically appears during an established downtrend.
It consists of three consecutive candles and signals that selling pressure remains strong despite a temporary attempt by buyers to push the price higher.
The pattern begins with a strong bearish candle, followed by a second bearish candle that opens lower, creating a visible gap between the two candles.
The third candle is bullish and moves back toward the gap, partially filling it but failing to close it completely.
This failure to fully close the gap is an important part of the pattern. It suggests that buyers attempted to regain control but lacked enough momentum to overcome the existing selling pressure.
When sellers regain control following this temporary recovery, the prevailing downtrend may continue, making the Downside Tasuki Gap a potential bearish continuation signal for traders.
Downside Tasuki Gap Candlestick Pattern Example
To better understand how to identify the Downside Tasuki Gap candlestick pattern on a real chart, take a look at the example below.
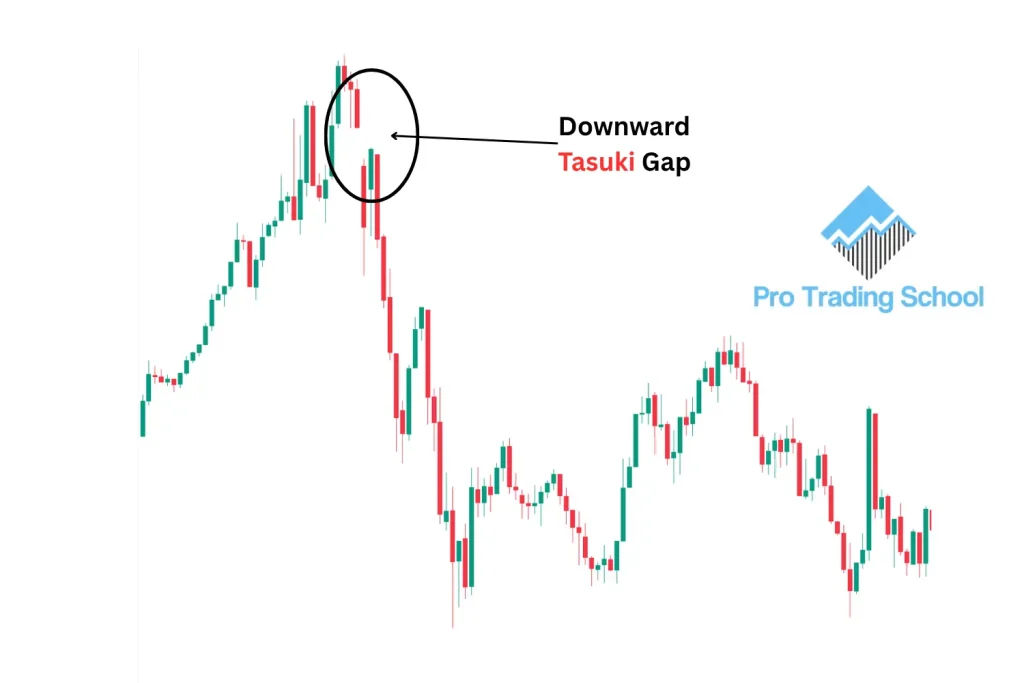
As you can see, the market was initially trending upward before reversing to the downside. Although the Downside Tasuki Gap typically forms within an established downtrend, it can also develop during the early stages of a bearish reversal, where it may provide additional evidence that sellers are gaining control and a new downtrend is developing.
Following the reversal, the first bearish candle forms as selling pressure pushes the price lower.
The next candle opens lower, creating a visible gap, and continues in the same bearish direction. This confirms that sellers remain aggressive and are willing to push the market to lower prices.
The third candle is bullish and attempts to recover some of the previous decline by moving back into the gap.
However, buyers fail to completely fill the gap, and the candle closes before reaching the previous bearish candle.
This failed recovery is the key signal. Buyers attempted to regain control, but their momentum was not strong enough to overcome the existing selling pressure.
Sellers subsequently regained control, and the price continued moving lower, confirming the bearish continuation suggested by the Downside Tasuki Gap pattern.
Downside Tasuki Gap Candlestick Pattern Meaning
One important question every trader should ask when analyzing a candlestick pattern is: What is actually happening between buyers and sellers?
Understanding the psychology behind the Downside Tasuki Gap can be more useful than simply memorizing its shape.
The Downside Tasuki Gap candlestick pattern means that sellers remain in control despite an attempt by buyers to push the price higher.
Since the pattern generally develops during a downtrend, bearish momentum is already present before the three candles begin to form.
Look a the chart example below :
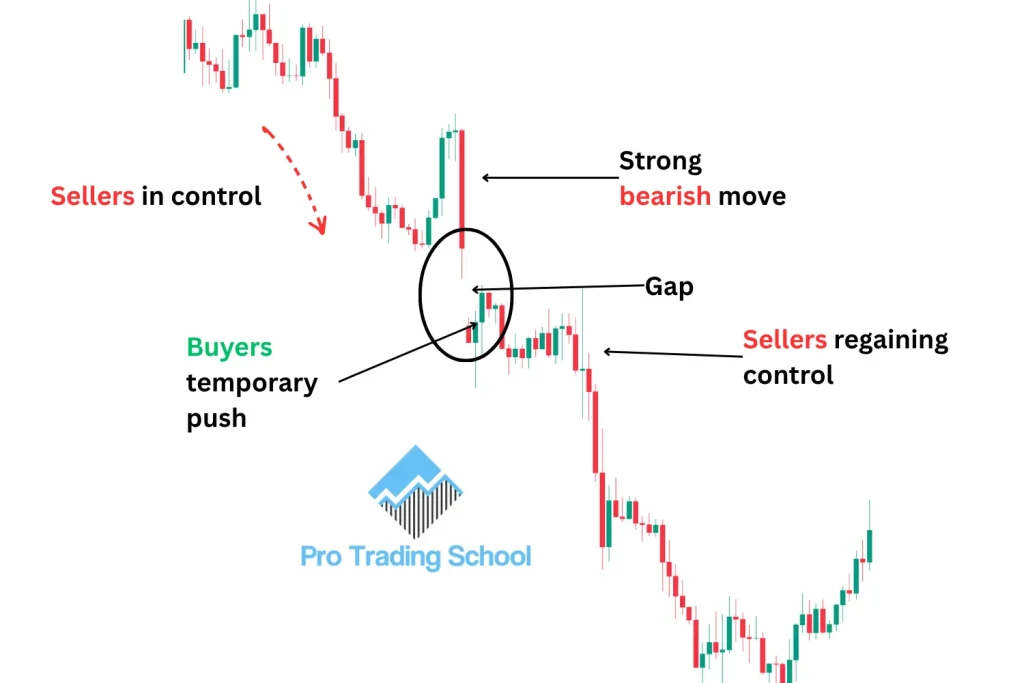
The first bearish candle reinforces this selling pressure as sellers continue driving the market lower.
The following session opens with a gap down, showing an additional shift in price in favor of sellers. When the second candle also closes bearish, it provides further evidence that bearish momentum remains strong.
The most important part of the pattern, however, is the third candle. This candle is bullish, showing that buyers have entered the market and are attempting to recover some of the previous losses. Price moves upward and begins to fill the gap created between the first two bearish candles.
This is where the battle between buyers and sellers becomes particularly important. If buyers were strong enough to completely close the gap and continue pushing the price higher, the original bearish momentum could be weakening.
In a valid Downside Tasuki Gap, however, the bullish candle only partially fills the gap and fails to close it completely.
That failure reveals the underlying psychology of the pattern: buyers attempted to regain control, but their buying pressure was not strong enough to overcome the dominant sellers.
The unsuccessful recovery therefore suggests that bearish momentum may resume and that the existing downtrend could continue.
For traders, the Downside Tasuki Gap can therefore act as a potential bearish continuation signal and may help identify opportunities to trade in the direction of the prevailing downtrend.
However, the pattern should not be treated as an automatic sell signal; its reliability improves when it is analyzed alongside the broader market structure, trend, and other forms of confirmation.
The Downside Tasuki Gap is just one of many formations traders can use to analyze price action. For a broader overview, check out our 33 Candlestick Patterns Cheat Sheet (Simple Visual Guide) to learn the most important bullish, bearish, reversal, and continuation patterns.
Downside Tasuki Gap vs. Upside Tasuki Gap
As discussed earlier, the Downside Tasuki Gap is a bearish continuation pattern that suggests an existing downtrend may continue.
Its bullish counterpart is the Upside Tasuki Gap, which forms during an uptrend and signals the potential continuation of bullish momentum.
Although the two patterns have opposite implications, their underlying logic is very similar: the market is trending strongly, a gap forms in the direction of the prevailing trend, and then the opposing side attempts but fails to completely fill that gap.
The chart below illustrates the difference between the Downside Tasuki Gap and Upside Tasuki Gap.
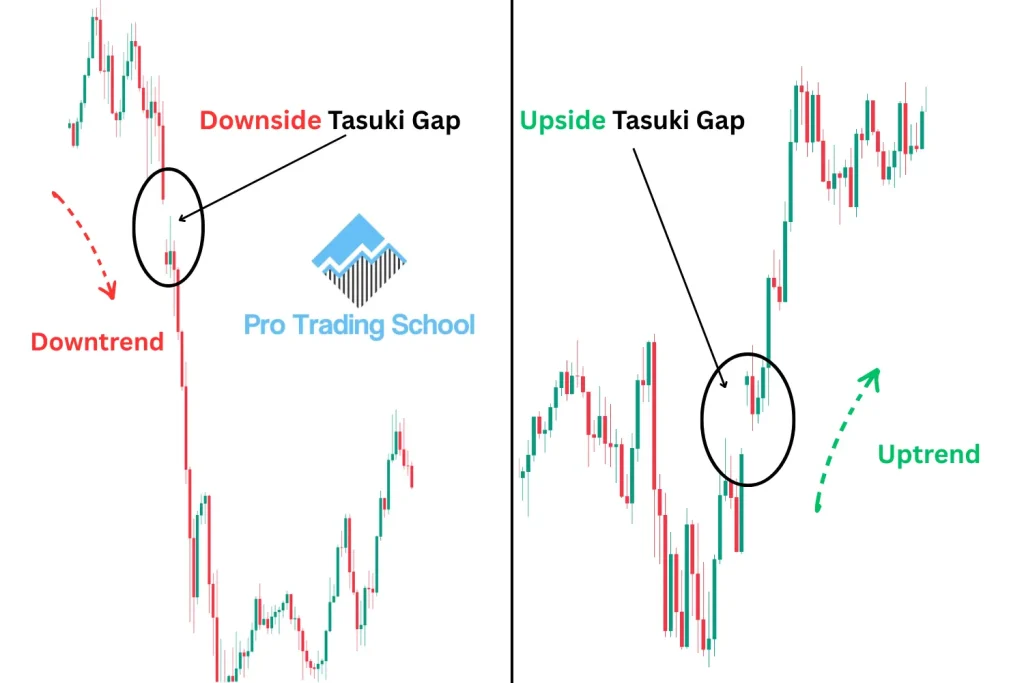
Downside Tasuki Gap
On the left side of the chart, we have a clear Downside Tasuki Gap forming within a bearish market. The first candle is bearish and moves in the direction of the existing downtrend.
The second candle gaps lower and also closes bearish, confirming that selling pressure remains strong.
The third candle is bullish and attempts to push the price back toward the gap. However, buyers fail to completely fill it.
This failed recovery suggests that buying pressure is not strong enough to challenge the prevailing bearish momentum. Sellers remain in control, and the price subsequently continues moving lower.
Upside Tasuki Gap
On the right side, we have the opposite formation: the Upside Tasuki Gap candlestick pattern.
In this case, the market is trending upward. A bullish candle forms first, followed by another bullish candle that gaps higher, reflecting continued buying pressure.
The third candle is bearish and moves back toward the gap as sellers attempt to push the market lower.
However, they fail to completely fill the gap. This failure suggests that sellers are not strong enough to reverse the prevailing bullish momentum. Buyers remain in control, and the uptrend subsequently continues.
The key difference is therefore the direction of the prevailing trend and the gap. A Downside Tasuki Gap occurs in a bearish market and signals potential downside continuation, while an Upside Tasuki Gap occurs in a bullish market and signals potential upside continuation.
In both cases, the failure of the counter-trend candle to completely fill the gap is what helps confirm that the dominant side of the market may still be in control.
Trading the Downside Tasuki Gap During a Trending Market
One practical way to trade the Downside Tasuki Gap candlestick pattern is to look for it within an established downtrend and combine it with an important technical level.
This approach can be particularly useful for two reasons: you are trading in the direction of the prevailing trend, and the structure of the setup can provide a favorable risk-to-reward ratio when the entry, stop loss, and profit target are properly defined.
Take a look at the chart example below.
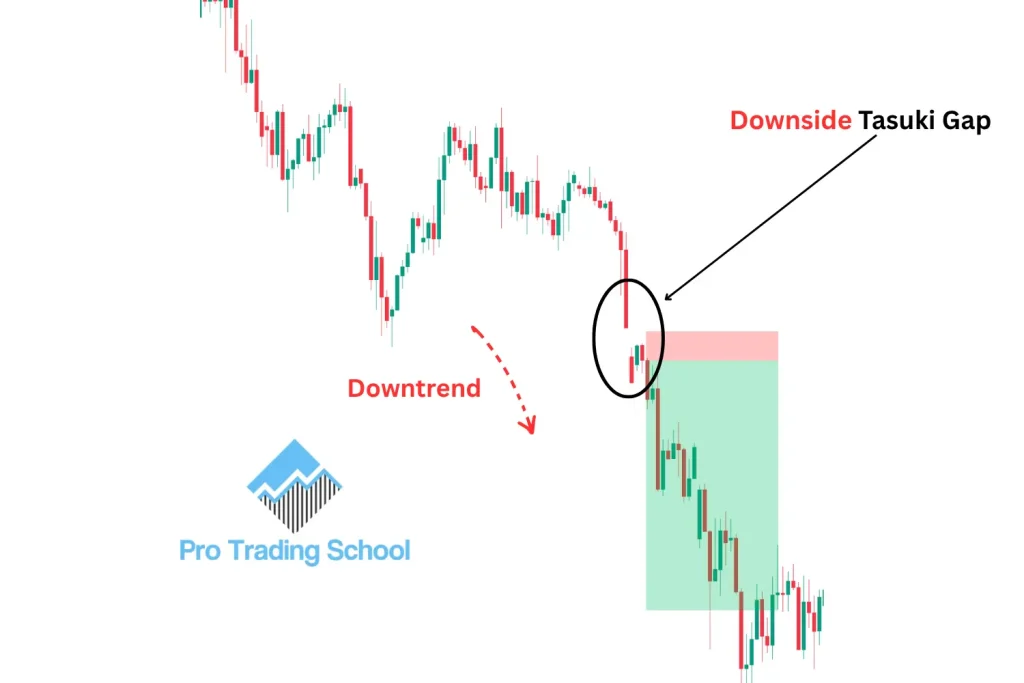
As you can see, the market is already trending downward, indicating that sellers are in control.
During the decline, a Downside Tasuki Gap pattern forms, providing a potential signal that bearish momentum could continue.
However, the candlestick pattern is not the only reason to consider the trade. If you look to the left of the chart, you can see that the gap forms around a previous support level that has turned into resistance.
This adds an important layer of confluence to the setup. Instead of trading the Downside Tasuki Gap in isolation, we now have the prevailing downtrend, the bearish candlestick pattern, and a key resistance area all pointing in the same direction.
For the entry, a trader can wait for the third bullish candle to attempt to fill the gap and fail. Once this rejection confirms that buyers are struggling to push the price higher, a short position can be considered as bearish pressure begins to return.
The stop loss can be placed above the high of the third candle or above the nearby resistance area, with enough room to account for normal price fluctuations.
Rather than using a fixed number of pips for every trade, the exact distance should depend on the market being traded, its volatility, and the structure of the setup.
The profit target can then be placed around the next significant support level or previous swing low. In the example below, sellers regained control following the failed gap fill, and the market continued moving lower toward the target.
Important Note
The Downside Tasuki Gap is not a guaranteed trading signal. Even when the pattern appears during a well-established downtrend and aligns with a key resistance level, the market can still move against the setup.
For this reason, always define your risk before entering a trade, use a stop loss, and apply disciplined position sizing and money management.
The goal is not to find a candlestick pattern that wins every time, but to identify well-structured setups where the potential reward justifies the amount of capital being risked.
Conclusion
The Downside Tasuki Gap candlestick pattern is a bearish continuation signal that shows sellers remain in control after buyers fail to completely fill the gap.
While the pattern can provide valuable trading opportunities, it works best when combined with a clear downtrend and key technical levels. Always use proper risk management and remember that no candlestick pattern guarantees the market’s next move.