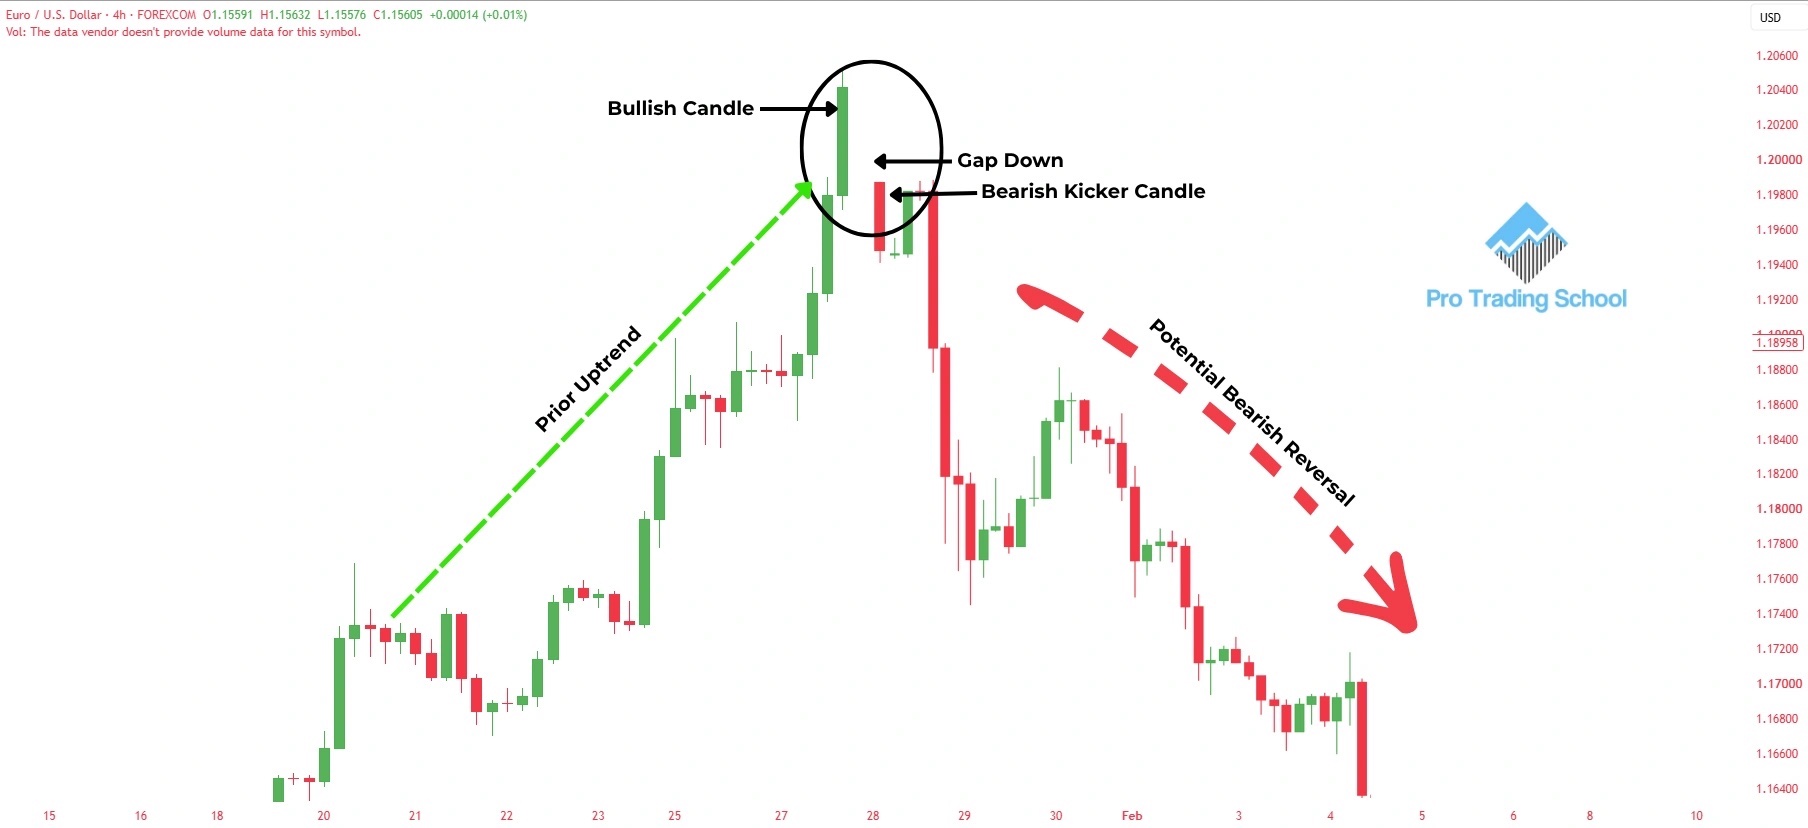
A Bearish Kicker is a bearish reversal candlestick pattern that consists of two candles. The first candle is bullish, followed by a gap down. The second candle forms after the gap and is bearish.
The pattern signals a sudden shift in market sentiment from bullish to bearish, showing that sellers have taken control.
When it forms under the right market conditions and with proper confirmation, the Bearish Kicker can be used as a potential signal to enter a short trade.
Bearish Kicker Pattern Chart Example
The Bearish Kicker typically forms after an upward price move and signals a sudden shift from buying pressure to selling pressure.
Look at the chart example below:
As you can see, the market was trending upward, and buyers were clearly in control. A strong bullish candle then formed, confirming the buyers’ dominance.
However, instead of continuing higher, the market suddenly gapped down and formed a strong bearish candle. The bullish candle, the gap, and the bearish candle together form what we call the Bearish Kicker pattern.
This sudden gap shows a significant change in market sentiment. Buyers were initially in control, but sellers stepped in aggressively and pushed the market in the opposite direction.
You may also find different variations of the pattern. In this example, the gap does not appear completely below the entire bullish candle. However, if you compare the closing price of the bullish candle with the opening price of the bearish candle, you can clearly see the gap between them.
This is why you should focus on the opening and closing prices of the two candles, rather than expecting every Bearish Kicker to look exactly the same.
Bearish Kicker Candlestick Pattern Meaning
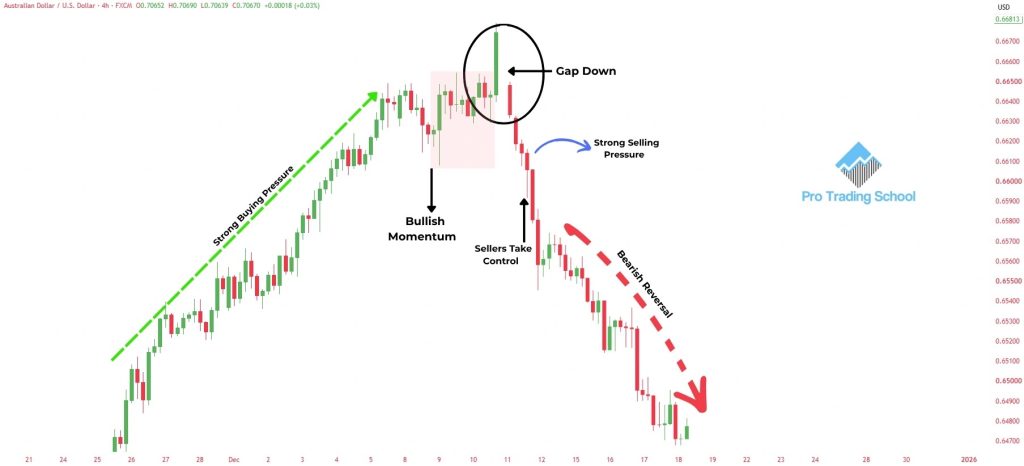
When a Bearish Kicker candlestick pattern forms after an upward move, it can signal a sudden shift in market sentiment and a potential bearish reversal.
Look at the chart example below:
As you can see, the market was trending upward, meaning buyers were in control. After a short consolidation, a strong bullish candle formed, showing that buying pressure was still present and buyers remained dominant.
But what happened next was completely different.
Instead of continuing higher, the market gapped down, and the second candle opened significantly below the previous candle’s close. It then moved lower and closed below its opening price, forming a strong bearish candle.
The gap represents a sudden change in market sentiment. This can occur when new information, unexpected news, an earnings announcement, or another catalyst causes market participants to reassess the asset quickly. However, a gap does not by itself tell us the exact cause.
The bearish candle that follows confirms that sellers have taken control during that period. In this example, the shift was followed by further downside as the market continued to move lower.
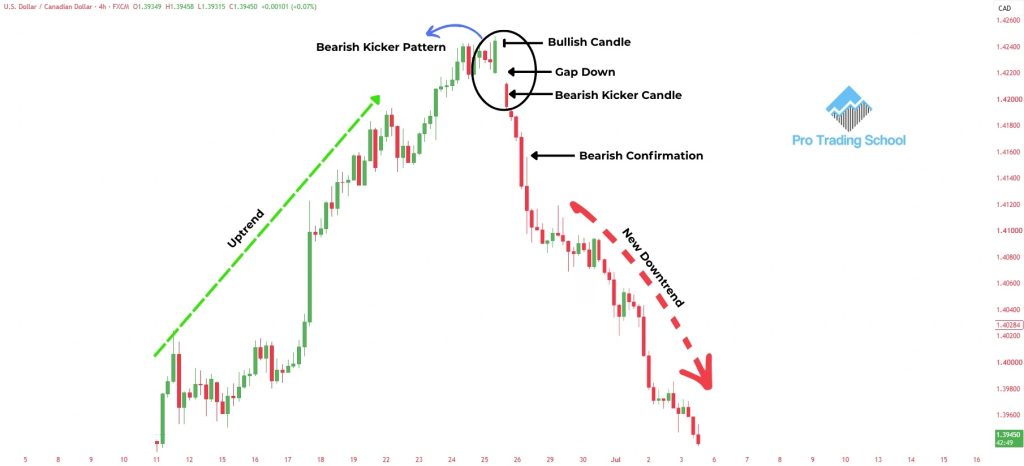
So, remember these three key elements when identifying a Bearish Kicker:
- A bullish candle — showing that buyers are initially in control.
- A gap down — showing a sudden and significant shift in market sentiment.
- A strong bearish candle — showing that sellers have taken control and confirming the potential bearish reversal.
Together, these elements form the Bearish Kicker candlestick pattern.
Bullish vs. Bearish Kicker Candlestick Patterns
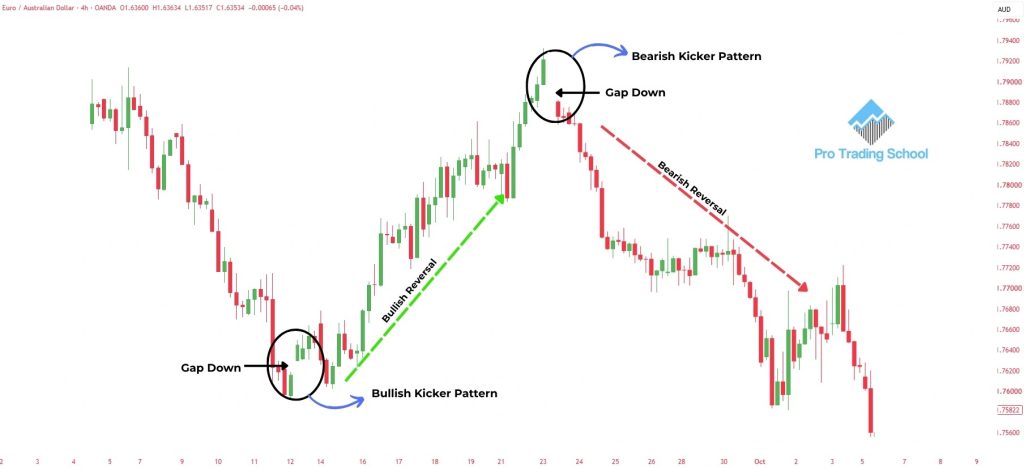
The Bullish Kicker pattern shown in the chart starts with a bullish candle, indicating that sellers are no longer in control and buyers are clearly taking over.
The market then gaps higher and forms another strong bullish candle, confirming the strength of the buying pressure.
The usual Bullish Kicker setup consists of a bearish candle followed by a gap up and then a bullish candle.
However, the pattern shown in this chart is a variation of the Bullish Kicker that you may also encounter when analyzing real market charts.
In this variation, the first candle is already bullish, followed by a clear gap up and another bullish candle.
The important element is the gap and the strong continuation of buying pressure, showing that buyers have aggressively taken control of the market.
The Bullish Kicker is the opposite version of the Bearish Kicker and signals a potential shift from selling pressure to buying pressure. If you want to understand this pattern in detail, read our complete Bullish Kicker Candlestick Pattern guide.
The Bearish Kicker pattern starts with a bullish candle, showing that buyers are in control. The market then gaps lower and forms a strong bearish candle.
This shows a sudden shift from buying pressure to selling pressure and can signal a potential reversal to the downside.
The easiest way to remember the difference is simple:
Bullish Kicker: A bearish candle, followed by a gap up and a bullish candle.
Bearish Kicker: A bullish candle, followed by a gap down and a bearish candle.
In both patterns, the gap is an important element because it highlights the sudden change in market sentiment between the two candles.
We can use the Bearish Kicker as a sell signal with different trading strategies. If you already have a trading strategy based on price action, you can also add this candlestick pattern to your arsenal as an additional confirmation signal.
In this section, I will show you two powerful trading strategies you can use with the Bearish Kicker pattern.
Bearish Kicker Trading Strategies
We can use the Bearish Kicker as a sell signal with different trading strategies. If you already have a trading strategy based on price action, you can also add this candlestick pattern to your arsenal as an additional confirmation signal.
In this section, I will show you two powerful trading strategies you can use with the Bearish Kicker pattern.
Trading the Bearish Kicker With a Liquidity Sweep
As you already know, candlestick patterns are only signals. When they are traded under the wrong market conditions, they can easily fail. The same principle applies to the Bearish Kicker.
Since the Bearish Kicker is a bearish reversal pattern, we first need evidence that the current uptrend may be ready to reverse before using the pattern as a sell signal.
Look at the chart example below.
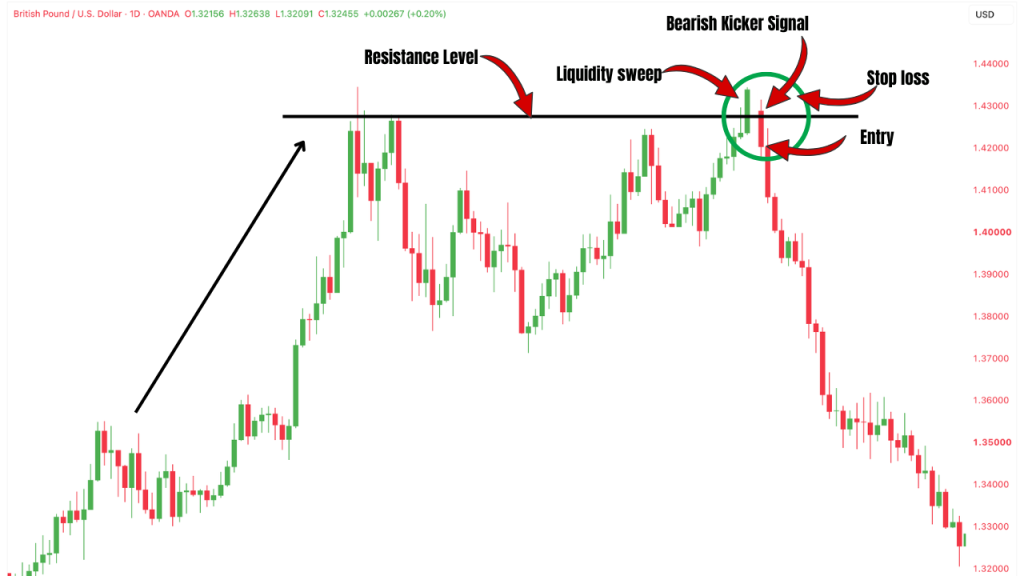
As you can see, the market was trending upward, meaning buyers were in control. Price then reached a level where it was rejected and moved lower, creating a resistance level.
Later, the market retraced back to this resistance level. Instead of simply rejecting it, price broke above the resistance and then closed back below it, forming what we call a liquidity sweep.
A liquidity sweep occurs when price temporarily moves beyond an important level, triggering orders and liquidity around that area, before quickly reversing back in the opposite direction.
Now look closely at the candlesticks forming around the liquidity sweep.
The first candle is bullish, showing that buyers are still pushing the market higher and have managed to break above the resistance level. However, the market then gaps down and forms a strong bearish candle below the resistance level.
Together, these two candles form the Bearish Kicker pattern.
This gives us two important signals at the same area: the liquidity sweep above resistance suggests that the breakout has failed, while the Bearish Kicker confirms a sudden shift from buying pressure to selling pressure.
To trade this setup, we can place the entry at the close of the bearish candle, with the stop loss above the liquidity sweep. The profit target can then be placed around the next important support level.
Look at what happened next. The market moved strongly to the downside, as expected, confirming the bearish reversal.
Bearish Kicker Continuation Strategy
This strategy might surprise you because, although the Bearish Kicker is commonly known as a reversal pattern, it can also be used as a continuation signal when it forms under the right market conditions.
Look at the chart example below.
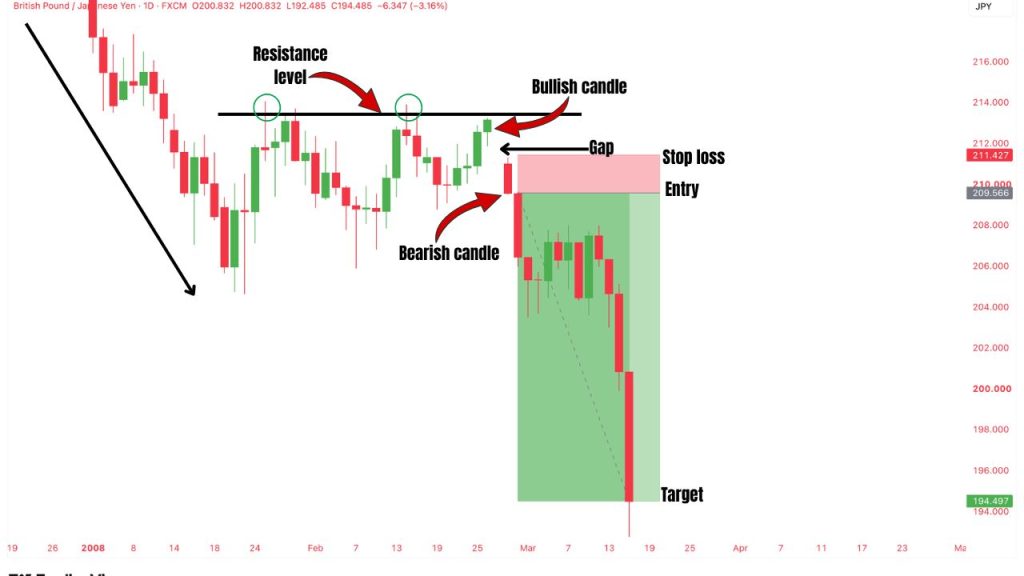
As you can see, the market was already trending downward, meaning sellers were in control. Price then entered a short consolidation and created a clear resistance level. The market tested this resistance twice and was rejected both times.
Later, price retraced back to the same resistance level for a third time.
This is where things become interesting.
A bullish candle formed near the resistance level, followed by a gap down and a strong bearish candle. Together, these two candles form the Bearish Kicker pattern.
In this case, the Bearish Kicker does not signal the reversal of an uptrend. Instead, it forms within an existing downtrend and around a resistance level, giving us a potential signal that sellers are stepping back in and that the larger bearish trend may continue.
To trade this setup, you can place your entry at the close of the bearish candle, with the stop loss above the resistance level. The profit target can be placed around the next important support level.
As you can see in the chart, sellers remained in control and the market continued moving lower, as expected.
This example shows why market context matters more than simply memorizing candlestick patterns. The same pattern can provide different information depending on where it forms and the overall direction of the market.
Conclusion
The Bearish Kicker candlestick pattern is a powerful price action signal that shows a sudden shift from buying pressure to selling pressure.
While it is mainly known as a bearish reversal pattern, it can also be used as a continuation signal when it forms during an existing downtrend.
However, identifying the pattern is only the first step. To find better trading opportunities, always consider where the pattern forms and the overall market context.
Combining the Bearish Kicker with resistance levels, liquidity sweeps, and the market trend can provide stronger confirmation and help you avoid low-quality setups.
Frequently Asked Questions About the Bearish Kicker Pattern
What is a Bearish Kicker candlestick pattern?
The Bearish Kicker is a two-candle pattern that signals a sudden shift from buying pressure to selling pressure. It typically consists of a bullish candle followed by a gap down and a strong bearish candle.
Is the Bearish Kicker a reversal pattern?
Yes. The Bearish Kicker is mainly considered a bearish reversal pattern, especially when it forms after an upward price move. However, it can also act as a continuation signal when it appears during a downtrend.
How do you trade a Bearish Kicker pattern?
One approach is to enter a short position after the bearish candle closes, place a stop loss above the pattern or nearby resistance level, and target the next important support level. The exact entry and risk management should depend on the overall market context.
Is the Bearish Kicker pattern reliable?
No candlestick pattern is reliable all the time. The Bearish Kicker becomes more meaningful when it forms at an important area, such as resistance, after a liquidity sweep, or within a clear bearish market structure.
What is the difference between a Bullish and Bearish Kicker?
A Bullish Kicker signals a sudden shift toward buying pressure, while a Bearish Kicker signals a sudden shift toward selling pressure. They are essentially opposite versions of the same candlestick formation.
Can a Bearish Kicker be used for trend continuation?
Yes. Although it is primarily known as a reversal pattern, a Bearish Kicker can also provide a bearish continuation signal when it forms during a downtrend, particularly around a resistance level or after a pullback.










1 thought on “Bearish Kicker Pattern: Meaning, Examples & Strategies”