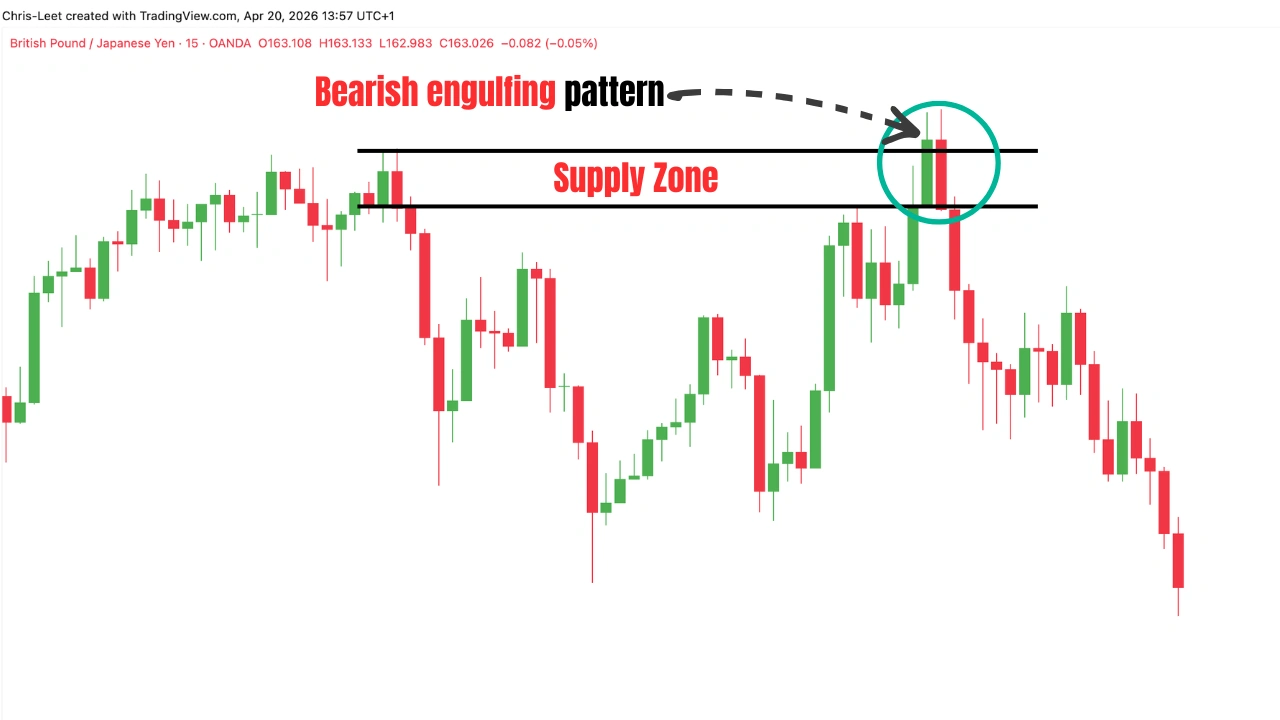
Many traders ask: how strong is a bearish engulfing pattern, and whether it can be trusted as a reliable signal.
A bearish engulfing pattern is a strong and reliable signal when it forms in the right market conditions.
However, it is not a holy grail and has its limitations. That’s why proper risk management and context are essential to trade it successfully.
In this blog post, you will learn when the bearish engulfing pattern is strong and when it is weak, so you can decide whether to take the trade or ignore it based on market conditions.
Before evaluating how strong this pattern is, it’s important to understand the difference between bullish and bearish engulfing patterns.
How Strong Is a Bearish Engulfing Pattern Based on Its Anatomy?
Before evaluating the strength of a bearish engulfing pattern, the first step is to confirm that it is valid.
The body of the second bearish candle must fully engulf the body of the previous bullish candle. If it does not, the pattern should be ignored, as it is not a true bearish engulfing pattern.
To better understand how a valid bearish engulfing pattern looks, you can study real market setups in these 12 bearish engulfing pattern examples.
Once the pattern is confirmed, its strength can be assessed based on its size and structure.

Larger bearish engulfing patterns are generally stronger because they reflect aggressive selling pressure and a significant shift in market momentum.
A large bearish candle engulfing the previous one shows that sellers have stepped in with conviction, overpowering buyers within a short period of time.
However, from a strategic perspective, smaller bearish engulfing patterns can sometimes offer better trading opportunities when they appear in the right market context.
This is because smaller candles allow for tighter stop-loss placement, which improves the risk-to-reward ratio.
In other words, while larger bearish engulfing patterns indicate stronger momentum, smaller ones can be more efficient from a risk management standpoint. The key is not just the size of the pattern, but how it fits within the overall market structure.
How Strong Is a Bearish Engulfing Pattern on Different Timeframes?
Not all bearish engulfing patterns are equal. The timeframe on which the pattern forms plays a major role in its strength and reliability.
A bearish engulfing pattern that forms on the daily timeframe is generally much stronger than one that appears on a one-minute chart.

This is because each candle on the daily timeframe represents 24 hours of trading activity, making the signal more significant and less affected by short-term fluctuations.
On lower timeframes, such as the one-minute chart, the market contains a lot of noise and false signals. As a result, bearish engulfing patterns on these smaller timeframes tend to be less reliable.

However, this does not mean that bearish engulfing patterns on lower timeframes should be ignored. Instead, they should be traded with additional confirmation and confluence factors, such as key levels, trend direction, or volume.
Timeframes like the 1-hour and 4-hour charts offer a good balance. Bearish engulfing patterns on these timeframes are still relatively strong and provide more reliable signals while allowing for more frequent trading opportunities.
In summary, the higher the timeframe, the stronger and more reliable the bearish engulfing pattern tends to be.
Lower timeframes can still be traded effectively, but they require more confirmation to filter out noise and improve accuracy.
Bearish Engulfing Pattern Strength: Continuation vs Reversal
A bearish engulfing pattern is generally more reliable as a continuation signal than as a reversal signal.
When the pattern forms during a downtrend, it is already supported by the overall market direction.
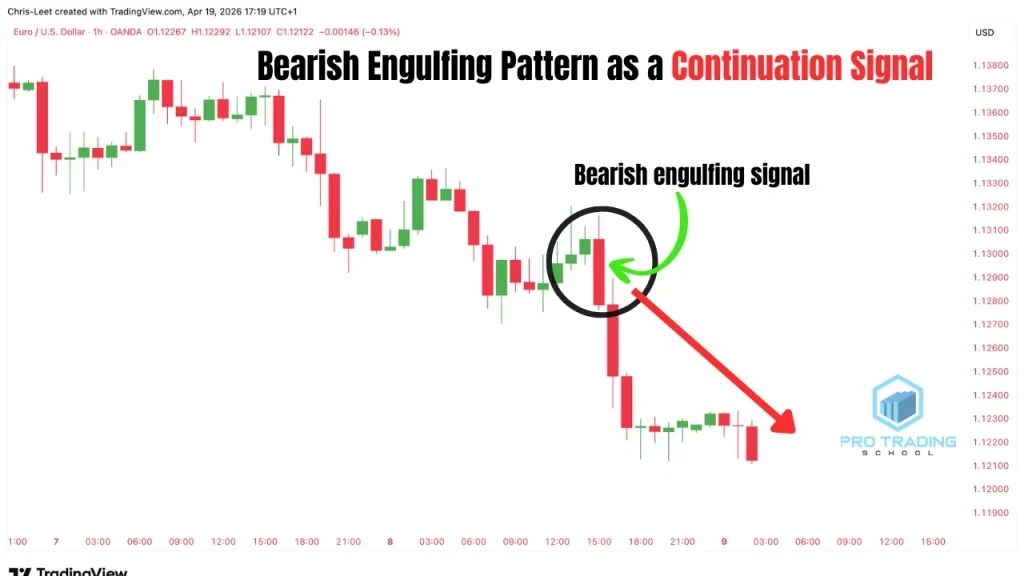
In this context, the bearish engulfing pattern simply provides an opportunity to join the existing trend, making it more reliable and easier to trade.
In contrast, using a bearish engulfing pattern as a reversal signal is riskier. Reversing a trend requires a significant shift in market structure and momentum, which usually needs additional confirmation.
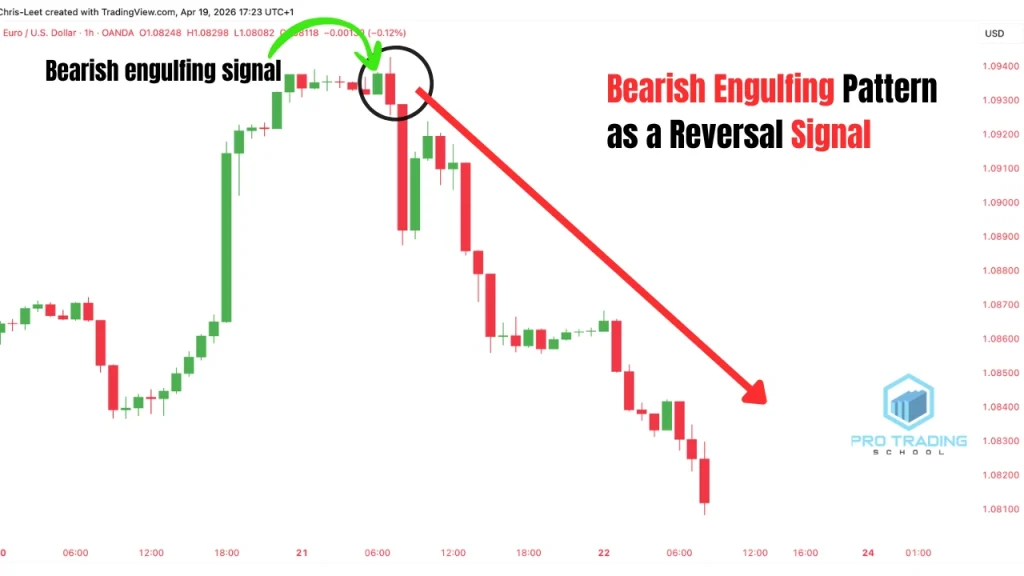
For example, a bearish engulfing pattern at the top of an uptrend may indicate a potential reversal, but it is not enough on its own.
Traders typically look for confluence factors such as strong resistance levels, liquidity sweeps, or higher timeframe confirmation before considering a reversal trade.
In summary, bearish engulfing patterns are generally stronger and more reliable in trend continuation setups, while reversal setups require more confirmation and should be approached with greater caution.
If you want to understand how to confirm this setup, go directly to this guide on what confirms a bearish engulfing pattern.
Bearish Engulfing Pattern Strength at Institutional Levels
Some of the strongest bearish engulfing patterns are those that form at institutional levels, because they are supported by the participation of large market players.
A bearish engulfing pattern that forms at a strong supply zone is generally stronger than one that forms at a simple resistance level.
This is because supply zones represent areas where institutions have previously entered the market with significant selling pressure, making them more likely to react again.
In addition, a bearish engulfing pattern becomes even more powerful when it forms after a buy-side liquidity sweep rather than at a random level.
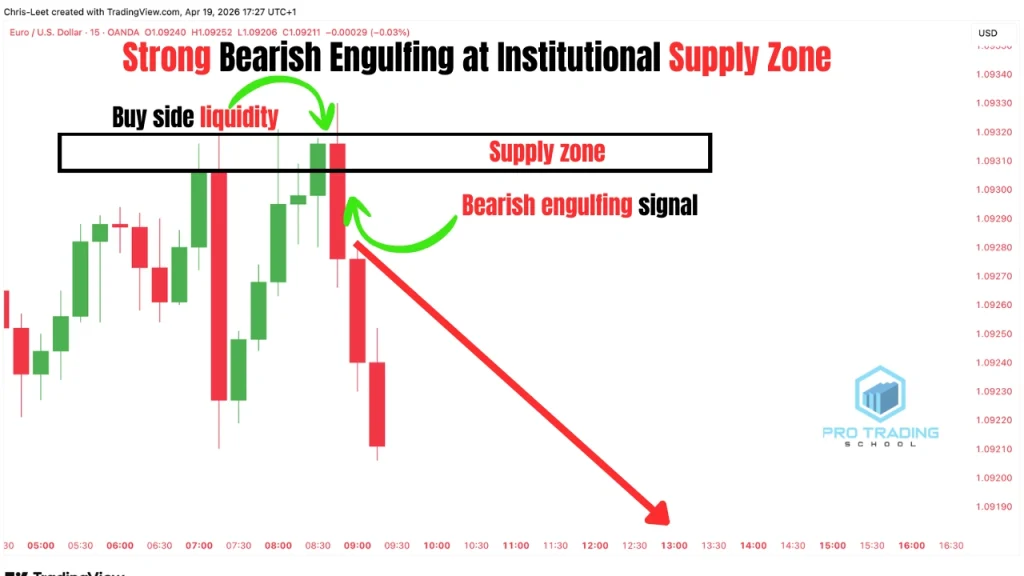
In this case, price moves above a key level to trigger stop-losses and breakout orders, then reverses and closes in the opposite direction.
This behavior reflects a common institutional tactic: collecting liquidity before initiating the real move.
As a result, the bearish engulfing pattern in this context carries more weight, as it signals not only selling pressure but also the presence of smart money activity.
In summary, the bearish engulfing pattern is significantly stronger when it forms at institutional levels such as supply zones or after liquidity sweeps, where market structure and participation align to support the move.
Which is stronger: bearish engulfing or shooting star?

In terms of anatomy and market psychology, the bearish engulfing pattern is generally stronger because it shows that sellers have completely taken control from buyers. It forms over two candles, confirming a clear shift in momentum.
In contrast, the shooting star represents strong rejection of higher prices. It is also a powerful signal, but it reflects rejection rather than full control by sellers.
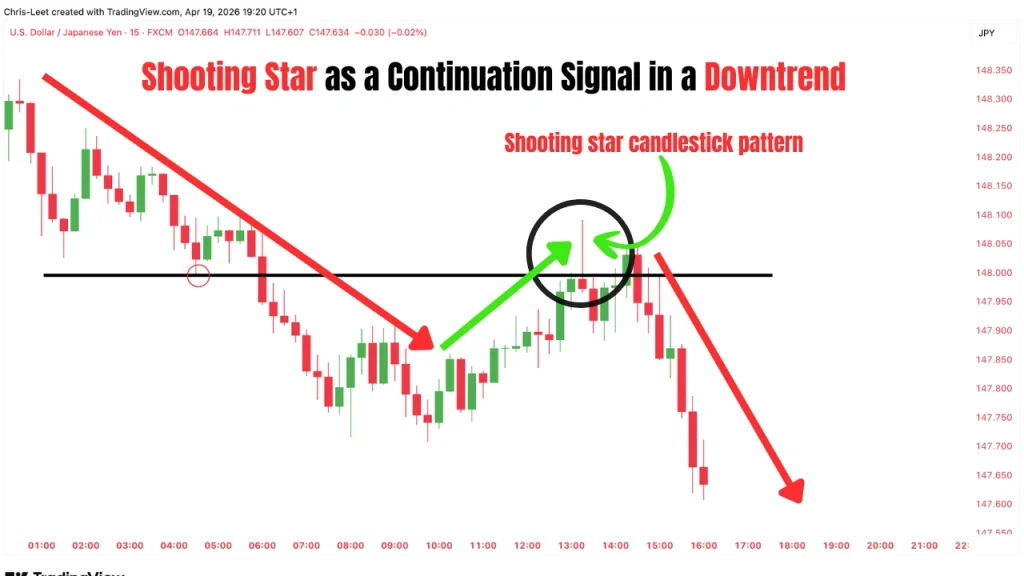
However, the strength of both patterns depends on market conditions. For example, a bearish engulfing pattern at the end of an uptrend—even at a resistance level—can be weaker than a shooting star that forms during a downtrend.
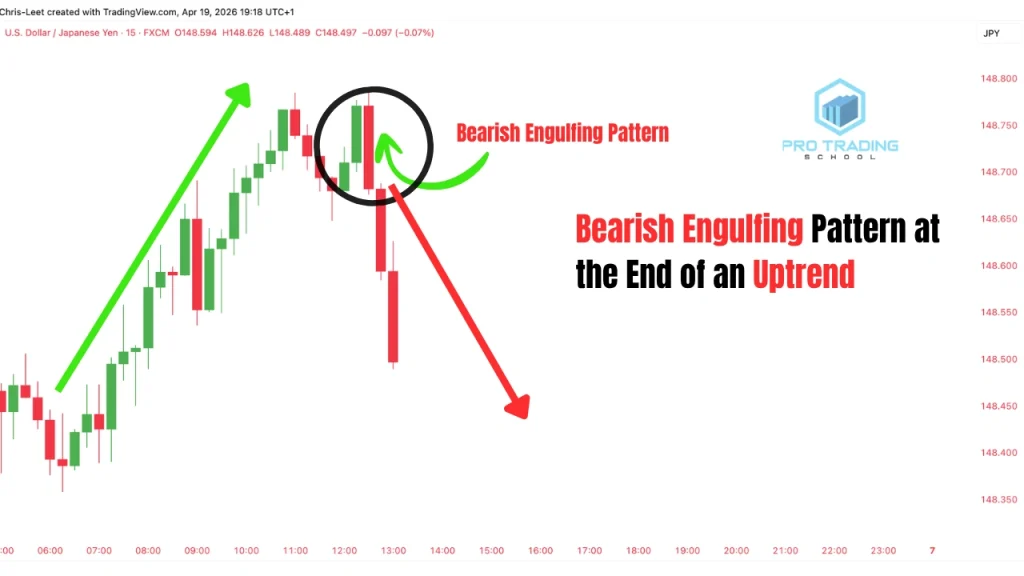
A bearish engulfing pattern at the top of an uptrend suggests a potential reversal, but reversals often require additional confirmation.
On the other hand, a shooting star forming at resistance after a retracement in a downtrend signals the continuation of the trend, which can make it more reliable in that context.
Both patterns can have similar strength when they appear at key levels and are supported by liquidity sweeps.
A bearish engulfing pattern that sweeps liquidity and closes lower shows strong seller dominance.
Similarly, a shooting star that sweeps liquidity and closes below a key level can also provide a high-probability signal.
As you can see, it is not always possible to say which pattern is stronger. Their effectiveness depends on market context, structure, and candle anatomy.
Bearish Engulfing Pattern vs Doji: Which Is Stronger?
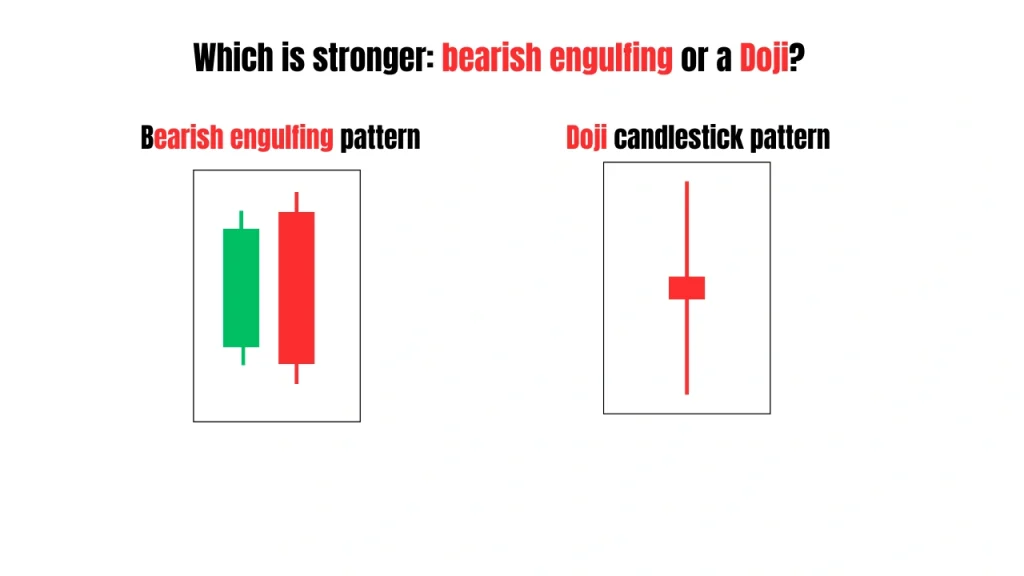
In terms of market psychology and the message behind the candle, the bearish engulfing pattern is generally stronger than a doji because it clearly shows seller dominance and strong selling pressure.
In contrast, a doji represents indecision or a pause in the market, where neither buyers nor sellers are in control.
If you compare the two signals—indecision versus clear seller dominance—it becomes obvious which one provides a more decisive directional bias.
However, in terms of risk-to-reward ratio, the doji can sometimes offer better opportunities. Because it is a small candle, it allows for tighter stop-loss placement, which can lead to a higher reward-to-risk ratio.
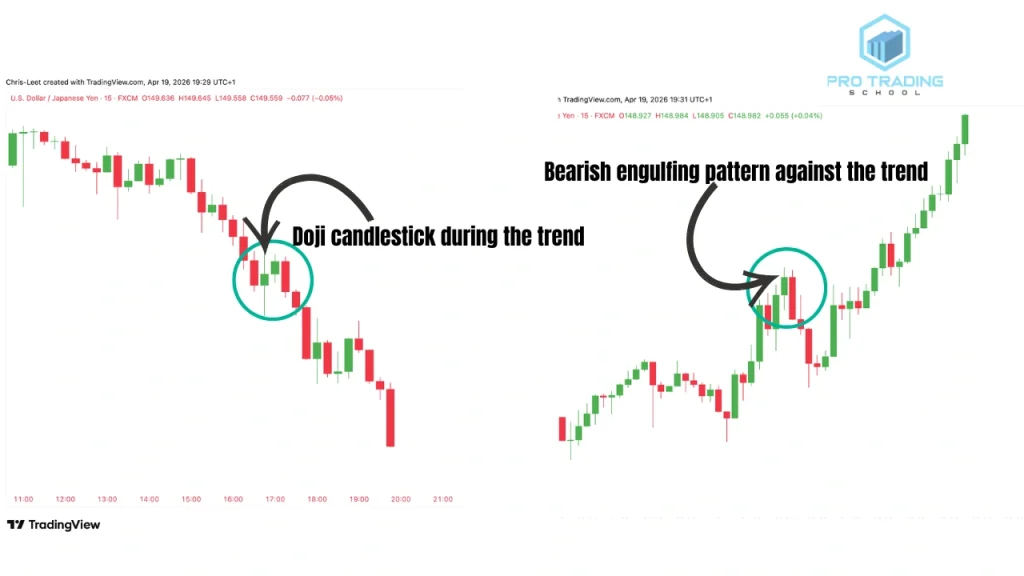
On the other hand, a large bearish engulfing pattern may require a wider stop loss, which can reduce the potential reward relative to risk.
That said, market context remains the most important factor. A doji that forms in the direction of the trend can be stronger than a bearish engulfing pattern that appears against the trend.
This is because the overall trend often has more influence on price movement than a single candlestick pattern.
In summary, the bearish engulfing pattern is stronger in terms of direction and confirmation, while the doji can be more efficient in terms of risk-to-reward. Ultimately, the strength of each pattern depends on how it aligns with the broader market context.
Which is stronger, a bearish engulfing pattern or a dark cloud cover pattern?
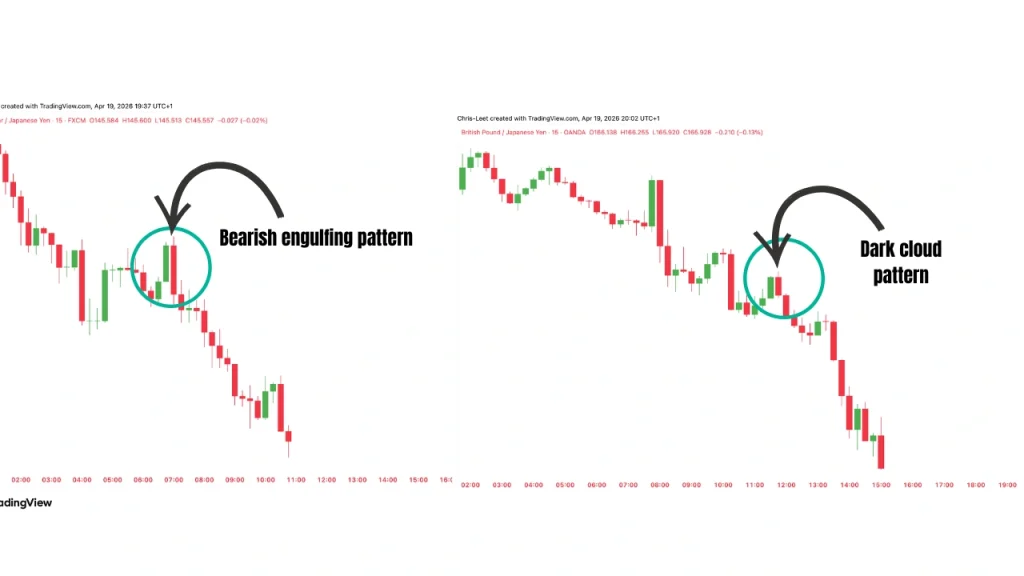
In terms of market psychology and signal strength, the bearish engulfing pattern is generally stronger than the dark cloud cover pattern.
This is because the bearish engulfing pattern clearly shows that sellers have taken full control from buyers, confirming strong selling pressure.
In contrast, the dark cloud cover pattern indicates that sellers are entering the market, but they are not yet fully dominant.
The second candle closes below the midpoint of the previous bullish candle, which suggests weakness from buyers, but not a complete shift in control.
Because of this, if the same signal appears on two different markets, many traders would prefer the bearish engulfing pattern, as it provides a clearer and more decisive confirmation. The dark cloud cover pattern often requires additional confirmation before taking a trade.
However, context still plays a key role. The dark cloud cover pattern can become stronger when it forms at a key liquidity level.
For example, if the second candle sweeps liquidity above a resistance level and then closes lower, it adds strength to the pattern.
In this situation, a dark cloud cover pattern combined with a liquidity sweep can be stronger than a bearish engulfing pattern that forms in a less significant area.
In summary, the bearish engulfing pattern is generally stronger in terms of clear seller dominance, while the dark cloud cover pattern can become powerful when supported by strong market context such as liquidity sweeps and key levels.
Bearish Engulfing Pattern vs Inside Bar: Which Is Stronger?

The bearish engulfing pattern is generally stronger than the inside bar in terms of anatomy and market message.
The bearish engulfing pattern consists of two candles, where the second bearish candle fully engulfs the previous bullish candle, indicating expansion and strong momentum.
In contrast, the inside bar is also a two-candle pattern, but the second candle is completely contained within the range of the first one, which indicates contraction and consolidation.
From a market psychology perspective, the bearish engulfing pattern shows a clear shift in control from buyers to sellers, while the inside bar reflects a pause, indecision, or temporary balance between both sides.
The bearish engulfing pattern is also more decisive because it does not require additional confirmation to signal potential direction.
On the other hand, the inside bar needs a breakout of its range to confirm the next move, making it a delayed signal rather than an immediate one.
As a result, the bearish engulfing pattern is generally stronger in terms of direction and momentum, while the inside bar is more useful for identifying consolidation and preparing for breakout opportunities.
If you want to master this setup from A to Z, you can explore the complete guide to the bearish engulfing candlestick pattern.
Conclusion
The bearish engulfing pattern is a strong and reliable signal, but its effectiveness depends on where and how it forms.
It becomes more powerful when aligned with the trend, supported by higher timeframes, and formed at key institutional levels such as supply zones or after liquidity sweeps.
On the other hand, when it appears in weak market conditions or against the trend, its reliability decreases and requires additional confirmation.
In the end, the bearish engulfing pattern is not about the candle itself, but about the context behind it. Understanding this allows traders to focus on high-probability setups and avoid unnecessary risks.










Hello mr chris since i start learning from you with zero fee my trading is going well
My god give you long life
My regards sir. I really appreciate the way you are dishing out lecture. I am still a beginner and I have been trying to download your ebook through the link to no avail. I really need it because I am from Cameroon particularly from the anglophone section which the epicenter of a 10yr civil war and internet and electricity are always disrupted every day. That will help me offline. I also need a mentor who can guide me as well. I will appreciate if you can help. Thank you
Wow you’re the best ❤️!!good explanation with not be greedy but helping us to be like you 🙏
Hello ..
Actually I was trying to download the e-book but unfortunately it’s not possible it’s showing an error I need your support kindly …
Thank you so much for helping us free of charge.God will highly bless you for the support you are rendering to us