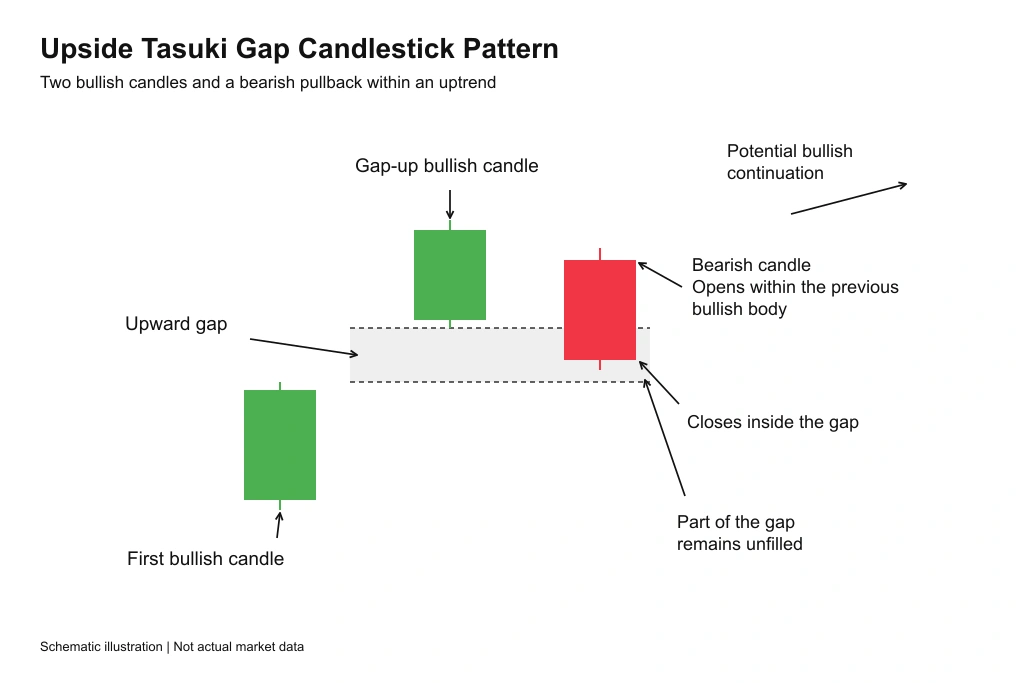
The Upside Tasuki Gap candlestick pattern is a bullish continuation pattern that forms during an uptrend and consists of three candles.
The first candle is bullish, followed by a second bullish candle that gaps above the first. The third candle is bearish: it opens within the body of the second candle and closes inside the gap, partially filling it without closing it completely.
This pattern suggests that the pullback may be temporary and that the existing uptrend could continue.
Upside Tasuki Gap Candlestick Pattern Example
The chart below illustrates how an Upside Tasuki Gap forms .
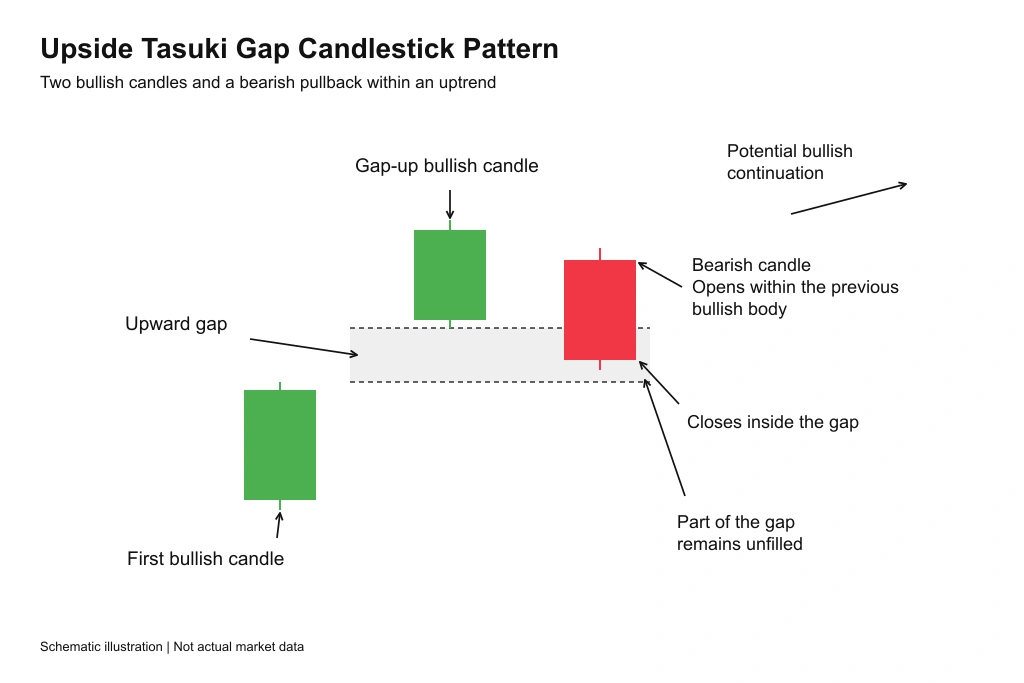
The pattern begins with a strong bullish candle, followed by a second bullish candle that gaps higher. This upward gap reflects continued buying pressure.
The third candle is bearish. It opens within the body of the second bullish candle and moves lower, closing inside the gap. However, it only partially fills the gap, leaving some of it open.
The highlighted formation shows the complete Upside Tasuki Gap pattern. Sellers’ failure to close the gap suggests that the pullback may be temporary and that the uptrend could resume.
Upside Tasuki Gap Candlestick Pattern Meaning
The Upside Tasuki Gap pattern suggests that buyers remain in control of the market despite a temporary pause in the upward move. look at the chart example below :
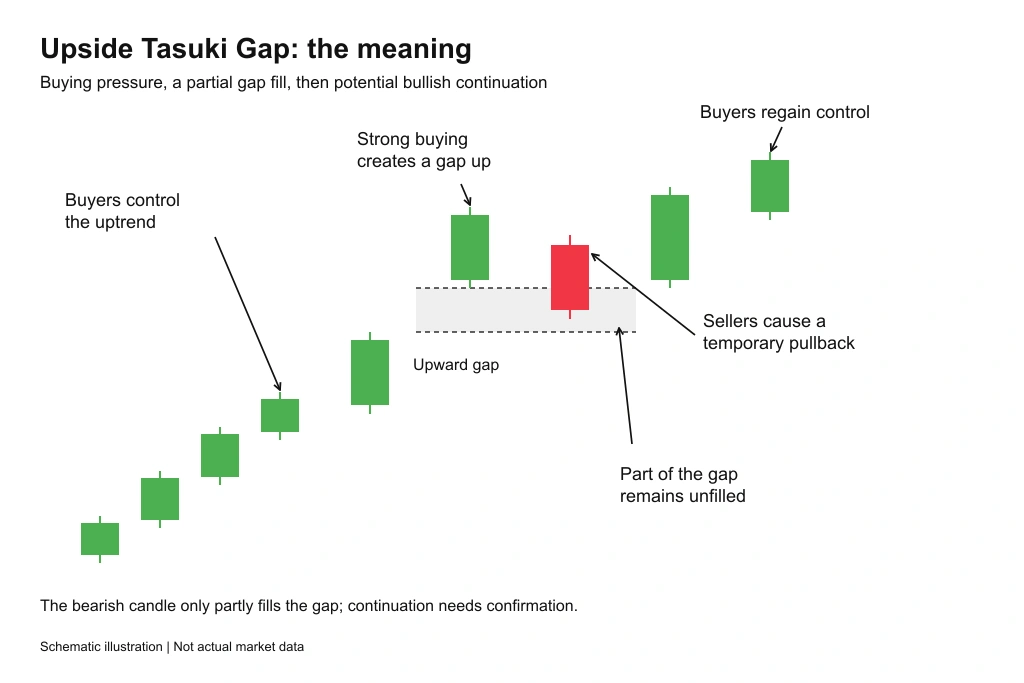
The first bullish candle reflects buying pressure within the existing uptrend.
The second bullish candle gaps higher, reinforcing the strength of that buying pressure.
The third bearish candle represents a pullback, which is common after a strong upward move.
However, it only partially fills the gap. Sellers’ failure to close the gap completely suggests that buyers may still have the upper hand and that the uptrend could continue.
Upside Tasuki Gap vs. Downside Tasuki Gap: Key Differences
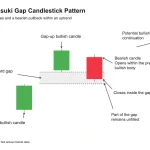
The chart below shows the two versions of the Tasuki Gap pattern side by side.
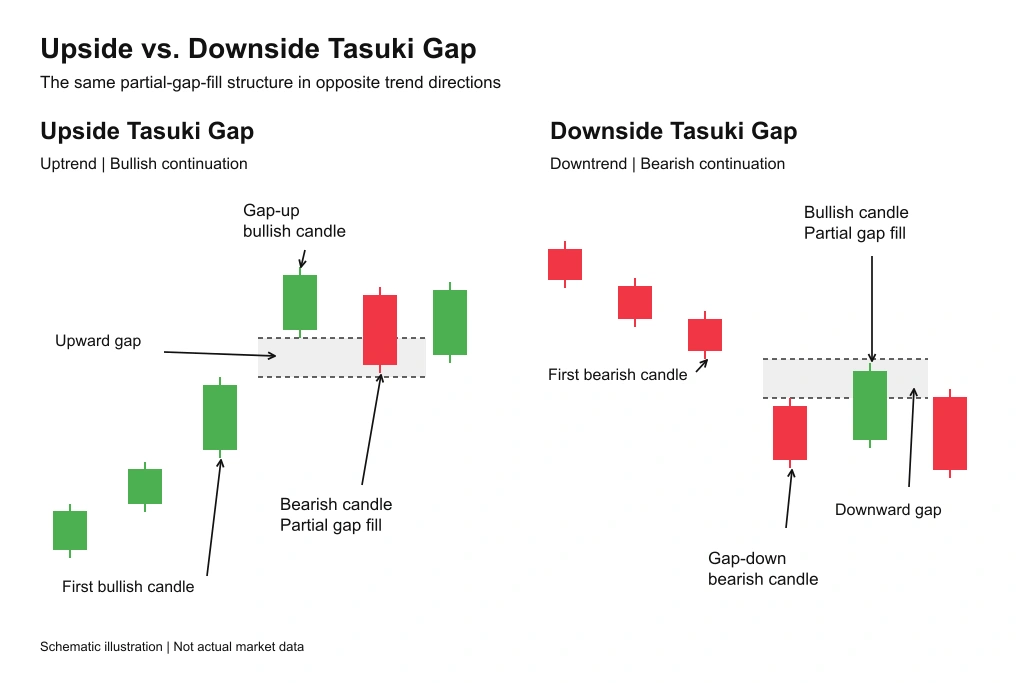
On the left, the Upside Tasuki Gap forms during an uptrend. It consists of two bullish candles with an upward gap between them, followed by a bearish candle that opens within the second candle’s body and closes inside the gap without completely filling it.
This pattern suggests that the upward trend may continue, as illustrated by the subsequent rise in price.
On the right, the Downside Tasuki Gap forms during a downtrend. It consists of two bearish candles with a downward gap between them, followed by a bullish candle that opens within the second candle’s body and closes inside the gap without completely filling it.
This pattern suggests that the downward trend may continue, as illustrated by the subsequent decline in price.
Both patterns represent a temporary pullback within an existing trend. The key difference is their direction: the Upside Tasuki Gap signals potential bullish continuation, while the Downside Tasuki Gap signals potential bearish continuation.
To learn about the bearish version of this pattern, read our guide to the Downside Tasuki Gap Candlestick Pattern, which explains its formation, meaning, and how to trade it during a downtrend.
Trading the Upside Tasuki Gap Pattern During an Uptrend
An uptrend shows that buyers have the upper hand. In this context, the Upside Tasuki Gap pattern can help you identify a potential opportunity to trade in the direction of the prevailing trend.
Look at the daily chart of the SPDR S&P 500 ETF Trust (SPY) below.
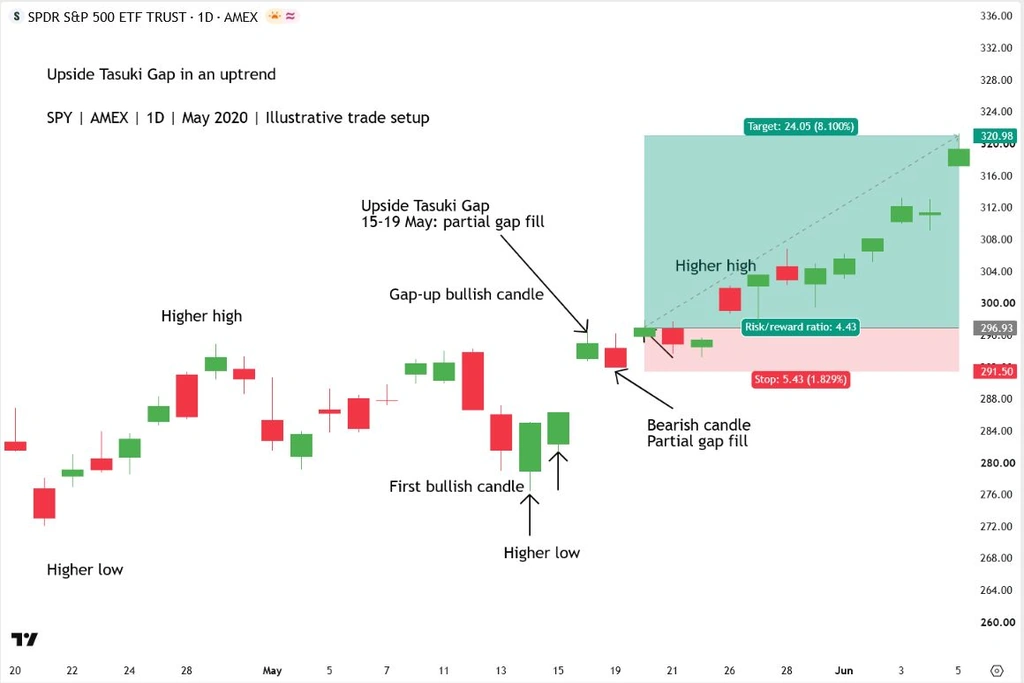
Price was already trending higher when an Upside Tasuki Gap pattern formed following a pullback.
The first bullish candle shows buying pressure returning after the pullback. The second bullish candle gaps higher, reinforcing the strength of the upward move.
The third candle is bearish, but it fails to close the gap completely. This suggests that the selling pressure may represent a temporary pause within the uptrend.
In this example, price subsequently resumes its upward move.
Entry, Stop Loss, and Target
One way to approach this setup is to wait for a bullish confirmation candle after the third candle of the pattern. Rather than entering automatically on the next candle, look for renewed buying pressure.
For the trade illustrated below, the entry is at the close of that confirmation candle. The stop loss is placed below the low of the pattern, and the target is set near the next resistance level.
Before entering, check that the distance to your target offers a suitable reward relative to your risk.
As the chart shows, price continued higher after the entry, making this a successful example of the setup.
However, the Upside Tasuki Gap is not a guaranteed signal. Like any candlestick pattern, it can fail. Use a predefined stop loss and size your position according to the amount you are willing to risk if the trade moves against you.
Pros and Cons of the Upside Tasuki Gap Candlestick Pattern
The Upside Tasuki Gap candlestick pattern can help traders identify potential continuation opportunities during an uptrend, but it also has limitations.
Understanding its strengths and weaknesses can help you decide how to incorporate it into your trading strategy. The table below summarizes its main pros and cons.
| Pros | Cons |
|---|---|
| Clear formation: Its three-candle structure and partially unfilled gap provide specific identification criteria. | Relatively uncommon: The gap requirement limits how frequently the pattern appears. |
| Follows the prevailing trend: It helps identify potential continuation opportunities within an established uptrend. | Requires trend context: The formation alone is insufficient without a clear existing uptrend. |
| Highlights a potential pause: The third candle helps traders recognize a pullback that may precede further upside. | Continuation is not guaranteed: Price can reverse and close the remaining gap. |
| Supports trade planning: The pattern’s low can serve as a reference when planning a stop loss. | Reward may be limited: Nearby resistance can leave insufficient upside relative to the risk. |
| Can complement other analysis: It can be combined with price structure, volume, and resistance levels. | Confirmation can delay entry: Waiting for renewed buying pressure may result in a higher entry price. |
Common Mistakes When Trading the Upside Tasuki Gap
Recognizing the Upside Tasuki Gap is only one part of evaluating a trade. Here are some common mistakes to avoid when using this pattern.
Ignoring the Existing Trend
The Upside Tasuki Gap is a bullish continuation pattern, so it should appear within an established uptrend.
A similar formation in a sideways or declining market does not provide the same continuation context. Check the surrounding price structure rather than focusing only on the three candles.
Confusing a Fully Filled Gap with a Valid Pattern
The third bearish candle should open within the second candle’s body and close inside the gap, leaving part of it unfilled. If it completely closes the gap, the formation no longer meets the pattern’s criteria.
Entering Without a Clear Trigger
The pattern suggests potential continuation, but it does not guarantee an immediate rally. If your strategy requires confirmation, wait for renewed buying pressure rather than entering automatically after the third candle. Define your entry condition before taking the trade.
Overlooking Nearby Resistance
A valid pattern can still offer an unattractive trade if resistance is close to your entry. Identify the next resistance level and compare the potential reward with the distance to your stop loss before committing.
Risking Too Much on One Setup
Even a well-formed Upside Tasuki Gap can fail. Set your stop loss and calculate your position size before entering so that a losing trade stays within your planned risk. Avoid increasing your position simply because the pattern looks convincing.
Conclusion
The Upside Tasuki Gap is a three candle bullish continuation pattern that forms during an uptrend.
Its defining feature is a bearish third candle that partially fills the upward gap without closing it completely, suggesting a temporary pullback rather than a change in direction.
To use this pattern effectively, consider the surrounding trend, look for confirmation according to your strategy, and check nearby resistance before entering.
No candlestick pattern guarantees success, so combine your analysis with a predefined stop loss and appropriate position sizing.










1 thought on “Upside Tasuki Gap: How to Identify and Trade It”