The Three Black Crows candlestick pattern is a bearish chart pattern made up of three consecutive bearish candles.
It usually appears after a strong upward move and warns that market sentiment may be shifting from bullish to bearish.
The pattern begins with a bearish candle that signals the first signs of selling pressure. The second bearish candle shows that sellers are gaining confidence and pushing prices lower.
The third bearish candle strengthens the signal by confirming that sellers are firmly in control of the market.
When these three candles form in sequence, they often indicate that the uptrend is losing momentum and that a bearish reversal may be developing.
Although the Three Black Crows is most commonly associated with trend reversals, it can also appear as a continuation signal within an existing downtrend.
In this case, the pattern forms after a temporary pullback to a resistance area, suggesting that sellers are stepping back into the market and that the downward trend may continue.
For this reason, traders primarily use the Three Black Crows pattern to spot potential bearish reversals, but it can also provide valuable confirmation when trading pullbacks in a downtrending market.
Key Takeaways
-The Three Black Crows is a bearish candlestick pattern that consists of three consecutive bearish candles.
-The pattern typically forms after an uptrend and signals that sellers may be taking control of the market.
-It reflects a shift in market sentiment from bullish to bearish.
-The Three Black Crows pattern can be used to identify potential trend reversal opportunities.
-The pattern becomes more reliable when combined with support and resistance levels, liquidity sweeps, or trend line breaks.
-Traders often enter at the close of the third candle and place a stop loss above the pattern.
-Like all candlestick patterns, the Three Black Crows should be used alongside proper risk management and additional confirmation.
Three Black Crows Candlestick Pattern Example
To help you recognize the Three Black Crows candlestick pattern on a real chart, let’s look at a practical example and break down what is happening behind the scenes.
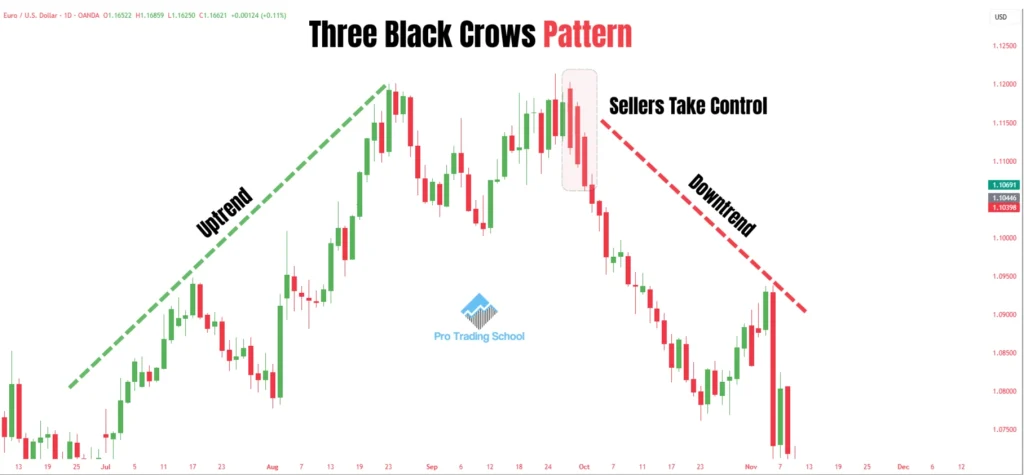
In the chart above, the market is moving higher, which tells us that buyers are in control. However, after reaching a new high, the market forms a double top pattern.
This is an important warning sign because it shows that buyers are struggling to push prices any higher. If buyers were still in complete control, the market would continue making higher highs.
Shortly after the double top forms, the Three Black Crows pattern appears.
The first bearish candle signals the beginning of selling pressure and suggests that sellers are starting to challenge the uptrend.
The second bearish candle confirms that sellers are becoming more aggressive and are successfully pushing prices lower.
The third bearish candle provides additional confirmation that the balance of power has shifted. At this stage, buyers are losing control, while sellers are taking over the market.
As a result, the Three Black Crows pattern often signals the start of a bearish move and a potential trend reversal.
It is important to understand that the Three Black Crows pattern does not always appear with large bearish candles like the example shown in this guide.
In many cases, the three candles may be smaller and more compact. In fact, these tighter formations can sometimes offer excellent trading opportunities because they allow traders to place a smaller stop loss while maintaining a favorable risk-to-reward ratio.
The key is not the size of the candles but the story they tell: buyers are losing strength, sellers are gaining confidence, and market sentiment is shifting from bullish to bearish.
What Does the Three Black Crows Candlestick Pattern Mean?
The Three Black Crows candlestick pattern signals that market sentiment may be shifting from bullish to bearish.
When this pattern appears after an uptrend, it suggests that buyers are losing momentum and sellers are beginning to take control of the market.
In simple terms, the pattern tells us two important things:
- Buyers are no longer able to push prices higher with the same strength as before.
- Sellers are becoming more aggressive and may be preparing to drive the market lower.
Let’s look at the psychology behind the pattern.

In the example above, the market is trending upward, which means buyers are clearly in control. However, after reaching a high, the market forms a double top.
This is an early warning sign that buying pressure is weakening. If buyers were still fully in control, the market would continue making higher highs instead of struggling at the same level.
The first bearish candle of the Three Black Crows pattern reveals the first wave of selling pressure. At this point, sellers are attempting to reverse the trend, but traders should remain cautious because the previous trend was bullish.
The second bearish candle provides additional confirmation that sellers are gaining strength. It shows that bearish momentum is increasing and that buyers are finding it more difficult to defend the uptrend.
The third bearish candle is often the most important because it confirms the shift in market control. By this stage, sellers have established dominance, buyers have lost momentum, and the probability of a bearish trend reversal increases significantly.
However, the Three Black Crows pattern alone should not be used as the sole reason to enter a trade.
Like all candlestick patterns, it becomes much more reliable when combined with other forms of technical analysis, such as support and resistance levels, trendlines, supply and demand zones, moving averages, or momentum indicators.
When used as part of a complete trading strategy, the Three Black Crows pattern can help traders identify high-probability setups with attractive risk-to-reward opportunities.
If you want to learn more candlestick patterns and how to trade them, check out our 33 Candlestick Patterns Cheat Sheet (Simple Visual Guide), where you’ll find the most important bullish and bearish candlestick patterns explained with easy-to-understand chart examples.
Three White Soldiers vs Three Black Crows Candlestick Pattern
The Three White Soldiers and the Three Black Crows are two of the most popular candlestick patterns used by traders to identify potential trend reversals.
Although they look different, they tell a very similar story. Both patterns signal a shift in market control from one group of traders to another.
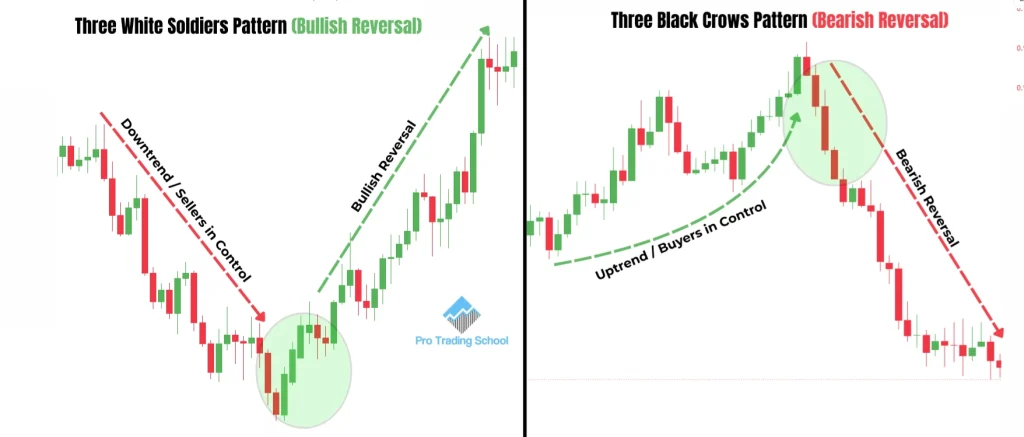
The Three White Soldiers pattern is a bullish reversal pattern that forms after a downtrend. It consists of three consecutive bullish candles and suggests that sellers are losing strength while buyers are becoming more aggressive.
The first bullish candle shows the first signs of buying pressure entering the market. The second candle confirms that buyers are gaining confidence and are willing to push prices higher.
The third candle provides strong confirmation that the balance of power has shifted. At this point, sellers are no longer in control, and the market is likely preparing for a move higher.
The Three Black Crows pattern tells the opposite story. Instead of appearing after a downtrend, it forms after an uptrend and signals that buying pressure is fading.
The first bearish candle warns that sellers are beginning to challenge the existing uptrend. The second candle confirms that sellers are becoming more aggressive and are successfully pushing prices lower.
The third candle provides additional confirmation that buyers have lost control of the market and that a bearish reversal may be developing.
When you compare these two patterns side by side, you will notice that they are essentially mirror images of each other.
The Three White Soldiers signals a potential reversal from a downtrend to an uptrend, while the Three Black Crows signals a potential reversal from an uptrend to a downtrend.
If you want to learn the bullish counterpart of the Three Black Crows, be sure to read our Three White Soldiers Candlestick Pattern: Meaning & Strategy guide, where we explain how traders use this pattern to identify potential bullish reversals.
Understanding the relationship between these two patterns can help you read market sentiment more effectively.
While both patterns reflect a shift in market control, they differ in their formation, market context, and trading implications.
Understanding these differences can help you quickly determine whether buyers or sellers are gaining momentum and what the market is likely to do next.
To make the comparison easier, the table below highlights the key characteristics of the Three White Soldiers and the Three Black Crows candlestick patterns.
| Feature | Three White Soldiers | Three Black Crows |
|---|---|---|
| Pattern Type | Bullish reversal pattern | Bearish reversal pattern |
| Market Context | Forms after a downtrend | Forms after an uptrend |
| Number of Candles | Three consecutive bullish candles | Three consecutive bearish candles |
| Market Message | Buyers are gaining control | Sellers are gaining control |
| Psychology | Selling pressure is fading and demand is increasing | Buying pressure is weakening and supply is increasing |
| Expected Outcome | Potential trend reversal to the upside | Potential trend reversal to the downside |
| Trader Sentiment | Growing optimism among buyers | Growing confidence among sellers |
| Best Location | Near a support level, demand zone, or major swing low | Near a resistance level, supply zone, or major swing high |
| Confirmation Signal | Bullish breakout, higher highs, or strong buying volume | Bearish breakdown, lower lows, or strong selling volume |
| Common Trading Use | Looking for buying opportunities | Looking for selling opportunities |
| Reliability | More reliable when combined with bullish confluence factors | More reliable when combined with bearish confluence factors |
| Risk Management | Stop loss is often placed below the pattern’s low | Stop loss is often placed above the pattern’s high |
| Ideal Market Condition | Markets showing signs of accumulation after a decline | Markets showing signs of distribution after an advance |
| Main Advantage | Helps identify the early stages of a bullish trend | Helps identify the early stages of a bearish trend |
| Main Limitation | Can fail during strong downtrends | Can fail during strong uptrends |
| Relationship | Bullish counterpart of the Three Black Crows | Bearish counterpart of the Three White Soldiers |
Three Black Crows Trading Strategies
The Three Black Crows candlestick pattern can be traded in several ways, but some setups are more reliable than others. One of the most effective approaches is to trade the pattern when it forms during a range-bound market and confirms a breakout below a key support level.
The Three Black Crows Pattern During a Range-Bound Market
Trading the Three Black Crows pattern in a range-bound market can provide high-probability trading opportunities because it allows traders to identify the transition from consolidation to a potential downtrend.
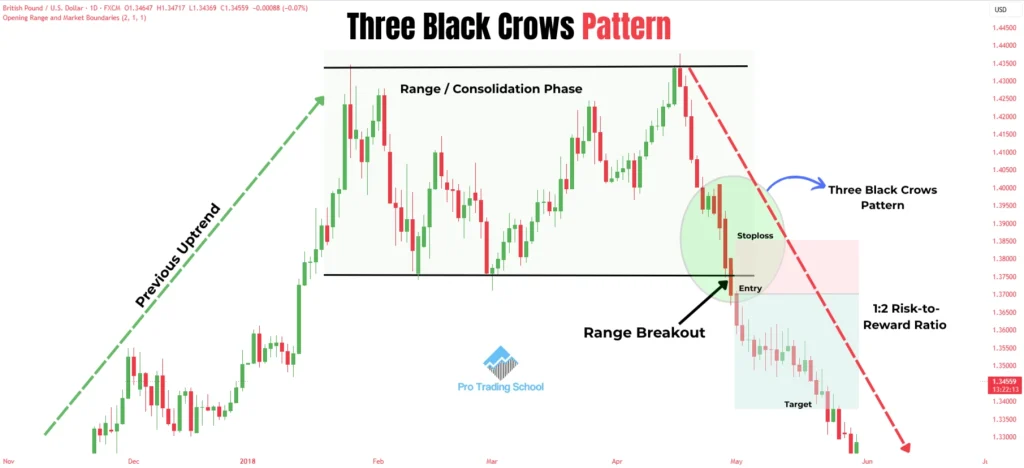
As you can see in the chart example, the market was previously moving higher before entering a trading range.
This change in behavior suggests that buyers are no longer in complete control of the market. Instead of continuing to make higher highs, price begins moving sideways as buying and selling pressure become more balanced.
During this phase, early buyers may start taking profits while larger market participants gradually distribute their positions.
The breakout from the range is the event traders should focus on because it often signals the beginning of a new trend.
In this example, the Three Black Crows pattern forms near the lower boundary of the range. The first bearish candle signals growing selling pressure, the second candle confirms that sellers are gaining momentum, and the third candle breaks below the support level of the range.
This breakout suggests that sellers have taken control and that the market may be preparing for a move lower.
To trade this setup, an entry can be placed at the close of the third bearish candle. The stop loss can be positioned above the broken support level, which now has the potential to act as resistance, or above the high of the pattern.
If price moves back into the range, it is often a sign that the breakout has failed and that the bearish setup is no longer valid.
The profit target can be placed at the next significant support level or key price area below the breakout point.
One of the biggest advantages of this strategy is that it allows you to participate in the market at the moment momentum shifts in favor of sellers.
In addition, the breakout provides a logical location for stop-loss placement, making it easier to manage risk while maintaining an attractive risk-to-reward ratio.
When combined with strong support and resistance levels, the Three Black Crows range-breakout strategy can become a powerful tool for identifying potential trend reversals and high-quality selling opportunities.
Trading the Three Black Crows with a Liquidity Sweep
One of the most effective ways to trade the Three Black Crows pattern is to combine it with a liquidity sweep.
This approach allows traders to identify potential institutional activity and enter the market when the probability of a trend reversal increases.
The idea behind this strategy is simple. Large market participants need liquidity to enter and exit positions.
As a result, they often push price beyond obvious support or resistance levels to trigger stop-loss orders and attract breakout traders before moving the market in the opposite direction.
To find this setup, start by looking for a strong uptrend. As the market moves higher, many retail traders become increasingly confident that the trend will continue. However, instead of chasing the market, you should wait for signs that buyers are losing control.
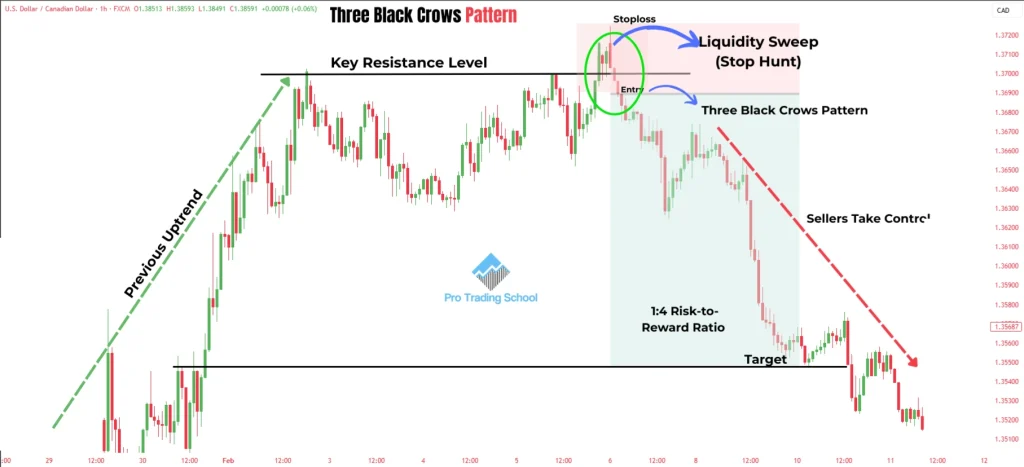
In the chart example above, the market is trending upward and eventually reaches a resistance level. Price initially reacts to the resistance and moves lower.
Later, the market rallies again, breaks above the resistance level, and then quickly closes back below it. This is known as a liquidity sweep.
The liquidity sweep is important because it traps breakout traders who entered long positions above resistance while also triggering the stop losses of traders who were short. This creates the liquidity that large market participants often need to enter sizable positions.
After the liquidity sweep occurs, the Three Black Crows pattern begins to form. The first bearish candle signals the emergence of selling pressure.
The second candle confirms that sellers are becoming more aggressive. The third candle provides additional confirmation that the market is rejecting higher prices and that a bearish reversal may be underway.
To trade this setup, an entry can be placed at the close of the third bearish candle.
The stop loss is typically placed above the high of the liquidity sweep because a move above that level would invalidate the bearish idea.
The profit target can be placed at the next significant support level or key price area below the market.
What makes this strategy particularly powerful is the combination of two bearish signals: a liquidity sweep that traps traders on the wrong side of the market and a Three Black Crows pattern that confirms strong selling pressure.
When these factors align, they can create high-quality trading opportunities with attractive risk-to-reward ratios.
Trade the Three Black Crows Pattern with a Trend Line Break
Another effective way to trade the Three Black Crows pattern is to combine it with a trend line break. This strategy helps traders identify the moment when an uptrend begins to weaken and sellers start taking control of the market.
The setup is straightforward. First, look for a market that is trending upward and forming a clear ascending trend line.
As long as price continues to respect the trend line, buyers remain in control. However, when the trend line is broken, it often signals that bullish momentum is fading and that a trend reversal may be developing.
Look at the chart example below.
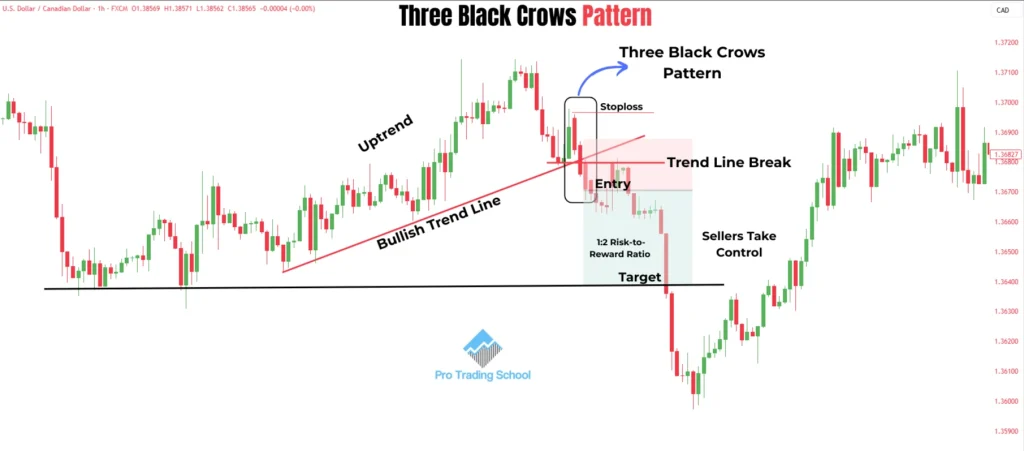
As you can see, the market was moving higher while respecting an upward trend line. Each time price retraced, buyers stepped in and pushed the market higher. This behavior confirmed that the trend was still intact.
However, the situation changed when the Three Black Crows pattern began to form near the trend line.
The first bearish candle signaled the emergence of selling pressure. The second candle broke below the trend line, providing the first indication that buyers were losing control. The third bearish candle confirmed the breakout and strengthened the bearish signal.
To trade this setup, an entry can be placed at the close of the third bearish candle. The stop loss can be positioned above the high of the pattern or above the breakout candle.
If price moves back above the broken trend line, the bearish setup may no longer be valid. The profit target can be placed at the next significant support level or key price area below the market.
One of the main advantages of this strategy is that it combines two bearish signals: the Three Black Crows pattern and the break of a well-established trend line. When both signals occur together, they can provide strong evidence that market sentiment is shifting from bullish to bearish.
Important Note
The Three Black Crows pattern is not a holy grail, and like every trading strategy, it has limitations. There will be times when the pattern fails and the market moves in the opposite direction.
For this reason, risk management is essential. Always use a stop loss and never risk more than you can afford to lose on a single trade. Entering the market without a predefined exit plan can expose your account to unnecessary losses.
Successful trading is not about winning every trade. It is about managing risk, protecting your capital, and ensuring that your winning trades are larger than your losing trades over the long run.
Three Black Crows Candlestick Pattern: Pros and Cons
Like any technical analysis tool, the Three Black Crows candlestick pattern has both strengths and weaknesses.
While it can provide valuable insights into market sentiment and potential trend reversals, it should not be used in isolation.
Understanding its advantages and limitations will help you decide when the pattern is worth trading and when additional confirmation may be needed.
The table below summarizes the main pros and cons of the Three Black Crows candlestick pattern.
| Pros | Cons |
|---|---|
| Easy to identify on a price chart. | Can produce false signals, especially in volatile markets. |
| Provides a clear visual indication that sellers are gaining control. | Does not guarantee that a trend reversal will occur. |
| Works across different markets, including stocks, forex, commodities, and cryptocurrencies. | Can appear after a significant decline, leaving limited room for further downside. |
| Can be combined with support and resistance levels, trendlines, and other technical tools. | Less reliable when traded without confirmation from other forms of analysis. |
| Often offers attractive risk-to-reward opportunities when traded near key levels. | May trigger premature entries if traders enter before confirmation. |
| Helps traders understand the shift in market sentiment from bullish to bearish. | Can fail during strong bullish trends where buyers quickly regain control. |
| Suitable for multiple trading styles, including swing trading and position trading. | Not ideal as a standalone trading strategy. |
| Provides clear locations for entry, stop-loss placement, and profit targets. | Requires proper risk management to avoid large losses when the setup fails. |
| Can signal the beginning of major trend reversals. | Performance varies depending on market conditions and context. |
| Works particularly well when combined with liquidity sweeps, range breakouts, or trend line breaks. | New traders may misidentify the pattern and enter low-quality setups. |
Key Takeaway
The biggest advantage of the Three Black Crows pattern is its ability to highlight a potential shift in control from buyers to sellers.
However, its effectiveness increases significantly when it is combined with other technical analysis tools such as support and resistance levels, liquidity sweeps, trend lines, or volume analysis. Rather than relying on the pattern alone, traders should view it as one piece of evidence within a complete trading strategy.
Conclusion
The Three Black Crows candlestick pattern is a powerful bearish reversal signal that helps traders identify when sellers are taking control of the market.
While the pattern can provide high-quality trading opportunities, it works best when combined with other technical analysis tools such as support and resistance levels, liquidity sweeps, and trend line breaks. Most importantly, always use proper risk management because no trading pattern works 100% of the time.
Frequently Asked Questions
How Accurate Is the Three Black Crows Pattern?
The accuracy of the Three Black Crows pattern depends on market conditions and how it is used. The pattern tends to be more reliable when it forms after a strong uptrend and near key resistance levels.
Its probability of success can increase further when combined with other technical analysis tools such as support and resistance, trend lines, liquidity sweeps, or volume analysis. However, like all candlestick patterns, it is not guaranteed to work every time and should always be used alongside proper risk management.
How Can You Avoid False Three Black Crows Signals?
One of the best ways to avoid false signals is to wait for confirmation before entering a trade. Instead of trading the pattern in isolation, look for additional evidence that sellers are taking control.
This may include a break below a support level, a liquidity sweep above resistance, a trend line break, or increased selling volume. Trading the pattern within a broader technical analysis framework can significantly improve its reliability.
What Is the Three White Soldiers and Three Black Crows Strategy?
The Three White Soldiers and Three Black Crows strategy focuses on trading potential trend reversals.
Traders look for the Three White Soldiers pattern after a downtrend to identify buying opportunities and the Three Black Crows pattern after an uptrend to identify selling opportunities.
The strategy becomes more effective when these patterns form near key support or resistance levels and are confirmed by additional technical signals.
What Happens After Three Black Crows?
After the Three Black Crows pattern forms, the market often experiences increased selling pressure and may begin a bearish trend reversal. The pattern suggests that buyers are losing control while sellers are gaining momentum.
However, the market does not always move lower immediately. In some cases, price may consolidate or retest a key level before continuing downward. This is why traders often wait for confirmation before entering a trade.