The Tower Bottom candlestick pattern is a bullish reversal formation that can signal a potential recovery after a downtrend. It tells a simple story: sellers push prices lower, the decline slows, and buyers begin to step in.
But spotting the pattern alone isn’t enough. Understanding where it forms and what the surrounding price action shows can help you make better trading decisions.
In this guide, you’ll learn how to identify the Tower Bottom pattern, understand the psychology behind it, and use it with support levels, demand zones, and moving averages.
Tower Bottom Candlestick Pattern Example
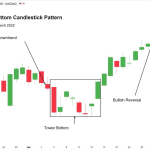
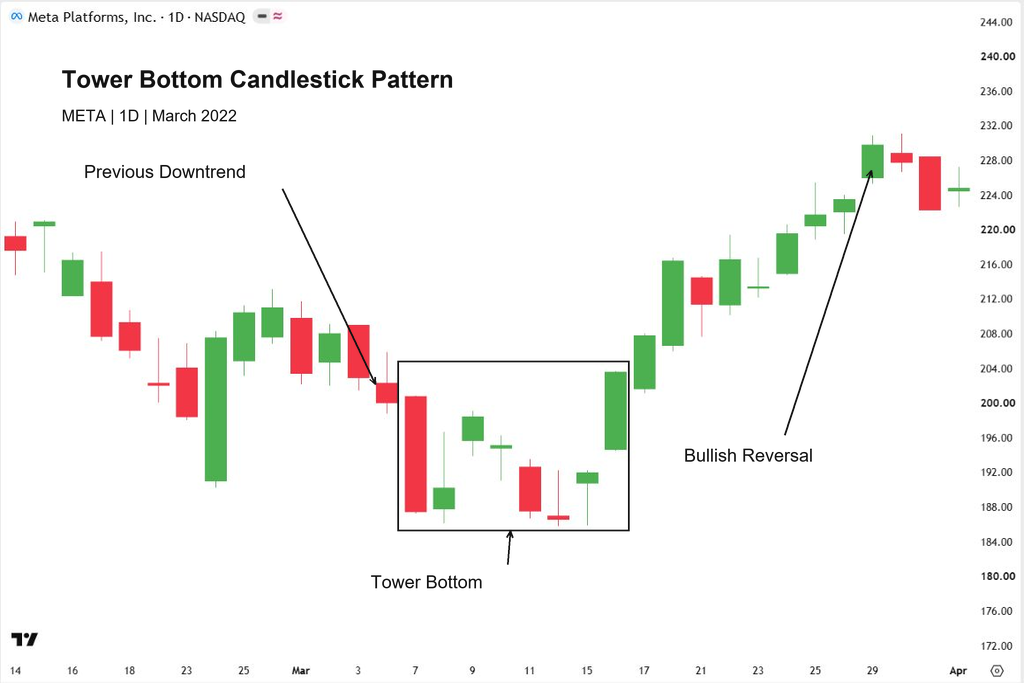
The chart above shows a Tower Bottom candlestick pattern on the Meta Platforms (META) daily chart, forming between March 7 and March 16, 2022.
Before the pattern develops, price is moving lower. A strong bearish candle then pushes the market toward $188, showing that sellers are still in control.
Over the following sessions, several smaller-bodied candles form near the lows. Price fluctuates within this base without extending the decline significantly.
This suggests that selling pressure is weakening, although buyers have yet to establish a clear recovery.
The shift comes with the strong bullish candle on March 16. It rises through the base and closes above the smaller candles, completing the Tower Bottom formation and showing renewed buying pressure.
Price then continues higher, eventually reaching around $230. In this example, the pattern marked a turning point from a downtrend into a bullish recovery. However, that follow-through is something traders must watch for—it is never guaranteed by the pattern alone.
Tower Bottom vs. Tower Top
The Tower Bottom and Tower Top candlestick patterns signal potential reversals in opposite directions. Their main differences are where they form and how price moves to complete them.
Tower Bottom: A Bullish Reversal
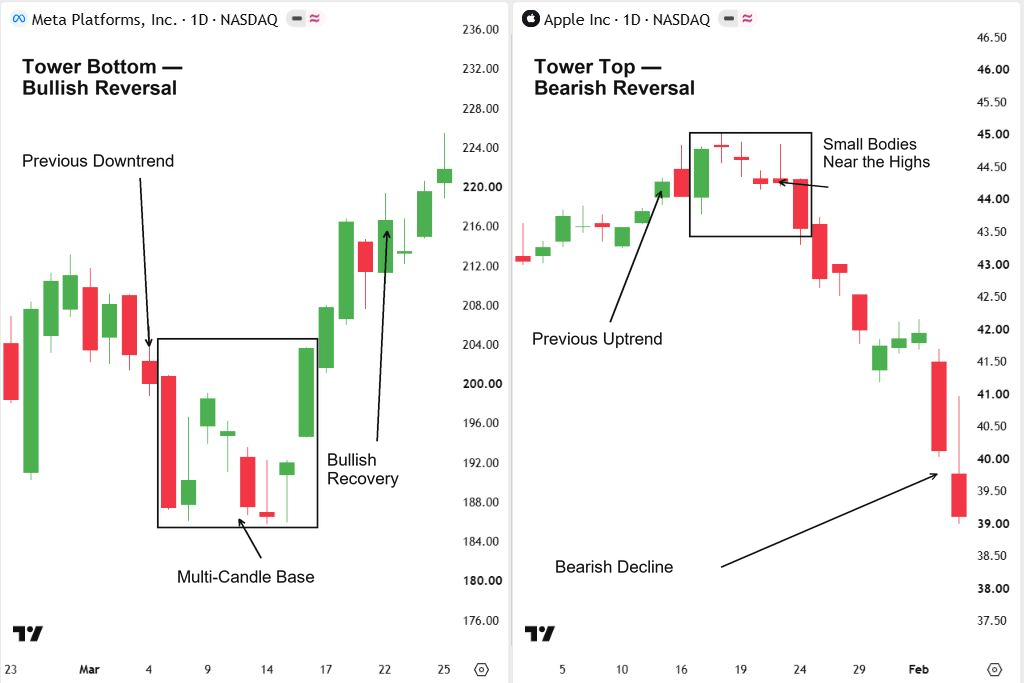
As you can see on the META chart above, the Tower Bottom forms after a decline. A strong bearish candle is followed by smaller-bodied candles that create a base near the lows. A strong bullish candle then completes the pattern, suggesting that buyers are starting to take control.
Tower Top: A Bearish Reversal
Now look at the Apple chart on the right. Here, the Tower Top forms after an upward move. Smaller-bodied candles gather near the highs before a strong bearish candle pushes price lower, suggesting that sellers are taking control.
The main difference is the direction: a Tower Bottom signals a potential bullish reversal, while a Tower Top signals a potential bearish reversal.
Tower Bottom Candlestick Pattern Meaning
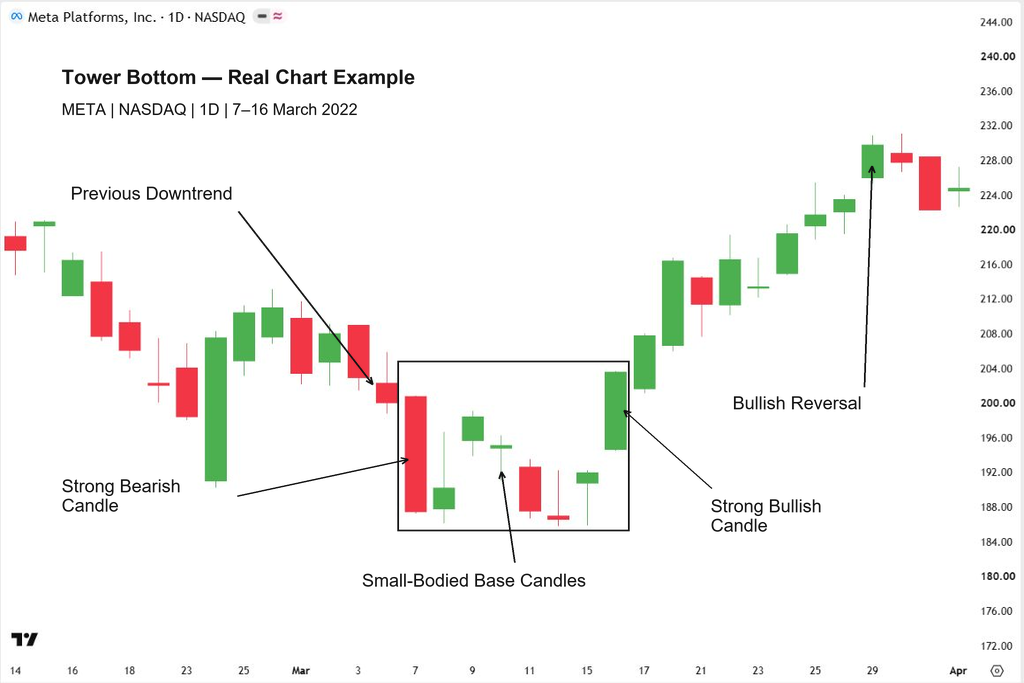
The Tower Bottom candlestick pattern helps you recognize a possible shift from selling pressure to buying pressure. To understand its meaning, look at how price behaves through each stage in the chart below.
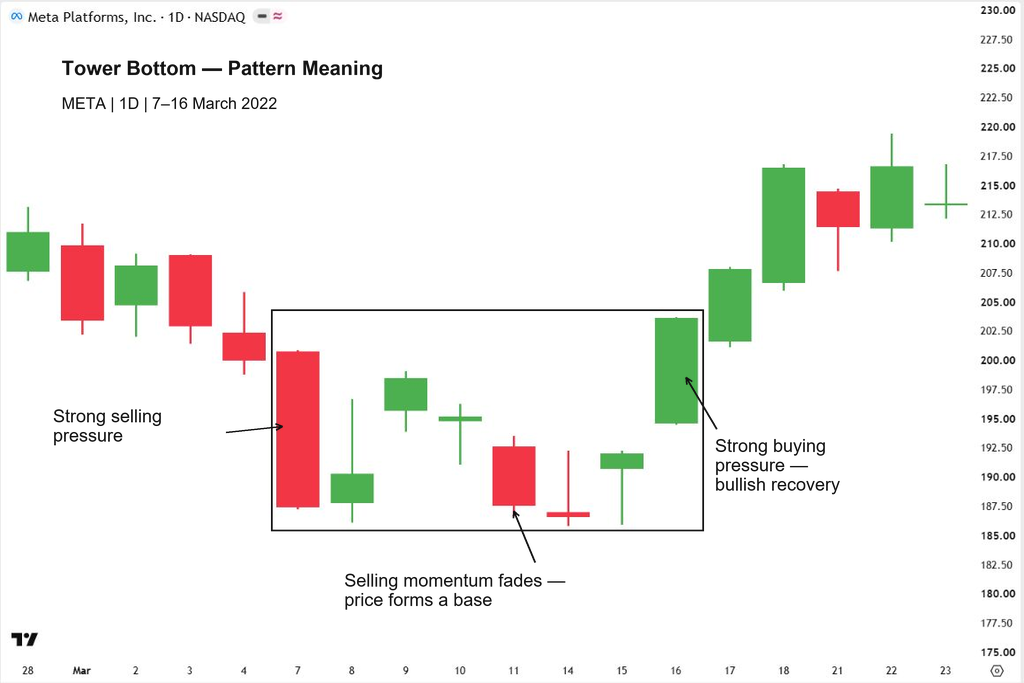
First, you can see a large bearish candle pushing price sharply lower. At this point, sellers are in control, and you have little evidence that the decline is ending.
Next, notice how the candles become smaller and price starts forming a base. Sellers still attempt to push the market down, but they struggle to extend the decline.
This suggests that selling momentum is fading. However, you cannot assume a reversal will follow just because price has stopped falling.
Now look at the strong bullish candle on the right side of the box. As you can see, it lifts price above the smaller candles, showing that buying pressure has strengthened. This completes the formation and gives you evidence of a potential bullish reversal.
The story is simple: you see sellers dominate, the decline lose momentum, and buyers begin to take control.
In this example, price continues higher afterward, but the pattern itself does not guarantee that outcome.
Want to recognize more candlestick patterns? Explore our 33 Candlestick Patterns Cheat Sheet (Simple Visual Guide) for an easy visual reference to bullish and bearish formations.
Trading the Tower Bottom at Support
When you trade the Tower Bottom candlestick pattern at support, you combine a potential bullish reversal with an area where price has previously attracted buyers. The support gives you a location to watch, while the pattern helps you assess how price reacts there.
Look at the GE Aerospace one-hour chart below.
Identify an Established Support Area
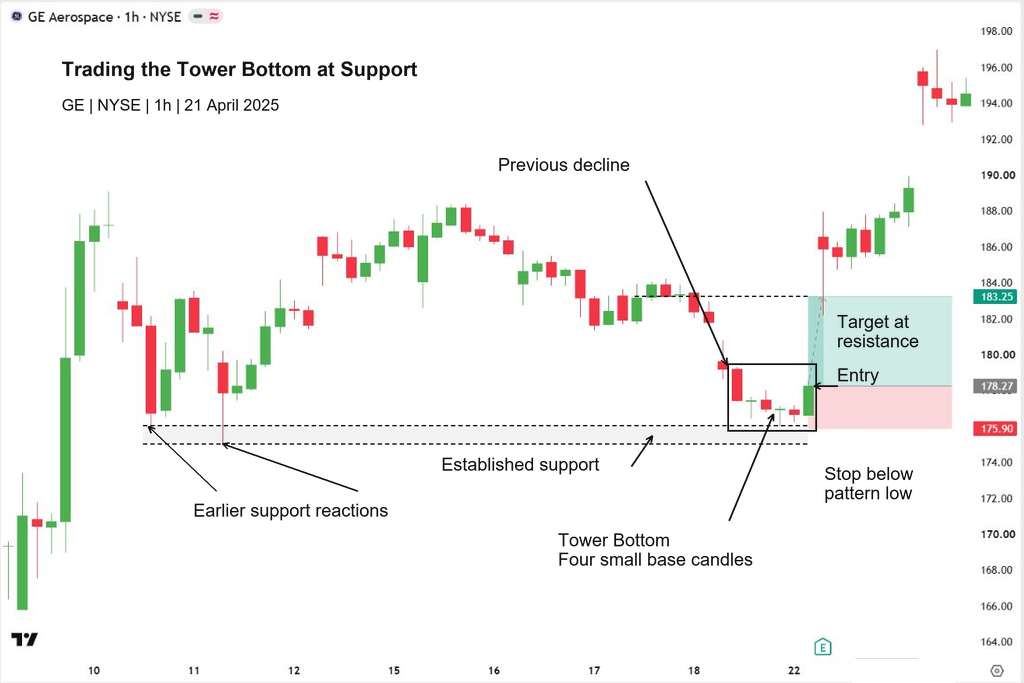
Start with the earlier price reactions on the left. As you can see, price bounced from the area around $175–$176 more than once. These reactions help you identify a support zone before the Tower Bottom develops.
When price returns to this area, your next step is to watch its behavior. Touching support alone is not a reason to buy.
Wait for the Tower Bottom to Complete
Notice how the decline reaches support with a strong bearish candle. Four smaller base candles then form near the lows, showing that sellers are struggling to push price significantly lower.
At this stage, you have a developing setup. The bullish candle on the right completes the formation by closing above the small base candles, giving you evidence that buyers are responding at support.
Plan Your Entry and Stop Loss
In this example, the illustrated entry is around $178.27, following the bullish move out of the base.
You can place your stop loss below the pattern’s lowest wick, allowing some room for normal price fluctuations. The chart illustrates a stop at $175.90. A move below this area would undermine the idea that the base is holding.
Use the distance between your entry and stop to calculate your position size according to your planned risk.
Target the Next Resistance
Now look at the target near $183.25. This area lines up with previous price activity that could act as resistance during a recovery.
With the illustrated entry and stop, you would risk approximately $2.37 per share for a potential gain of $4.98 per share—about 2.1 times your risk, before costs.
As you can see, price eventually moves beyond the marked target. That is the outcome of this example; when planning your trade, you need to judge the available space to resistance before entering.
Trading the Tower Bottom at a Demand Zone
Trading the Tower Bottom candlestick pattern at a demand zone gives you two things to look for: an area where a strong rally previously began and a reversal formation showing how buyers respond when price returns.
Look at the Alcoa (AA) one-hour chart below to see how this setup develops.
Identify the Demand Zone
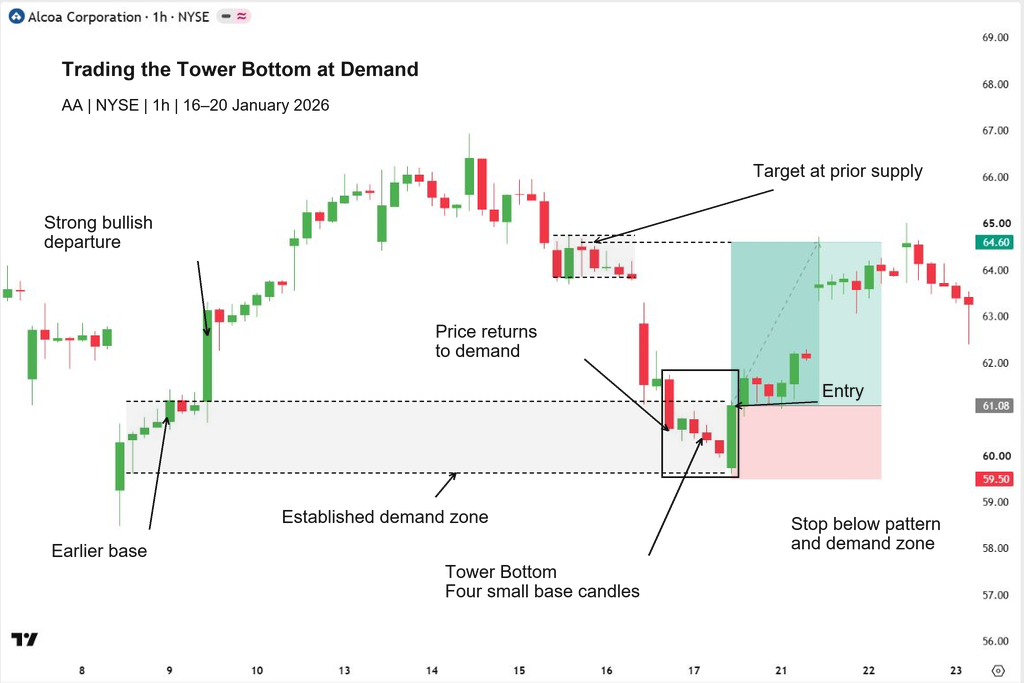
Start with the earlier base on the left side of the chart. Notice how price pauses before making a strong bullish departure. You can use this base to mark a potential demand zone, as it represents the area from which the rally started.
Extend that zone to the right so you can watch how price behaves if it returns. The earlier rally gives you a reason to monitor the area, but it does not guarantee another bounce.
Watch for the Tower Bottom
Now look at the highlighted formation inside the demand zone. After a strong bearish candle, four smaller base candles develop near the lows. As you can see, the decline slows, suggesting that sellers are losing momentum.
A strong bullish candle then lifts price above the small base candles, completing the Tower Bottom. This gives you evidence of buying pressure within the zone before you consider an entry.
Plan Your Entry and Stop Loss
The chart illustrates an entry around $61.08, following the bullish recovery out of the base.
The marked stop loss is at $59.50, below both the pattern and the demand zone. This placement gives the setup some room while defining where your bullish idea would be invalidated.
Before entering, calculate your position size using the distance between your entry and stop, along with the amount you have chosen to risk.
Target the Previous Supply Area
Look above the entry and you’ll see a previous consolidation area before a sharp decline. This is the prior supply area marked as the target, near $64.60.
Using the illustrated levels, you would risk approximately $1.58 per share for a potential gain of $3.52 per share. That gives you a potential reward of about 2.2 times your risk, before costs.
As you can see, price later reaches the marked target area. The lesson here is to combine the demand zone with a completed reversal pattern and check that the next supply area leaves enough room for your planned trade.
Conclusion
The Tower Bottom candlestick pattern helps you spot a potential bullish reversal as selling pressure fades and buyers step in. As you’ve seen in the examples, support levels and demand zones give you useful context for interpreting the formation.
Before taking a trade, wait for the pattern to complete, define your stop loss, and check the space available to your target. With practice, you can use the Tower Bottom as one part of a clear, consistent trading plan.
Frequently Asked Questions
Is the Tower Bottom candlestick pattern bullish or bearish?
The Tower Bottom is a bullish reversal pattern. You look for it after a decline, where it can suggest that selling pressure is weakening and buyers are gaining control.
How many candles form a Tower Bottom pattern?
There is no fixed candle count. Look for one or more strong bearish candles, a group of smaller-bodied candles forming a base, and a strong bullish recovery that completes the formation.
What is the difference between a Tower Bottom and a Morning Star?
A Morning Star consists of three candles. A Tower Bottom develops across a broader formation, usually with several smaller-bodied candles between the bearish decline and bullish recovery.
Can you trade a Tower Bottom without a support level?
You can identify the pattern without a marked support level. However, checking nearby support or a demand zone gives you additional context for understanding