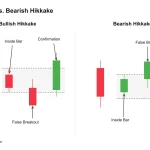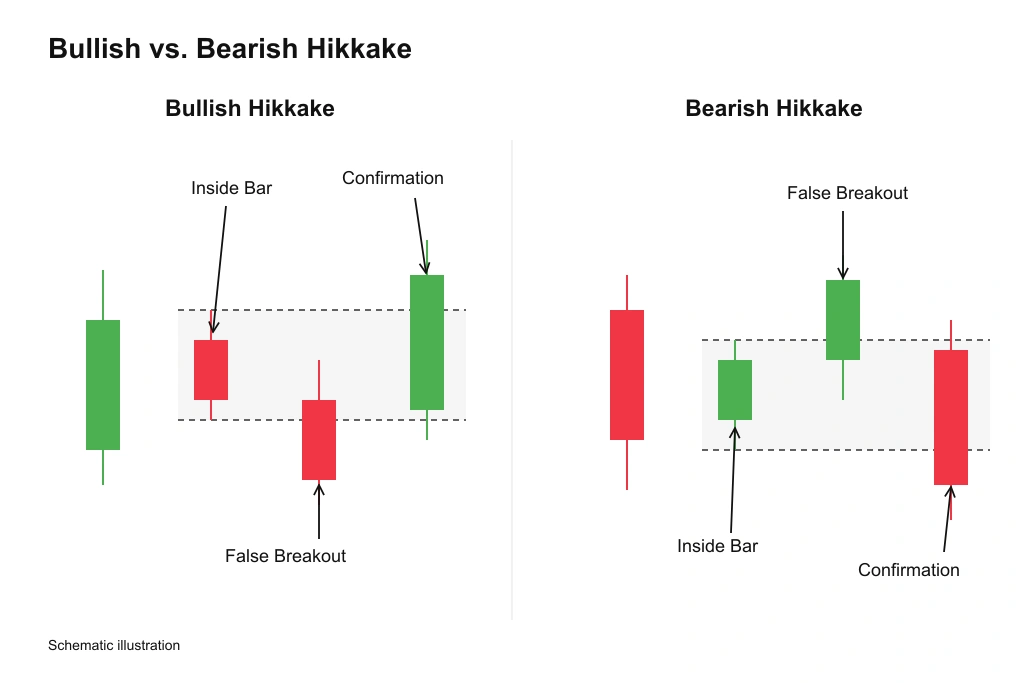
The Hikkake candlestick pattern is a price action formation that signals a potential move following a failed breakout.
It begins with an inside bar, a candle whose high and low fall within the previous candle’s range.
Price then moves outside that inside bar in one direction before reversing and breaking through its opposite side, confirming the pattern.
The Hikkake can be bullish or bearish. Its significance lies in how the failed breakout can trap traders who entered expecting the initial move to continue.
In this guide, we’ll explore how to recognize both versions, understand their meaning, and use them in trading strategies with chart examples.
Bullish Hikkake Pattern Example
To help you recognize the bullish Hikkake, let’s walk through the NVIDIA daily chart below. You’ll see how price breaks below the inside bar, reverses to confirm the pattern, and then moves higher.
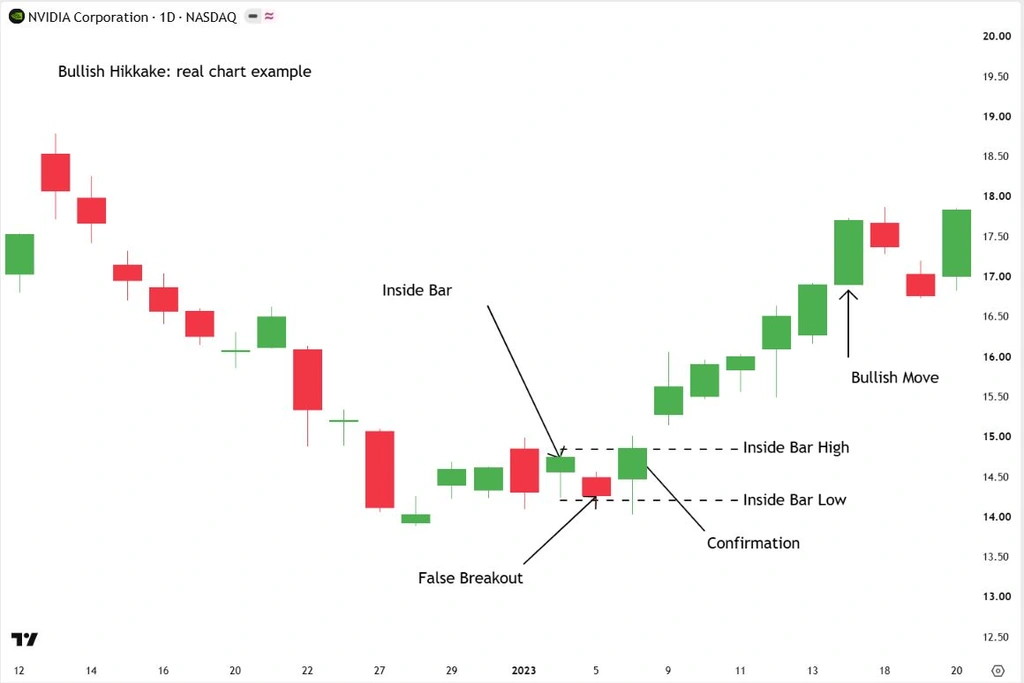
First, notice the decline on the left side of the chart. Near the bottom, you can spot a small green candle whose high and low sit within the previous candle’s range. This is your inside bar, and the dashed lines mark its high and low.
Next, you can see a red candle breaking below the inside bar’s low. This initially looks like a continuation of the decline.
If you focused only on that downward breakout, you might expect prices to keep falling.
However, the following green candle reverses upward and breaks above the inside bar’s high, confirming the bullish Hikkake. You now have a failed downward breakout followed by a breakout in the opposite direction.
Looking to the right, you can see what happened next: NVIDIA climbed through a series of mostly bullish candles.
In this example, the bullish Hikkake appeared near the end of the decline, before the subsequent rally.
Bearish Hikkake Pattern Example
Now let’s look at the opposite setup. On the Meta Platforms daily chart below, you’ll see how an upward breakout fails before price reverses and moves lower.
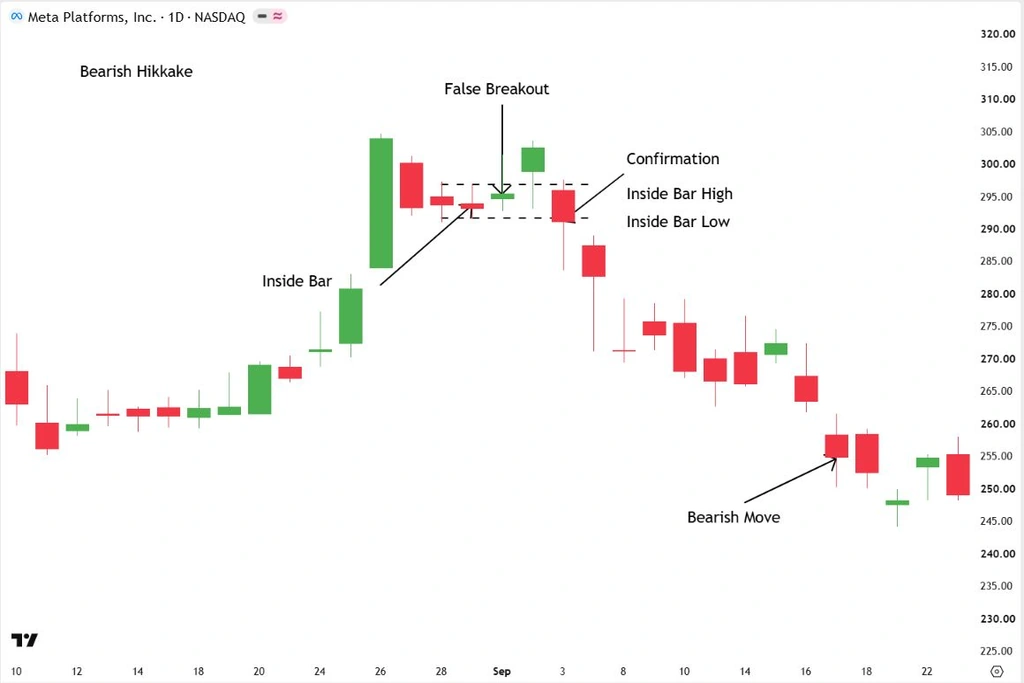
First, follow the rally on the left side of the chart. After the strong upward move, you can spot a small red inside bar, with its high and low contained within the previous candle’s range. The dashed lines mark its boundaries.
Price then breaks above the inside bar’s high and pushes higher. If you were watching this breakout as it happened, you might expect the rally to continue.
However, the move loses momentum. A red candle reverses downward and breaks below the inside bar’s low, confirming the bearish Hikkake.
The earlier upward breakout has failed, potentially trapping buyers who expected further gains.
Looking to the right, you can see the decline that followed. Meta falls toward the $250 area, illustrating how a failed upward breakout can give way to a sustained bearish move.
Psychology Behind the Bullish Hikkake Pattern
To understand the bullish Hikkake, put yourself in the position of a trader watching price decline.
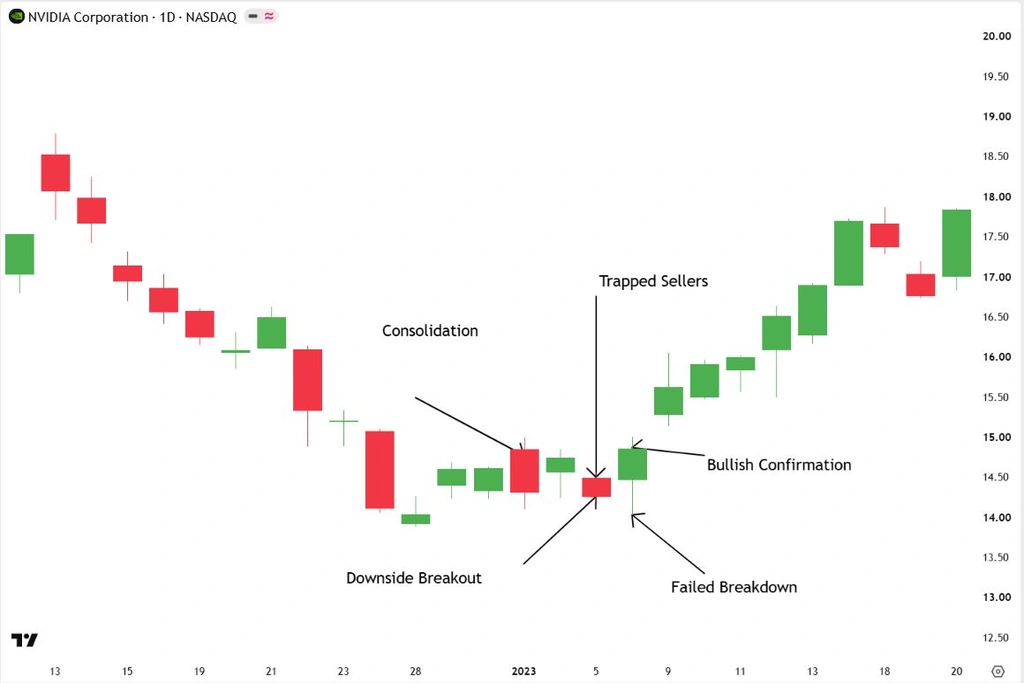
When you see a breakout below an inside bar, you might expect another move lower. The pattern becomes interesting when that expectation fails, as you can see in the NVIDIA chart below.
The Pause Creates Uncertainty
After the decline, you can see price pausing in a small consolidation. The inside bar reflects this narrowing range: sellers are no longer pushing price down as decisively, but buyers have yet to produce a clear upward breakout.
The Downward Break Attracts Sellers
When price breaks below the inside bar’s low, it appears to support the bearish outlook. Traders may open short positions, expecting the decline to resume, while some existing buyers may sell to limit their losses.
However, breaking below a level does not necessarily mean price will keep falling.
The Reversal Traps Sellers
Instead of continuing lower, price reverses and breaks above the inside bar’s high, confirming the bullish Hikkake.
If you had entered a short position on the downward breakout, you would now be facing a move against your trade.
Some short sellers may buy back their shares to close their positions. That buying can add to demand from traders entering on the bullish confirmation, helping the upward move develop.
The key shift is from an expected continuation of the decline to a failed breakdown. By recognizing that change, you can understand why the bullish Hikkake is often described as a bear trap.
Psychology Behind the Bearish Hikkake Pattern
While the bullish Hikkake can trap sellers, the bearish version can trap buyers. In the Meta Platforms chart below, you can follow how confidence in an upward breakout gives way to selling pressure.
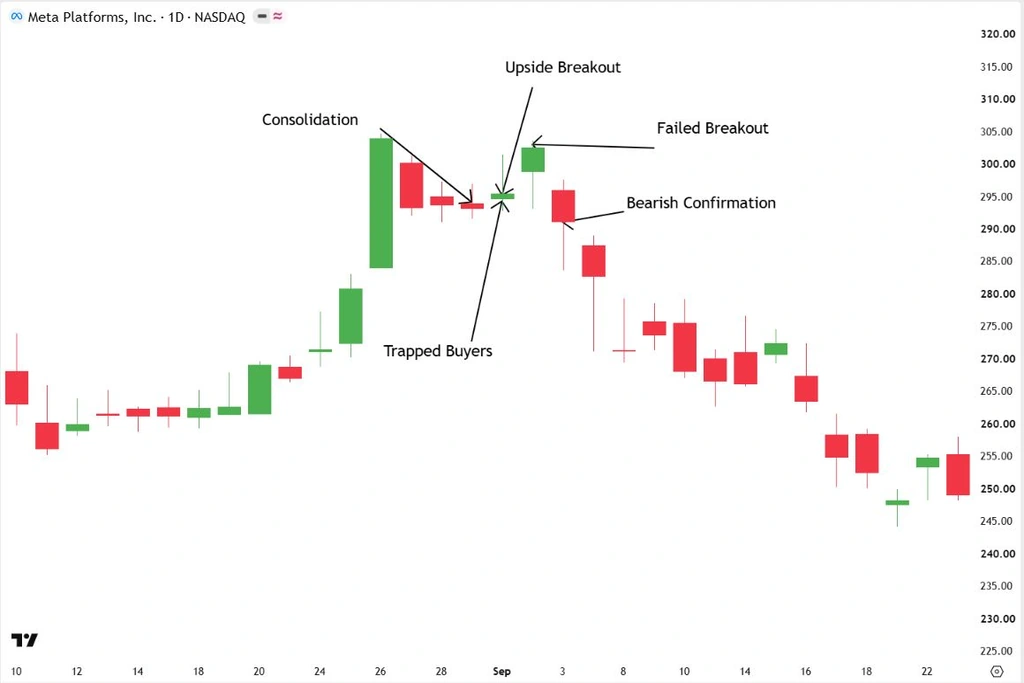
After the rally, price pauses and forms an inside bar. If you were watching this consolidation, you might view it as a brief rest before the upward move continues.
When price breaks above the inside bar’s high, that expectation appears to be confirmed, encouraging some traders to buy.
But the breakout fails to hold. Price reverses and breaks below the inside bar’s low, confirming the bearish Hikkake. Buyers who entered expecting further gains now face a move against their positions.
As these traders sell to limit their losses, they can add to the selling pressure from new short positions. You can see the subsequent decline on the right side of the chart.
This is the psychology of a bull trap: an apparently bullish breakout attracts buyers before price turns against them.
If you’d like to recognize more patterns on your charts, explore our 33 Candlestick Patterns Cheat Sheet (Simple Visual Guide) for an easy visual reference.
Trading a Bullish Hikkake Pattern at Support
Now that you understand how the Hikkake can trap traders, you can combine it with support to build a trade setup.
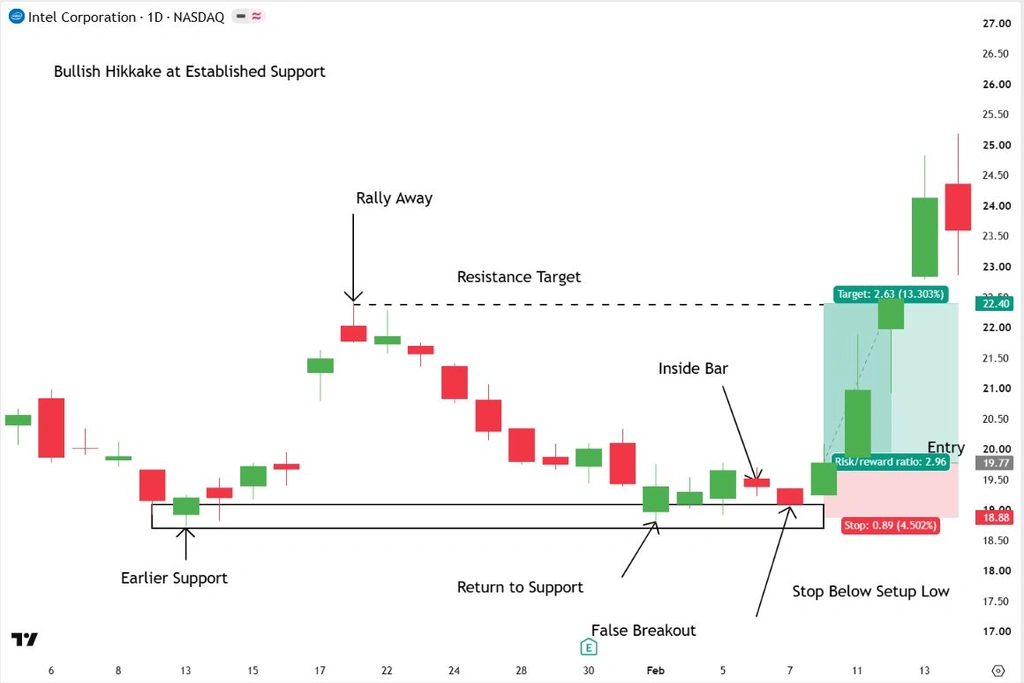
The idea is to identify an area where price previously attracted buyers, then wait for a bullish Hikkake to form when price returns. The Intel daily chart below shows how you can plan the entry, stop loss, and target.
Identify Support Before the Pattern Forms
Start with the earlier low on the left side of the chart. You can see price finding support around $19 before rallying toward $22.40. The outlined zone marks that support area.
When price returns, you have a reason to watch for a bullish setup. The support zone gives the pattern context: you’re looking for a failed downward breakout where buyers previously stepped in.
Wait for Confirmation Before Entering
At the return to support, you can spot the labeled inside bar, followed by a red candle that breaks below its low.
Instead of immediately buying the dip, wait for price to reverse and break above the inside bar’s high.
That upward breakout confirms the bullish Hikkake. In this example, the marked entry is approximately $19.77.
Place Your Stop Below the Setup Low
You can place your stop loss below the lowest point of the setup, allowing some room beneath the low. The chart marks a stop at approximately $18.88.
This puts your planned risk at $0.89 per share. Use that distance to calculate how many shares you can buy for your chosen dollar risk.
Target the Previous Resistance
Look back to the previous rally high to identify a potential target. Here, the chart marks resistance near $22.40, giving you a potential reward of $2.63 per share and a reward-to-risk ratio of approximately 2.96:1, before costs.
Following the entry, you can see Intel rally to the marked target and continue higher. The setup brings together three elements: established support, a confirmed bullish Hikkake, and a trade plan with defined entry, stop, and target levels.
Trading a Bearish Hikkake Pattern at Resistance
You can apply the same logic at resistance when looking for a short setup. Here, you’re watching whether buyers can push through an area that previously stopped a rally.
The ExxonMobil daily chart below gives you an example of what happens when that attempt fails.
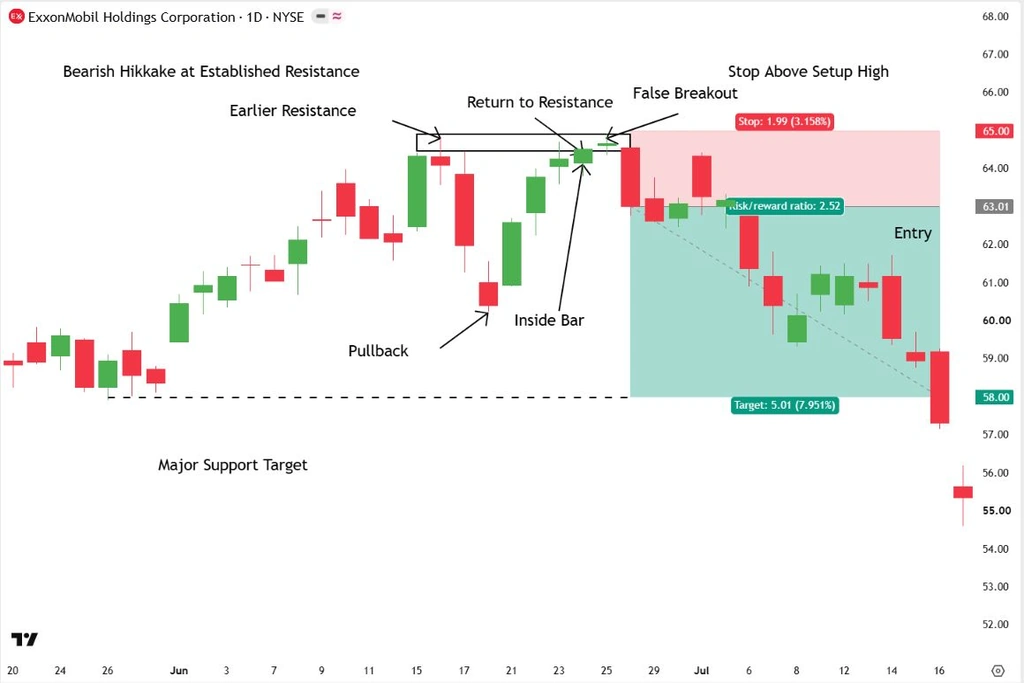
Notice how price first reaches the outlined resistance zone near $64.50–$65, then pulls back. That earlier rejection gives you a level to watch when the stock climbs again.
On the return to resistance, an inside bar forms, followed by a candle that breaks above its high.
Buying that breakout might look tempting, but price remains close to the area where the previous rally stalled. You need to see how the move develops.
The next large red candle turns downward and breaks below the inside bar’s low, confirming the bearish Hikkake. Instead of sustaining the upward breakout, price has reversed at resistance.
The chart illustrates a short trade with the following levels:
| Trade level | Price | Purpose |
|---|---|---|
| Entry | $63.01 | Marked short entry following confirmation |
| Stop loss | $65.00 | Above the setup high |
| Target | $58.00 | Previous major support |
With these levels, your planned risk is $1.99 per share, compared with a potential reward of $5.01 per share. That gives you a reward-to-risk ratio of approximately 2.52:1, before costs.
As you follow the remaining candles, you can see that the decline includes brief rebounds before reaching the support target.
Your reason for considering the trade comes from the combination of the earlier resistance and the failed breakout; the stop and target then give you clear levels for managing it.
Pros and Cons of the Hikkake Candlestick Pattern
The examples above show how you can use the Hikkake to recognize failed breakouts and plan trades around support or resistance. Before adding it to your approach, consider its strengths and limitations.
| Pros | Cons |
|---|---|
| Clear setup: You have specific price levels to watch: the inside bar’s high and low. | Confirmation can fail: Price may reverse again after breaking through the confirmation level. |
| Highlights breakout traps: It helps you recognize when an initial move fails to continue. | Requires patience: You need to wait for confirmation before treating the initial breakout as a failed move. |
| Fits with support and resistance: You can combine the pattern with established levels, as shown in the trading examples. | Context matters: The formation alone does not tell you whether the surrounding market favors the trade. |
| Supports a defined trade plan: The setup provides reference points for your entry and stop loss. | Targets require separate analysis: You still need to identify a suitable support or resistance level for taking profit. |
| Makes risk and reward measurable: Once you choose your stop and target, you can assess the potential trade. | Some setups offer little room: Nearby support or resistance may leave insufficient potential reward relative to your risk. |
The Hikkake gives you a clear way to interpret a failed breakout, but you still need to judge the location and available reward.
Use the pattern to build your trade plan, then decide whether the complete setup is worth taking.
Conclusion
The Hikkake candlestick pattern encourages you to look beyond the initial breakout and pay attention to what price does next.
A move that seems likely to continue can quickly fail, leaving buyers or sellers caught on the wrong side of the market.
As you’ve seen in the examples, support and resistance give you context for interpreting that failure.
Wait for confirmation, identify where your trade idea would be invalidated, and check whether the next target offers enough potential reward for the risk.
To become familiar with the pattern, start by finding examples on your own charts. Study the setups that worked and those that failed.
That practice will help you understand when a Hikkake fits your trading approach—and when to leave it alone.
Frequently Asked Questions
What is the Hikkake candlestick pattern?
The Hikkake is a price action pattern built around a failed breakout from an inside bar. Price initially moves in one direction, then reverses and breaks through the opposite side of the inside bar to confirm the setup.
Is the Hikkake pattern bullish or bearish?
It can be either. A bullish Hikkake involves a failed downward breakout followed by confirmation above the inside bar’s high. A bearish Hikkake involves a failed upward breakout followed by confirmation below its low.
How is a Hikkake different from an inside bar?
An inside bar is a candle whose entire range sits within the previous candle’s range. It is one part of the Hikkake setup. To identify a confirmed Hikkake, you also need the initial breakout to fail and price to break through the inside bar’s opposite boundary.
Do candle colors matter when identifying a Hikkake?
No. You should focus on the candles’ highs and lows rather than their colors. The inside bar, the direction of the initial breakout, and the subsequent confirmation define the pattern.
Does a Hikkake always signal a trend reversal?
No. It signals a reversal of the initial breakout, which does not necessarily mean the broader trend has changed. You