The Thrusting Line candlestick pattern is a two-candle formation that shows a strong move followed by a partial move in the opposite direction. It helps you recognize a pause that may lead to trend continuation.
The traditional version is bearish, while its bullish variation mirrors the structure in an uptrend. In both cases, you look for a second candle that closes inside the first candle’s body without reaching its midpoint.
Bullish Thrusting Line Candlestick Pattern
The bullish Thrusting Line candlestick pattern is a bullish continuation variation of the traditional bearish formation.
You look for it during an uptrend, when a strong bullish candle is followed by a bearish candle that gives back only part of the advance.
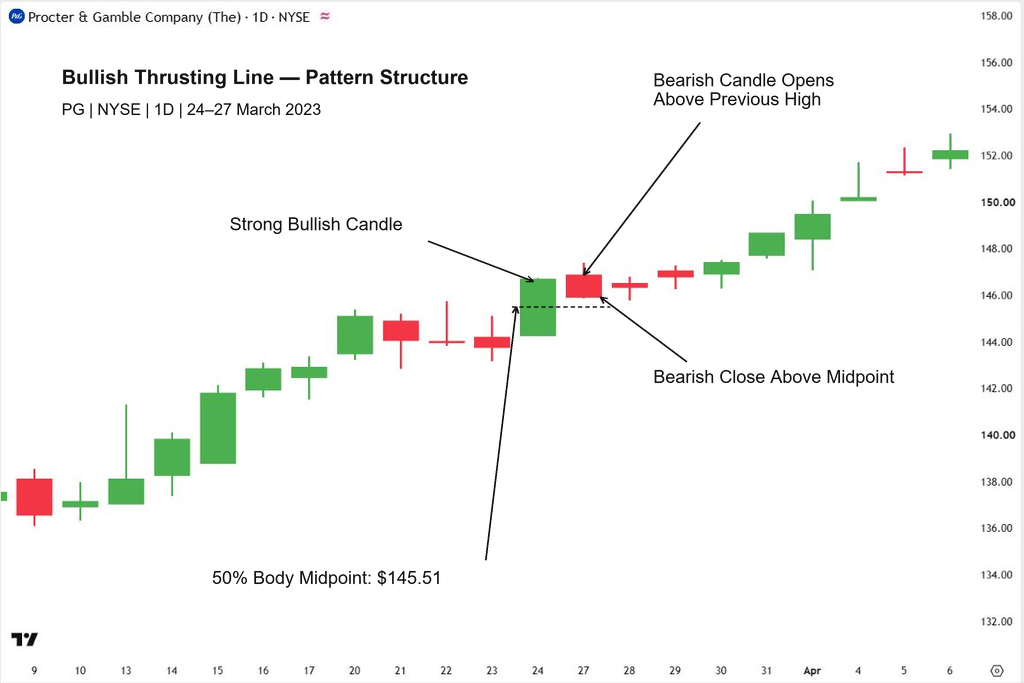
Look at the Procter & Gamble (PG) daily chart below to see how you can recognize it.
How to Identify the Pattern
Start with the strong green candle highlighted on the chart. It shows buyers pushing price higher and forms the first candle of the pattern.
Next, look at the red candle immediately after it. It opens above the bullish candle’s high, then falls back into its body. However, its closing price remains above the first candle’s midpoint, marked at $145.51.
You therefore have three features to check:
- An existing uptrend.
- A strong bullish first candle.
- A bearish second candle that opens above the previous high and closes inside the upper half of the first candle’s body.
What Does It Tell You?
Think of the second candle as a test of the previous advance. Sellers push price down, but they cannot erase even half of the bullish candle’s body by the close. This suggests that the pullback is limited and buyers may still have the advantage.
As you can see on the chart, price pauses for a few sessions before continuing higher. That illustrates a useful point: continuation does not have to happen immediately.
You still need to watch the following candles for renewed buying pressure rather than assuming that every similar formation will lead to a rally.
Bearish Thrusting Line Candlestick Pattern
The bearish Thrusting Line candlestick pattern shows you a recovery attempt during a downtrend—but one that leaves much of the previous decline intact.
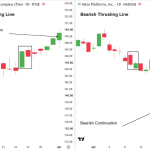
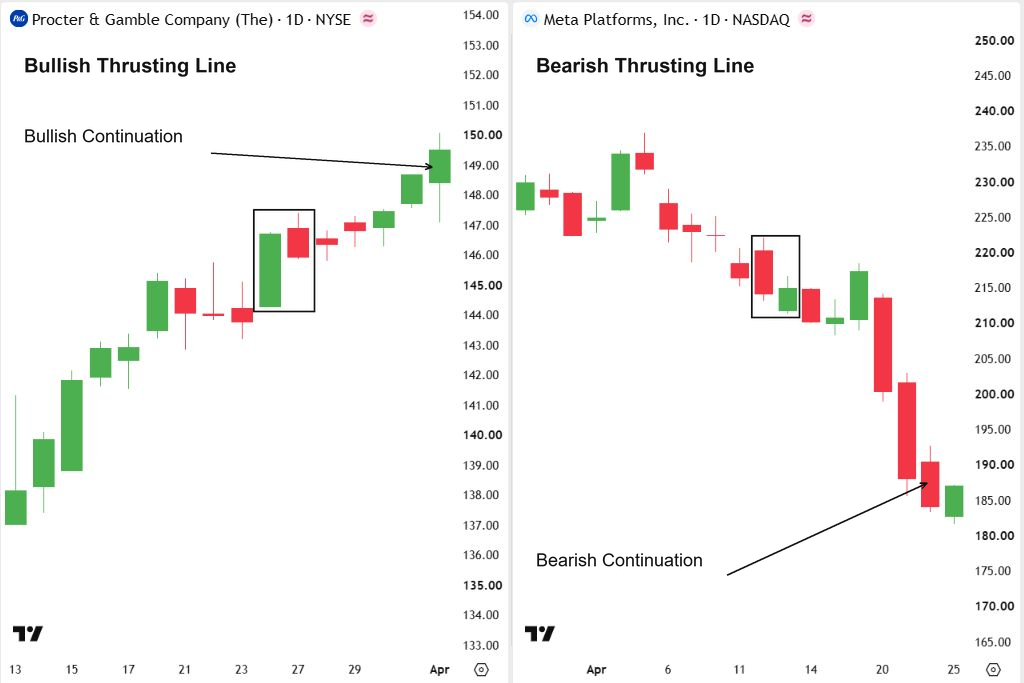
Take a look at the META daily chart below. Focus on the two highlighted candles first.
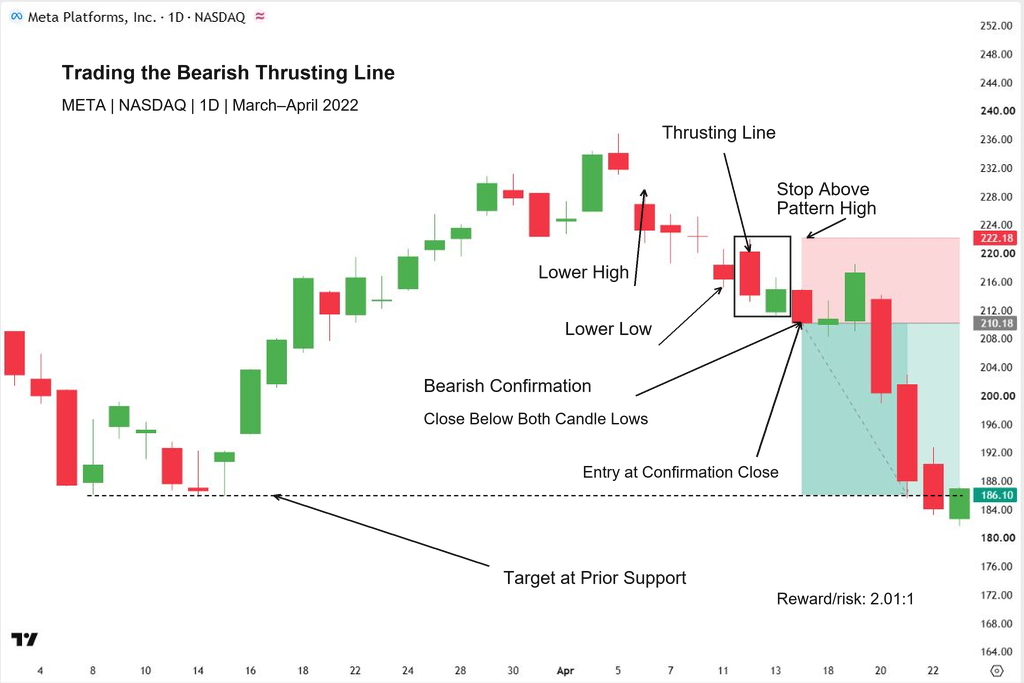
The large red candle pushes price lower, continuing the downward move. The next session opens below that candle’s low, but buyers step in and lift price back into its body.
At first glance, that green candle might look encouraging for buyers. The detail to check is where it closes.
Here, it finishes below $217.19, the midpoint of the previous bearish candle’s body. Buyers have recovered some ground, but less than half of what sellers took away in the first candle.
That gives you the pattern’s defining structure: a long bearish candle followed by a bullish candle that opens below its low and closes inside the lower half of its body.
Now follow the chart to the right. You can see a brief bounce before the decline resumes. This is why you shouldn’t expect price to fall immediately after the pattern appears. Instead, watch whether the recovery stalls and fresh selling follows.
The main takeaway? A green candle does not necessarily change the bearish picture. You need to judge how far buyers recover and what price does next.
Thrusting Line Psychology
The Thrusting Line pattern’s psychology comes down to how much ground the opposing side can recover.
You see a strong move, followed by an attempt to push price back. The second candle’s close helps you judge the strength of that response.
Look at the two charts below. Both show a challenge to the existing trend, but the challenge remains limited.
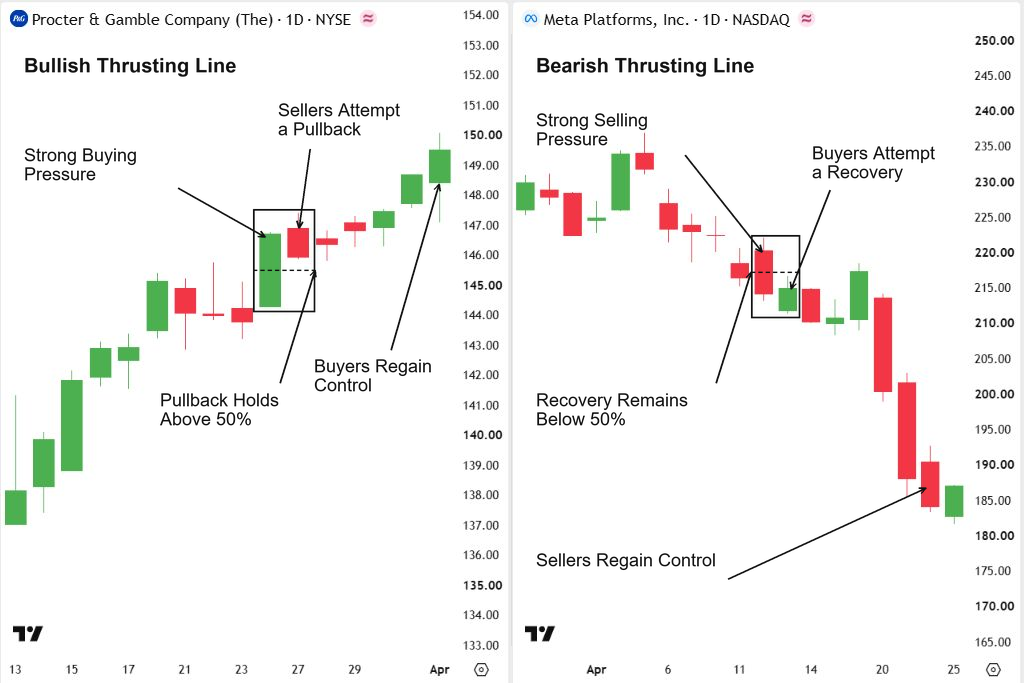
Bullish Variation: Sellers Struggle to Reverse the Advance
On the PG chart on the left, the strong green candle shows buyers driving price higher. The next session opens above the previous high, but sellers push price down.
If you were watching this unfold, the red candle might make you question whether the uptrend was weakening.
Notice, though, where it finishes: above the midpoint of the bullish candle’s body. Sellers give back some of the advance, but buyers retain more than half of the first candle’s gain.
This pullback could reflect profit-taking or fresh selling, you cannot tell the exact cause from candles alone.
What you can see is that the selling response remains limited. Price later moves higher, supporting the bullish continuation interpretation in this example.
Bearish Pattern: Buyers Struggle to Reverse the Decline
Now turn to the META chart on the right. A strong red candle extends the decline, and the following session opens below its low. Buyers then step in and lift price.
That recovery may look promising at first. But as you can see, the green candle closes below the bearish candle’s midpoint. Buyers recover some ground without reclaiming half of the previous candle’s body.
This suggests that the buying response is still too limited to establish a reversal. In this example, a brief bounce follows before sellers drive price lower again.
When you read either formation, focus on the size of the response rather than the second candle’s color alone.
Then watch what happens next: a limited countertrend move suggests possible continuation, but subsequent price action must support that interpretation.
Trading the Bullish Thrusting Line During an Uptrend
When you trade the bullish Thrusting Line during an uptrend, you’re looking for a limited pullback followed by renewed buying pressure.
Start by checking the trend, then wait for price to confirm that buyers are pushing higher again.
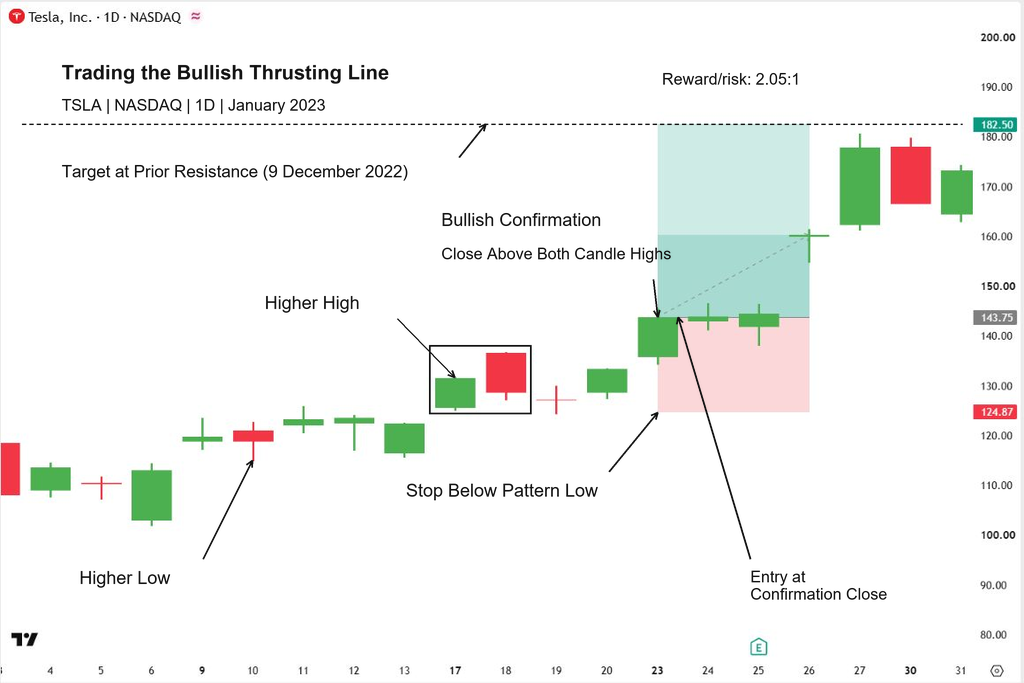
Look at the Tesla daily chart below. The marked levels show how you can organize a continuation trade.
Start with the Trend
Follow price from the left side of the chart. You can see a higher low followed by a higher high, suggesting that an upward trend is developing.
Within that context, look for a strong bullish candle followed by a bearish candle that opens above its high and closes inside its upper half.
That closing position matters: it shows that sellers have retraced less than half of the bullish candle’s body.
Wait for Buyers to Respond
Rather than entering as soon as the two candles form, you can wait for a subsequent candle to close above both pattern highs. This gives you additional evidence that the pullback has ended.
The chart illustrates this confirmation approach with an entry near $143.75. Notice that confirmation may take several sessions—you don’t need to assume the next candle will immediately continue higher.
Define Your Stop and Target
The illustrated stop sits at $124.87, below the highlighted formation. Before entering, use that distance to calculate a position size that fits your planned risk.
For the target, look at the dashed line near $182.50, marked as prior resistance. With these levels, the potential gain is $38.75 per share, compared with $18.88 per share of planned riska reward-to-risk ratio of approximately 2.05:1, before costs.
One final detail: although price rallies strongly, the visible candles remain below the target. You can see bullish follow-through here, but the chart does not show the target being reached.
Trading the Bearish Thrusting Line During a Downtrend
Trading the bearish Thrusting Line during a downtrend means looking for a weak recovery within an existing decline, then waiting for sellers to take control again.
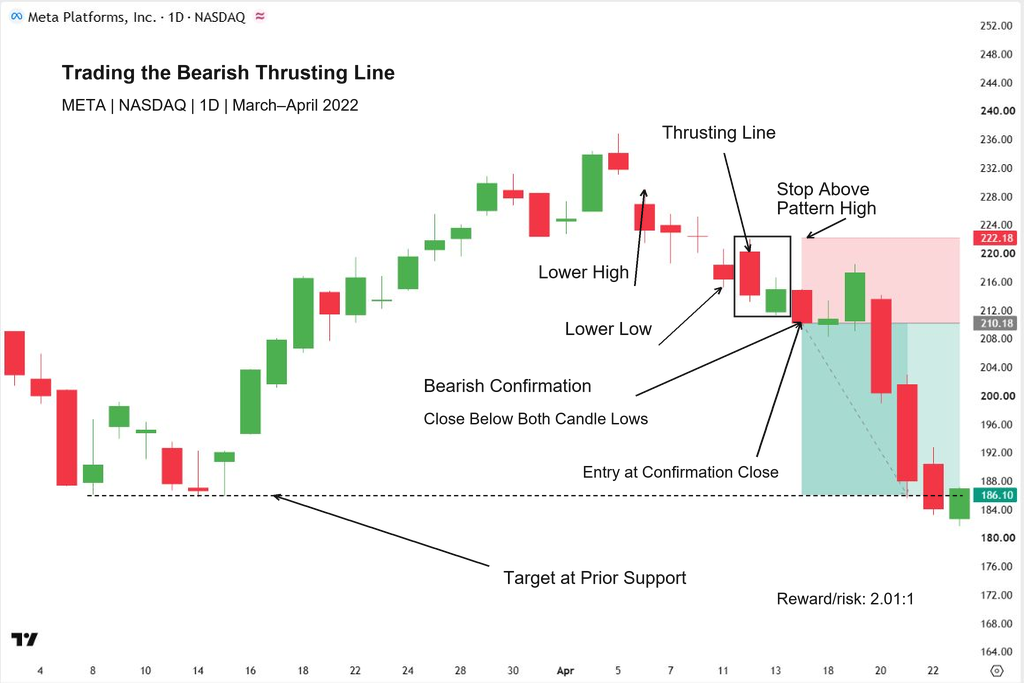
Take a look at the META daily chart below. It shows how you can combine the pattern with market structure, a confirmation entry, and a target at previous support.
Check the Direction First
Before focusing on the highlighted candles, follow the price action leading into them. After the early-April peak, price turns lower.
The marked lower high and lower low help you recognize that the earlier advance is giving way to a downward move.
This gives you the context for a potential short trade. You’re looking for the recovery to stall and the decline to resume.
Watch the Recovery, Then Wait for Confirmation
Inside the box, you can see a strong bearish candle followed by a smaller bullish candle. Buyers lift price, but the second candle closes below the first candle’s midpoint, leaving most of its decline unrecovered.
Rather than selling immediately, the illustrated approach waits for a candle to close below both pattern lows. That bearish confirmation produces the marked entry near $210.18.
Waiting gives you additional evidence of renewed selling, although it also means entering farther from the pattern high.
Set Your Stop Above the Pattern
Now look at the red area above the entry. The illustrated stop is $222.18, above the highest point of the two-candle formation.
A recovery through that high would weaken the bearish setup. With an entry at $210.18, the distance to the stop is $12 per share. Use that distance to calculate your position size according to your chosen risk.
Aim for Previous Support
Follow the dashed line across to the earlier lows on the left. This previous support area provides the illustrated target near $186.10, where buying pressure could return.
The potential gain is $24.08 per share, compared with $12 of planned risk—a reward-to-risk ratio of approximately 2:1, before costs.
As you can see, price briefly rebounds after the entry before falling to the target. The move shows why your plan needs to account for fluctuations along the way, even when the trade eventually follows your expected direction.
Bullish Thrusting Line vs. Dark Cloud Cover
The bullish Thrusting Line and Dark Cloud Cover can look similar at first. Both appear after an upward move, with a bullish candle followed by a bearish candle that opens above the previous high. To tell them apart, you need to check where the second candle closes.
Look at the charts below. The dashed lines mark the midpoint of each first candle’s body.
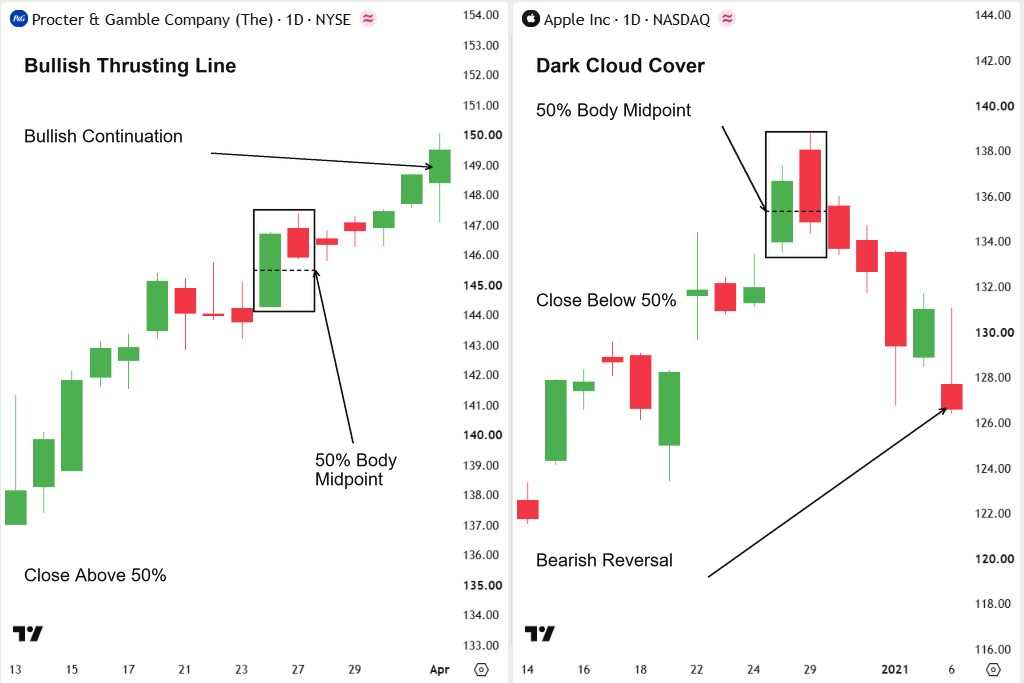
Bullish Thrusting Line: A Limited Pullback
On the PG chart on the left, the bearish candle closes inside the bullish candle’s body but above its midpoint. Sellers push price down, yet leave more than half of the previous candle’s gain intact.
You can interpret this bullish variation as a possible pause within the uptrend. As you can see, price subsequently continues higher in this example.
Dark Cloud Cover: A Deeper Sell-Off
Now look at the Apple chart on the right. The bearish candle closes below the bullish candle’s midpoint, while remaining inside its body.
Sellers have erased more than half of the previous candle’s gain, giving you a stronger warning that the advance may be losing strength.
This makes Dark Cloud Cover a potential bearish reversal pattern. The decline that follows illustrates that interpretation, although you cannot assume every formation will produce the same result.
The distinction is straightforward: a close above the midpoint shows a shallower pullback; a close below it shows greater bearish penetration.
Use that difference alongside the surrounding trend and subsequent candles to assess the setup.
Unlike the Thrusting Line pattern, which typically signals bearish continuation, the Dark Cloud Cover Candlestick Pattern is a bearish reversal formation that appears after an uptrend. Understanding both patterns can help traders recognize different market conditions and potential trading opportunities.
Bearish Thrusting Line vs. Piercing Pattern
The bearish Thrusting Line and Piercing pattern both begin with a bearish candle during a decline, followed by a bullish candle that opens below the previous low. The difference becomes clear when you check how far buyers recover by the close.
Look at the charts below. In each example, the dashed line marks the midpoint of the first candle’s body.
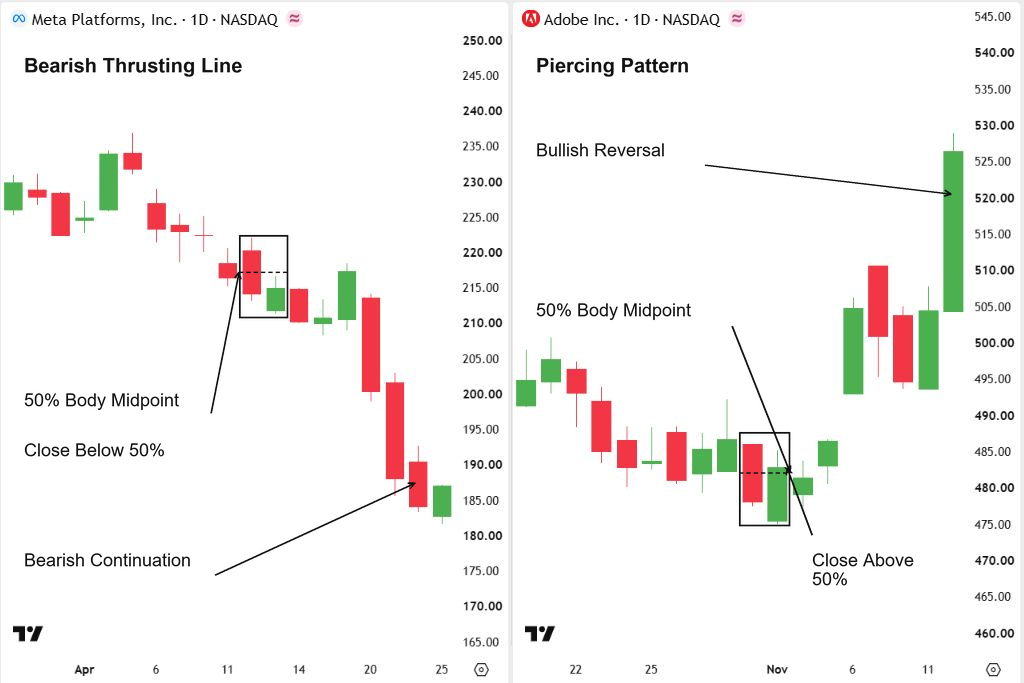
Bearish Thrusting Line: Buyers Recover Less Ground
On the META chart on the left, the bullish candle closes inside the bearish candle’s body but below its midpoint. Buyers push back, yet recover less than half of the previous candle’s decline.
This limited response suggests that sellers may retain the advantage, making the formation a potential bearish continuation signal. As you can see, a brief bounce occurs before price moves lower.
Piercing Pattern: A Stronger Buying Response
Now turn to the Adobe chart on the right. Here, the bullish candle closes above the bearish candle’s midpoint, while remaining below its opening price.
Buyers have recovered more than half of the first candle’s decline. That deeper recovery gives you a potential bullish reversal signal, rather than the continuation signal associated with a bearish Thrusting Line.
The chart shows price subsequently moving higher. When identifying the pattern yourself, remember that crossing the midpoint changes the formation’s classification, but does not guarantee a reversal. You still need to assess the surrounding price action and watch for follow-through.
Want to discover more powerful candlestick formations? Explore our Candlestick Patterns Cheat Sheet to learn how to identify and interpret different bullish and bearish patterns.
Conclusion
The Thrusting Line candlestick pattern helps you recognize a limited move against the trend that may lead to continuation.
Focus on the second candle’s close, check the surrounding trend, and wait for follow-through. Before entering, define your stop loss and target so you have a clear trading plan.