The Dragonfly Doji is a bullish reversal candlestick pattern that typically forms at the end of a downtrend.
It signals that sellers may be losing control of the market and that buyers are beginning to step in aggressively.
During the trading session, prices initially move sharply lower, but strong buying pressure pushes the price back up to close near the opening price.
This dramatic shift in sentiment suggests that bearish momentum is weakening and that a potential trend reversal to the upside may be developing.
However, traders should always look for additional confirmation, such as a bullish candlestick, increased volume, or a break above a key resistance level before entering a trade.
Dragonfly Doji Candlestick Pattern Example
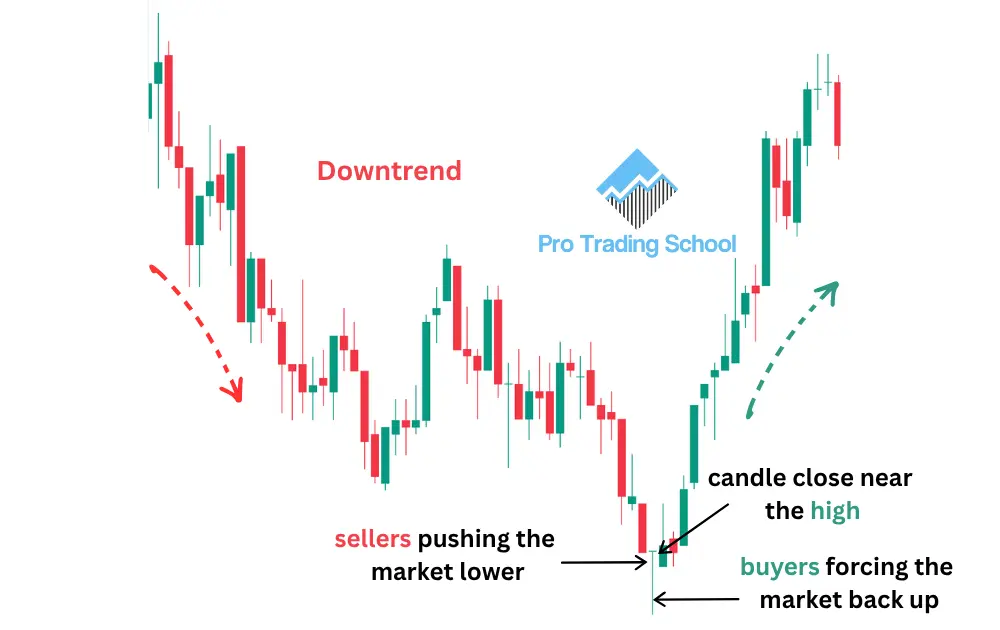
To help you understand exactly what the Dragonfly Doji candlestick pattern looks like, take a look at the chart example below.

As you can see, the market was in a clear downtrend, which means that sellers were firmly in control and prices were consistently moving lower. However, a Dragonfly Doji eventually formed at the bottom of the decline.
The formation of this pattern shows that sellers initially pushed prices significantly lower during the session, but they were unable to maintain control.
Strong buying pressure entered the market and completely rejected the lower prices, pushing the price back up to close near its opening level.
This sudden shift in momentum suggests that bearish pressure is fading and that buyers are taking control of the market.
In this example, the Dragonfly Doji successfully marked the end of the downtrend, and the market subsequently rallied strongly, turning the bearish trend into a new uptrend.
The Dragonfly Doji is just one of many powerful candlestick formations. Explore our Candlestick Patterns Cheat Sheet for simple visual examples and practical trading insights.
Dragonfly Doji Psychology
The Dragonfly Doji provides valuable insight into the psychology of the market during the specific trading period in which the pattern forms.
The session usually begins with sellers pushing prices lower, showing that bearish sentiment is still dominating the market.
At some point, however, buyers step in aggressively and absorb all of the selling pressure. Their buying activity becomes so strong that they manage to push the price all the way back up, causing the market to close near its opening price.
This battle between buyers and sellers creates the Dragonfly Doji’s distinctive T-shaped appearance, which visually tells the story of what happened during the session.
The long lower shadow represents the sellers’ attempt to continue the downtrend, while the small or non-existent real body near the top of the candle shows that buyers ultimately won the battle and regained control.
When this pattern appears at the end of an extended downtrend, it often signals that bearish momentum is fading and that a potential bullish reversal may be about to begin.
However, the Dragonfly Doji should not be traded in isolation. A single candlestick pattern is rarely enough to make high-probability trading decisions.
To improve the reliability of the setup, traders should look for additional factors of confluence, such as:
- A major support level or demand zone.
- A liquidity sweep below a previous low.
- Oversold conditions on momentum indicators.
- Increasing trading volume.
- A bullish confirmation candle after the Dragonfly Doji.
- A break above a key resistance level.
The more confirmation factors that align with the Dragonfly Doji, the greater the probability that the pattern will lead to a meaningful bullish reversal.
1. Dragonfly Doji at a Support Level
The first trading strategy combines a support level with the Dragonfly Doji to identify high-probability reversal opportunities.
Take a look at the chart example below. As you can see, the market tested this area twice, creating a well-defined support level.
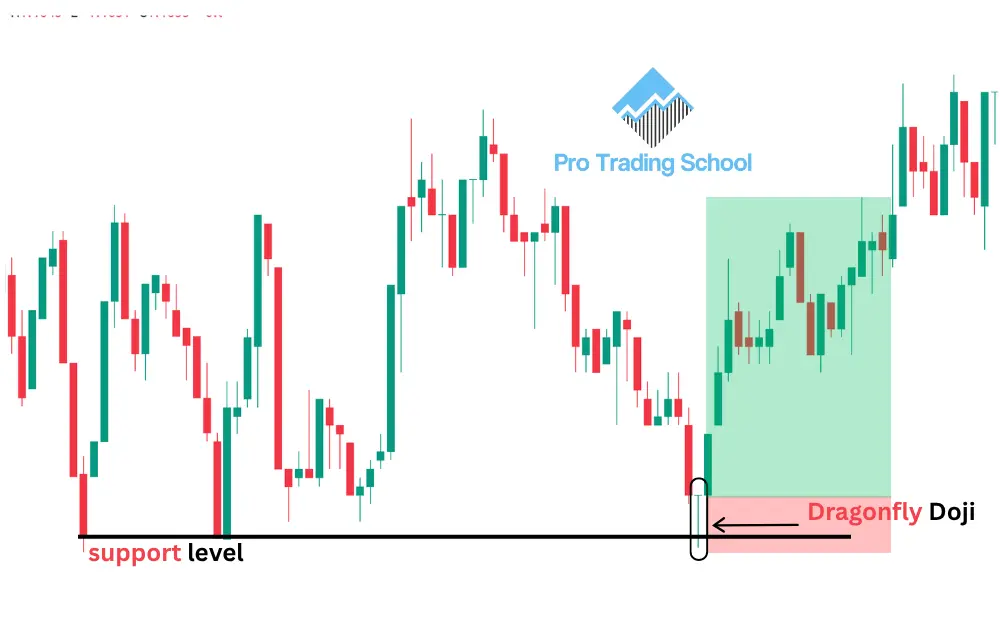
After bouncing from the level, the price moved higher before eventually declining back toward the same support zone.
Once the price reached the support level again, a Dragonfly Doji candlestick pattern formed. This is an important signal because it shows that sellers attempted to break below the support level but were strongly rejected by buyers. In other words, buyers stepped in once again to defend this area.
The long lower shadow of the Dragonfly Doji reflects this battle between buyers and sellers. During the period in which the candle formed, buyers absorbed all of the selling pressure and managed to push the price back up, indicating that bullish momentum may be returning.
This provides a potential entry signal:
- Entry: At the close of the Dragonfly Doji candle or on the break above its high.
- Stop-loss: Below the low of the Dragonfly Doji. This is generally a better option than placing the stop directly below the support level because it gives the trade a clear invalidation point.
- Target: The next significant resistance level or the next major price zone.
As shown in the example, the market moved higher after the pattern formed and the trade played out as expected.
Important Tip
If you want to use this strategy successfully, do not ignore top-down analysis. You may find a high-probability setup on a lower timeframe, but if the higher timeframe is in a strong downtrend, the chances of success are lower because you are trading against the dominant market direction.
For the best results, look for Dragonfly Doji patterns that form at support levels in alignment with the higher timeframe trend. This additional confluence can significantly improve the probability of the setup succeeding.
2. Dragonfly Doji with a Liquidity Sweep
The second trading strategy combines the Dragonfly Doji with a liquidity sweep, which can produce powerful reversal setups.
The idea behind this strategy is to identify a support level that has been tested several times. Every time the market bounces from the same support level, more traders place their stop-loss orders below it.
This creates a pool of liquidity beneath the support zone, which often attracts institutional traders.
Eventually, the market breaks below the support level, triggering those stop-loss orders and creating panic among buyers. However, instead of continuing lower, the price quickly reverses and forms a Dragonfly Doji.
Ideally, the Dragonfly Doji should close back above the support level because this shows that buyers have completely rejected the breakdown.
However, the setup can still be traded even if the candle closes slightly below the support level, as long as the price action clearly indicates that a liquidity sweep has taken place and the market is preparing to move higher.
Take a look at the example below.
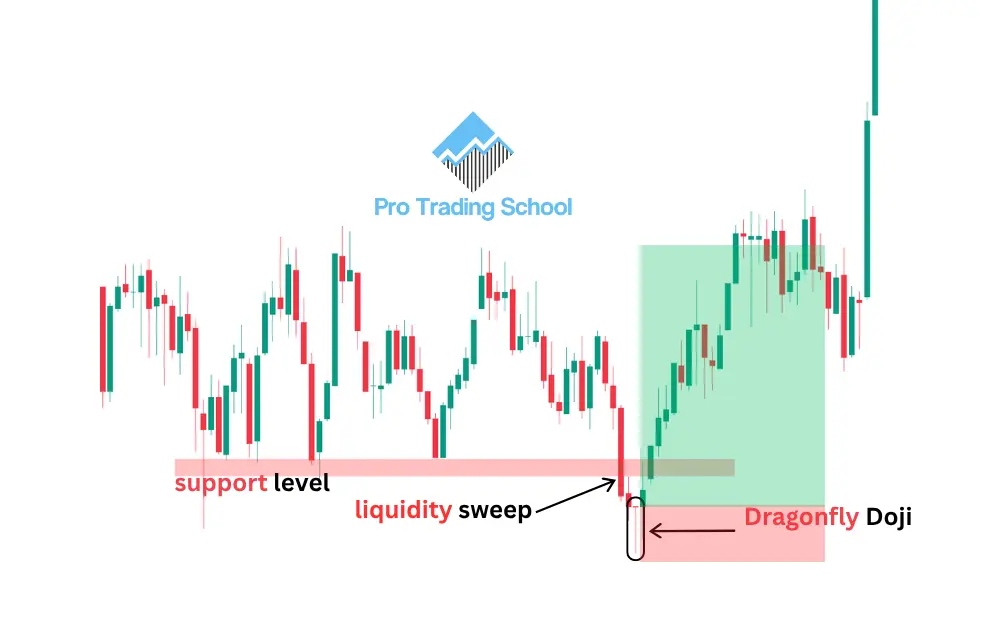
As you can see, the market tested the support level several times before finally breaking below it. After the breakdown, a Dragonfly Doji formed, signaling that sellers had failed to maintain control and that buyers had aggressively absorbed the selling pressure.
This creates a potential trading opportunity:
- Entry: At the close of the Dragonfly Doji candle or on the break above its high.
- Stop-loss: Below the low of the Dragonfly Doji.
- Target: The next significant resistance level or price zone.
In this example, the market moved higher and eventually reached the target as expected.
Does This Strategy Work Every Time?
No, this strategy does not work 100% of the time. There is no trading strategy or candlestick pattern that wins on every trade.
The Dragonfly Doji with a liquidity sweep is simply a high-probability setup that can provide an edge when used correctly.
This is why proper risk management and money management are essential. By keeping your losses small and allowing your winners to run, you can remain profitable over the long term even if some trades fail.
3. Trading the Dragonfly Doji with a Demand Zone
This strategy combines the Dragonfly Doji with a demand zone to identify high-probability bullish reversal opportunities.
A demand zone is an area on the chart where strong buying activity previously entered the market, causing prices to rise aggressively and creating large bullish candles.
The origin of this strong move is known as the demand zone because it represents an area where institutional buying pressure may still be present.
When the market eventually retraces back to this zone and a Dragonfly Doji forms, it suggests that buyers are once again defending the area.
The long lower shadow of the candle shows that sellers attempted to push prices lower but were rejected by strong buying pressure.
Take a look at the chart example below.

As you can see, we can clearly identify a high-quality demand zone that previously caused the market to rally sharply.
After some time, the market retraces back into this zone, and a Dragonfly Doji candlestick pattern appears.
The formation of the Dragonfly Doji indicates that sellers have lost control and that buyers have stepped in aggressively to defend the demand zone.
This shift in momentum suggests that the zone has been validated and that a new bullish move may be about to begin.
This setup provides a potential trading opportunity:
- Entry: At the close of the Dragonfly Doji or on the break above its high.
- Stop-loss: Below the low of the Dragonfly Doji or below the demand zone.
- Target: The next significant resistance level or the next supply zone.
As shown in the example, the market reacted strongly from the demand zone and continued higher, confirming the bullish reversal signal provided by the Dragonfly Doji.
Pro Tip
Not all demand zones are equal. The best demand zones usually have the following characteristics:
- They created a strong impulsive move higher.
- The market spent little time inside the zone before rallying.
- The retracement back to the zone is gradual and not overly aggressive.
- The Dragonfly Doji forms in alignment with the higher timeframe trend.
The more factors of confluence you have, the greater the probability that the trade will succeed.
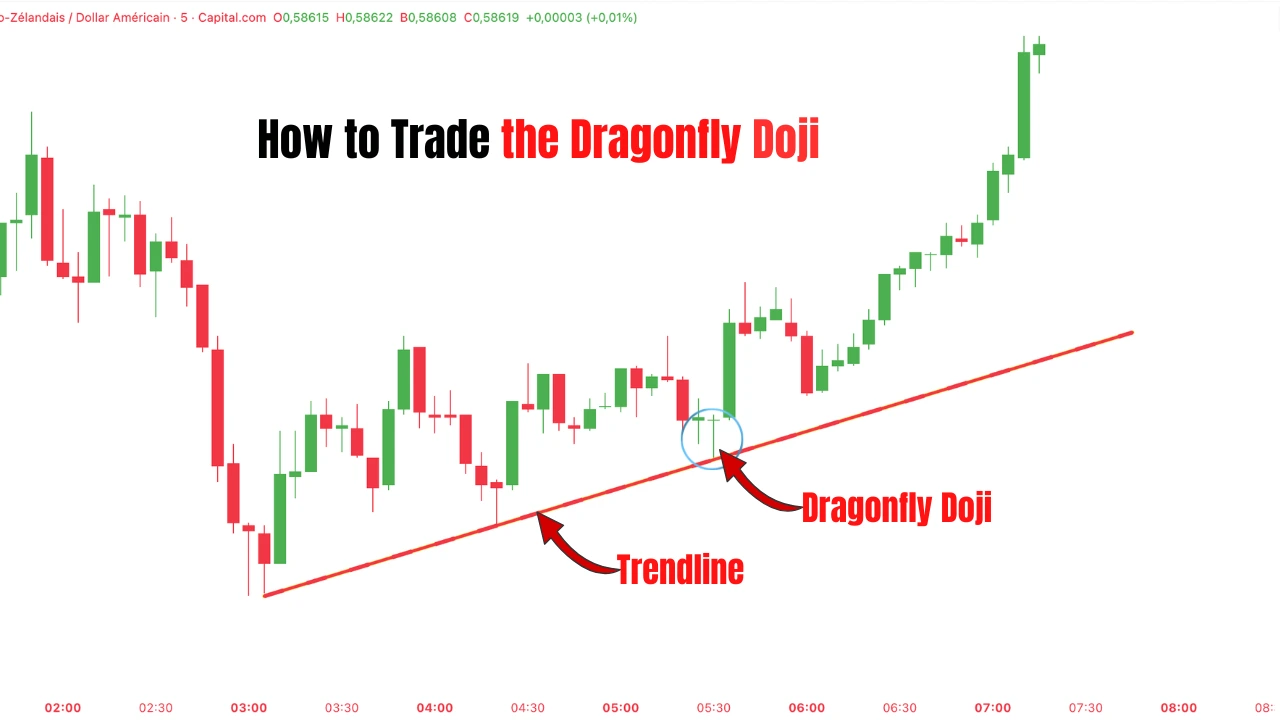
4. Trading the Dragonfly Doji with Trend Lines
This strategy combines the Dragonfly Doji with trend lines to identify high-probability buying opportunities within an existing uptrend.
The idea is simple. First, identify a clear uptrend and draw a trend line by connecting at least two significant swing lows. Then, wait for the market to retrace back toward the trend line.
If a Dragonfly Doji forms at or near the trend line, it indicates that the pullback may be ending and that buyers are stepping back into the market.
Take a look at the chart example below.
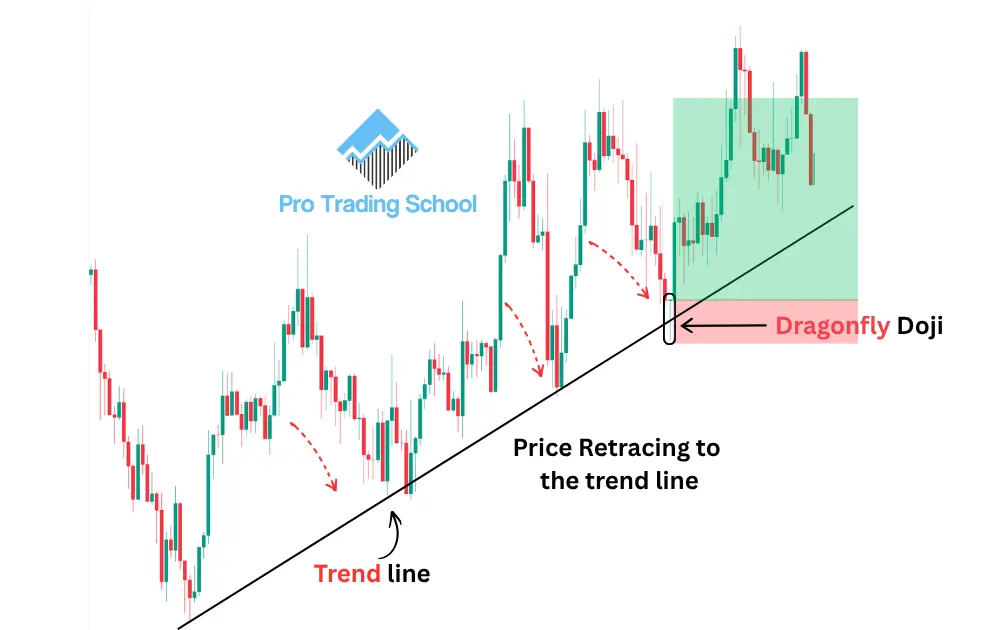
As you can see, the market was clearly trending higher, allowing us to draw a well-defined upward trend line.
After a temporary pullback, the price retraced back to the trend line and formed a Dragonfly Doji, which is exactly the type of setup we are looking for.
The formation of the Dragonfly Doji shows that sellers attempted to push prices lower during the retracement but were rejected by buyers.
This rejection suggests that the pullback may be over and that the primary uptrend is ready to resume.
This setup provides a potential trading opportunity:
- Entry: At the close of the Dragonfly Doji or on the break above its high.
- Stop-loss: Below the low of the Dragonfly Doji.
- Target: The next significant resistance level or the next major price zone.
As shown in the example, the market resumed its upward movement and reached the target as expected.
The Dragonfly Doji Is Not Always a Reversal Pattern
Earlier in this article, we explained that the Dragonfly Doji is primarily known as a bullish reversal pattern because it often appears at the end of downtrends.
However, the pattern can also act as a bullish continuation signal when it forms during a pullback in an established uptrend, especially when it appears at key areas of support such as:
- Trend lines
- Moving averages
- Demand zones
- Previous breakout levels
When used in the right market context, the Dragonfly Doji can be a powerful tool for both reversal and continuation trading strategies.
Dragonfly Doji Pros and Cons
| Pros | Cons |
|---|---|
| Easy to identify because of its distinctive T-shaped appearance. | Can generate false signals, especially in choppy or sideways markets. |
| Provides an early warning that a bullish reversal may be developing. | Should not be traded in isolation and requires additional confirmation. |
| Works well when combined with support levels, demand zones, trend lines, and liquidity sweeps. | The pattern alone does not indicate how far the market is likely to move. |
| Can be used on multiple timeframes, from intraday charts to weekly charts. | Less reliable when it forms against the higher timeframe trend. |
| Offers attractive risk-to-reward opportunities because the stop-loss can be placed below the candle’s low. | Can occasionally fail if strong selling pressure remains in the market. |
| Reflects market psychology clearly by showing that buyers rejected lower prices. | Not every Dragonfly Doji leads to a major trend reversal; some only produce short-term bounces. |
| Can be used as both a reversal pattern and a continuation pattern when it forms during pullbacks in an uptrend. | Confirmation often comes one or more candles later, which may reduce the reward-to-risk ratio. |
| Works across different markets, including stocks, forex, futures, and cryptocurrencies. | The quality of the setup depends heavily on the surrounding market context and confluence factors. |
Key Takeaway
The Dragonfly Doji is a powerful candlestick pattern because it reveals a shift in control from sellers to buyers. However, like every trading setup, it is not a holy grail.
The best results come from combining it with other technical factors such as support and resistance, demand zones, trend lines, and proper risk management.
Conclusion
The Dragonfly Doji is one of the most powerful candlestick patterns for identifying potential bullish reversals.
Its unique T-shaped appearance shows that sellers initially controlled the market but were ultimately overpowered by buyers, signaling that momentum may be shifting to the upside.
However, the Dragonfly Doji should never be traded in isolation. The highest-probability setups occur when the pattern forms at important areas such as support levels, demand zones, trend lines, or after a liquidity sweep.
By combining the Dragonfly Doji with other forms of technical analysis and applying proper risk management, traders can significantly improve their decision-making and increase their chances of long-term success.
Frequently Asked Questions (FAQs)
Is the Dragonfly Doji bullish or bearish?
The Dragonfly Doji is generally considered a bullish candlestick pattern because it often appears at the end of a downtrend and signals that buyers have rejected lower prices and may be taking control of the market.
However, the pattern should always be confirmed with other technical factors, as not every Dragonfly Doji leads to a bullish reversal.
What does a Dragonfly candlestick mean?
A Dragonfly candlestick means that sellers initially pushed the price significantly lower during the trading session, but buyers stepped in aggressively and drove the price back up, causing the market to close near its opening price.
This shift in momentum suggests that bearish pressure is weakening and that a potential bullish reversal or continuation move may be developing.
What is the Dragonfly trading strategy?
The Dragonfly trading strategy involves using the Dragonfly Doji in combination with other forms of technical analysis to identify high-probability trading opportunities.
The pattern works best when it forms at important market areas such as support levels, demand zones, trend lines, or after a liquidity sweep.
Traders typically enter at the close of the Dragonfly Doji or on the break above its high, place a stop-loss below the candle’s low, and target the next significant resistance level.