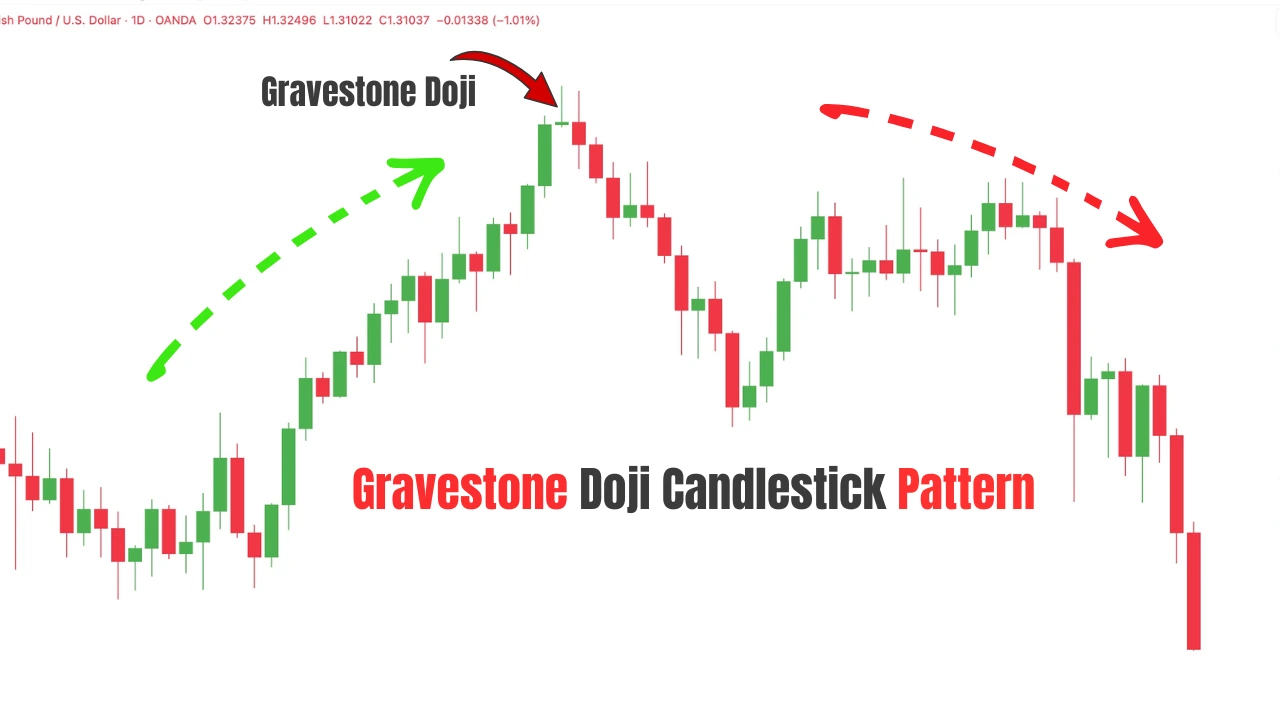
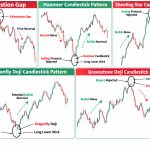
A Gravestone Doji is a Japanese candlestick pattern that signals strong rejection of higher prices. It commonly forms after an uptrend and suggests that buyers attempted to push the market higher but lost control to sellers, increasing the likelihood of a bearish reversal.
Although it is primarily known as a reversal pattern, the Gravestone Doji can also act as a continuation signal when it forms at a key resistance level during a downtrend.
For this reason, many traders use it alongside support and resistance levels, supply and demand zones, and other technical analysis tools to identify potential trading opportunities.
What Does the Gravestone Doji Mean?

The Gravestone Doji indicates that buyers are losing control of the market and that sellers may be taking over. As a result, the market may be preparing for a move lower.
During the trading session, buyers initially push the price higher, showing their intention to continue the uptrend. However, sellers step in and apply enough selling pressure to drive the price back down toward the opening level before the session closes.
This shift in control is represented by the long upper shadow of the Gravestone Doji. The upper wick shows that buyers were able to move the market higher, but they failed to maintain control as sellers overwhelmed them before the close.
When the Gravestone Doji forms at a key resistance level, it often signals the end of bullish momentum and the beginning of a bearish reversal. The stronger the resistance level, the more significant the signal can become.
Gravestone Doji Chart Example
To help you understand what a Gravestone Doji looks like on a price chart, take a look at the example below.
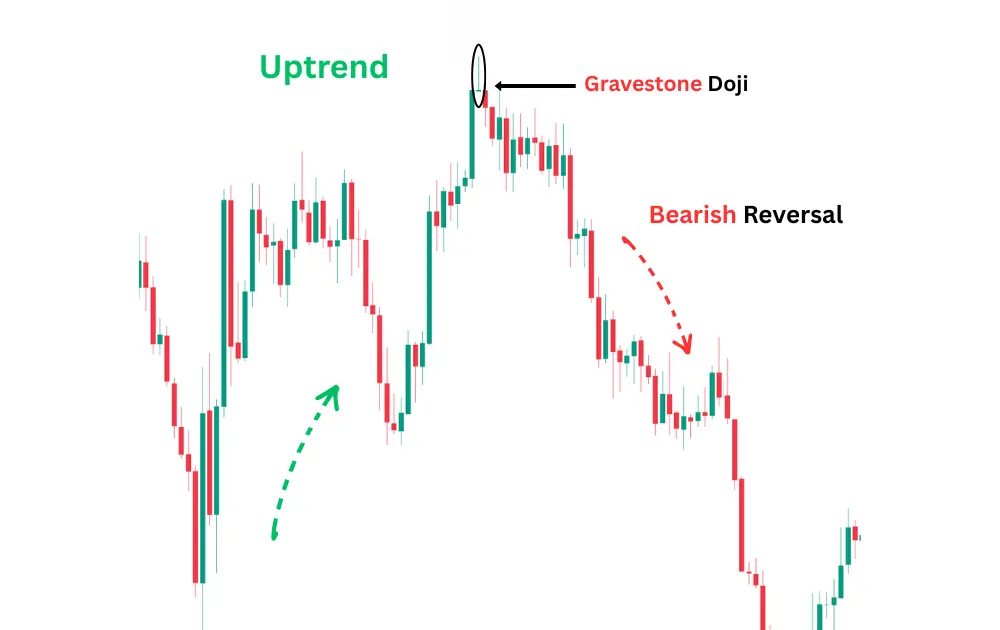
As you can see, the market was trending upward, which means that buyers were in control. However, a Gravestone Doji eventually formed. The pattern is characterized by a small real body, or no real body at all, and a long upper shadow.
This formation shows that buyers initially pushed the price significantly higher during the trading session.
However, sellers stepped in aggressively and pushed the price back down before the session closed. The long upper wick represents the strong rejection of higher prices and indicates that sellers have gained control of the market.
In this example, the Gravestone Doji marked a shift in momentum from buyers to sellers. As you can see, the market moved lower after the pattern formed, confirming a bearish trend reversal.
It is important to understand that the Gravestone Doji should not be traded in isolation. Like any other candlestick pattern, it has little significance if it forms under the wrong market conditions.
The best trading opportunities occur when the pattern forms at key resistance levels, supply zones, liquidity sweeps, or other important technical areas.
For this reason, I always recommend combining the Gravestone Doji with other forms of technical analysis rather than treating it as a holy grail. Traders who rely solely on candlestick patterns without considering the broader market context often struggle to achieve consistent results.
The Gravestone Doji belongs to the Doji family of candlestick patterns. If you would like to learn more about the different types of Doji patterns and how to trade them, check out our complete guide on the Doji Candlestick Pattern: Best Entry and Exit Trading Strategies.
Gravestone Doji at the Bottom of a Downtrend
The Gravestone Doji is primarily a bearish reversal pattern that works best when it forms near the top of an uptrend, especially at a key resistance level.
A resistance level is an area where selling pressure is likely to enter the market and potentially push prices lower.
While the Gravestone Doji can appear during a downtrend, it should generally be avoided when it forms at the bottom of an extended bearish move. Take a look at the chart below.

As you can see, the market was already trending downward, which means that sellers were already in control. After a prolonged decline, a Gravestone Doji formed. Although the pattern may appear bearish at first glance, it should not be traded simply because it is a Gravestone Doji.
The reason is that the downtrend is already extended. At this stage, many traders who enter a new short position risk selling at the worst possible moment, just before a pullback or a trend reversal occurs. This is a common mistake among beginner traders.
Instead of selling at the bottom of an extended downtrend, it is often better to wait for the market to retrace back to a key resistance level and then look for new bearish confirmation signals. This approach allows you to trade from a better location and improve your risk-to-reward ratio.
As shown in the chart, traders who entered a short position based solely on the Gravestone Doji would have been trapped as the market reversed higher and eventually hit their stop loss. This example highlights the importance of trading the pattern within the proper market context rather than relying on the candlestick alone.
Gravestone Doji Trading Strategies
Trading the Gravestone Doji with Resistance Levels
The first strategy involves trading the Gravestone Doji in combination with a key resistance level.
Take a look at the chart example below.

As you can see, the market was trending upward, which means that buyers were in control. Eventually, the price reached a level where it was strongly rejected, creating a clear resistance level.
The market then pulled back before rallying once again toward the same resistance area. This time, a Gravestone Doji formed at the level.
The first important point is that the initial rejection from the resistance level is the first sign that buyers may be losing control.
If buyers were still dominating the market, they would have been able to push the price higher. Instead, they encountered strong selling pressure and were forced to retreat.
The second important point is what happens when the market returns to the resistance level. Buyers attempt to break above the level once again, but they are strongly rejected. This rejection is reflected in the long upper shadow of the Gravestone Doji.
The Gravestone Doji represents the battle between buyers and sellers at the resistance level. Buyers push the market higher, but sellers absorb the buying pressure and force the price back down before the candle closes.
When this pattern forms at a key resistance level, it often signals the end of bullish momentum and the beginning of a bearish move.
Before taking any trade, it is important to perform a top-down analysis. Check the higher time frame and make sure it supports the direction of your trade.
If the higher time frame is strongly bullish while you are looking for a bearish setup, it is often better to avoid the trade. The higher time frame carries more weight than the lower trading time frame.
Once all the conditions are met, you can execute the trade:
- Entry: At the close of the Gravestone Doji.
- Stop Loss: Above the high of the Gravestone Doji.
- Target: The next key support level.
As shown in the chart, the market moved lower and reached the target. However, this does not mean the strategy will work every time.
No trading setup has a 100% success rate. Long-term profitability comes from proper risk management and maintaining a favorable risk-to-reward ratio, not from trying to achieve an extremely high win rate.
Trading the Gravestone Doji at a Supply Zone
Another effective way to trade the Gravestone Doji is by combining it with a supply zone.
Take a look at the chart example below.

As you can see, the market was initially trending upward, with buyers in control. However, a strong bearish move eventually occurred, creating a clear supply zone. This sharp decline indicates that sellers entered the market aggressively and overwhelmed buyers.
After the bearish move, the market retraced back toward the supply zone. When price reached the zone, a Gravestone Doji formed.
The pattern was characterized by a long upper shadow, little to no lower shadow, and an opening and closing price near the candle’s low.
The formation of the Gravestone Doji at the supply zone provides an additional layer of confirmation that sellers are defending the area. Buyers attempt to push the market higher, but they are strongly rejected as sellers regain control and force the price back down before the candle closes.
When a Gravestone Doji forms inside a well-defined supply zone, it often signals the end of the pullback and the beginning of a new bearish move.
You can trade the setup using the following rules:
- Entry: At the close of the Gravestone Doji.
- Stop Loss: Above the high of the Gravestone Doji.
- Target: The next key support level or demand zone.
As you can see in the chart, the market reversed from the supply zone and moved lower as expected.
While this setup can provide high-probability trading opportunities, it should always be combined with proper risk management and a favorable risk-to-reward ratio.
Trading the Gravestone Doji as a Trend Continuation Signal
Most traders think that the Gravestone Doji can only be used as a bearish reversal pattern. However, what many traders overlook is that this candlestick pattern can also be used as a bearish continuation signal when it forms under the right market conditions.
Take a look at the chart example below.

As you can see, the market was trending downward, which means that sellers were in control. During this downtrend, we can connect the swing highs to draw a bearish trend line.
This trend line acts as a dynamic resistance level, and whenever the market approaches it, there is a possibility that the downtrend may continue.
As the market retraced higher and retested the trend line, a Gravestone Doji candlestick pattern formed.
This pattern indicates that buyers attempted to push the market higher, but they were unable to break above the trend line resistance. Sellers stepped in aggressively and forced the price back down before the candle closed.
In this situation, the Gravestone Doji does not signal a trend reversal. Instead, it signals the end of the pullback and the potential continuation of the existing downtrend.
You can trade the setup using the following rules:
- Entry: At the close of the Gravestone Doji.
- Stop Loss: Above the high of the Gravestone Doji.
- Target: The next key support level or the previous swing low.
As shown in the chart, the market resumed its downward movement after the Gravestone Doji formed and continued in the direction of the prevailing trend.
This example highlights the importance of trading candlestick patterns within the proper market context rather than assuming that every Gravestone Doji automatically signals a reversal.
Trading the Gravestone Doji with the 50-Day Simple Moving Average
Another effective way to trade the Gravestone Doji is by combining it with the 50-day Simple Moving Average (SMA).
The strategy is straightforward. We use the 50-day SMA as a dynamic resistance level and wait for the market to retrace back to it during a downtrend.
Once the price reaches the moving average, we look for a Gravestone Doji pattern to confirm that sellers are defending the area.
Take a look at the chart example below.

As you can see, the market was trending downward, which means that sellers were in control.
Although the Gravestone Doji is commonly known as a bearish reversal pattern, it can also be used as a bearish continuation signal when it forms during a pullback in a downtrend.
In this example, the market retraced back toward the 50-day Simple Moving Average. As soon as the price reached the moving average, a Gravestone Doji formed, signaling strong rejection of higher prices.
This indicates that buyers failed to break above the dynamic resistance level and that sellers may be ready to resume the downtrend.
The combination of the Gravestone Doji and the 50-day SMA provides a high-probability continuation setup because both signals point in the same direction.
You can trade the setup using the following rules:
- Entry: At the close of the Gravestone Doji.
- Stop Loss: Above the high of the Gravestone Doji.
- Target: The next key support level or swing low.
As shown in the chart, the market resumed its downward movement after the pattern formed and eventually reached the target.
This example demonstrates how the Gravestone Doji can be used not only as a reversal pattern but also as a powerful trend continuation signal when combined with a dynamic resistance level such as the 50-day Simple Moving Average.
Limitations of the Gravestone Doji Pattern
Like any other candlestick pattern, the Gravestone Doji is not a perfect trading signal. While it can be highly effective when it forms at key resistance levels, supply zones, or other important technical areas, it can also generate false signals and losing trades.
Many beginner traders make the mistake of assuming that every Gravestone Doji will lead to a bearish reversal.
In reality, the success of the pattern depends on the market context, trend direction, and the location where it forms.
Understanding its limitations can help you avoid low-probability setups and use the pattern more effectively as part of a complete trading strategy.
The table below highlights some of the main limitations of the Gravestone Doji pattern.
| Limitation | Explanation |
|---|---|
| Not Always Reliable | A Gravestone Doji does not guarantee a bearish reversal. The market can continue moving higher despite the pattern. |
| Requires Confirmation | Traders should wait for additional confirmation, such as a bearish candle, resistance level, or break of market structure before entering a trade. |
| Weak Without Context | The pattern is much less effective when it forms away from important technical levels such as resistance, supply zones, or trend lines. |
| Can Produce False Signals | In volatile markets, a Gravestone Doji may appear frequently and generate misleading reversal signals. |
| Less Effective in Strong Uptrends | During powerful bullish trends, sellers may temporarily push the price down, but buyers can quickly regain control and continue the uptrend. |
| Not a Standalone Trading Strategy | The pattern should be combined with other technical analysis tools rather than traded on its own. |
| Difficult for Beginners | New traders often focus only on the candlestick and ignore the broader market structure, trend direction, and key levels. |
| Performance Varies Across Market Conditions | The reliability of the pattern depends heavily on trend strength, volatility, and the location where it forms. |
| Poor Risk-to-Reward in Some Setups | Trading the pattern at the wrong location can result in large stop losses and limited profit potential. |
| Can Lead to Overtrading | Traders who take every Gravestone Doji they see often enter low-quality setups and increase their losses. |
Conclusion
The Gravestone Doji is a powerful candlestick pattern that signals strong rejection of higher prices.
While it is commonly used as a bearish reversal pattern, it can also be used as a bearish continuation signal when it forms under the right market conditions.
However, the pattern should never be traded in isolation. The best trading opportunities occur when the Gravestone Doji forms at key resistance levels, supply zones, trend lines, or other important technical areas.
By combining the pattern with proper market analysis and risk management, traders can significantly improve their chances of success.
Frequently Asked Questions
Is a Gravestone Doji Bullish or Bearish?
The Gravestone Doji is generally considered a bearish candlestick pattern. It indicates strong rejection of higher prices and often signals a potential bearish reversal when it forms at a key resistance level after an uptrend.
However, it can also act as a bearish continuation signal when it forms during a pullback in a downtrend.
Should I Trade Every Gravestone Doji?
No. Not every Gravestone Doji is worth trading. The pattern is most effective when it forms at important technical levels such as resistance zones, supply zones, trend lines, or liquidity sweep areas.
Trading every Gravestone Doji without considering the overall market context can lead to unnecessary losses.
Can a Gravestone Doji Be Green?
Yes. A Gravestone Doji can be either green or red. The color of the candle is not the most important factor.
What matters is the candle’s structure: a long upper shadow, little to no lower shadow, and an opening and closing price near the low of the candle. Both green and red Gravestone Dojis can carry the same bearish implications.
What Is the Use of a Gravestone Doji?
The Gravestone Doji is used to identify potential bearish reversals and bearish continuation opportunities. It helps traders recognize areas where buyers have been strongly rejected by sellers.
Many traders combine the pattern with support and resistance levels, supply and demand zones, trend lines, and other technical analysis tools to find high-probability trading setups.


I’m interested to learn with your strategy
I am very pleased I found this link. I had very little knowledge on Doji candlestick but now I am different. This book is very educative and I look forward to read about the rest.
Kudos
Thank you Chris for sharing your knowledge, expertise, and time with new traders. You bring hope and direction in the Forex maze. You are very analytic the way of sharing your knowledge and by the way you teach filter a lot of noise in the competitive Forex market.
Regards
Danie