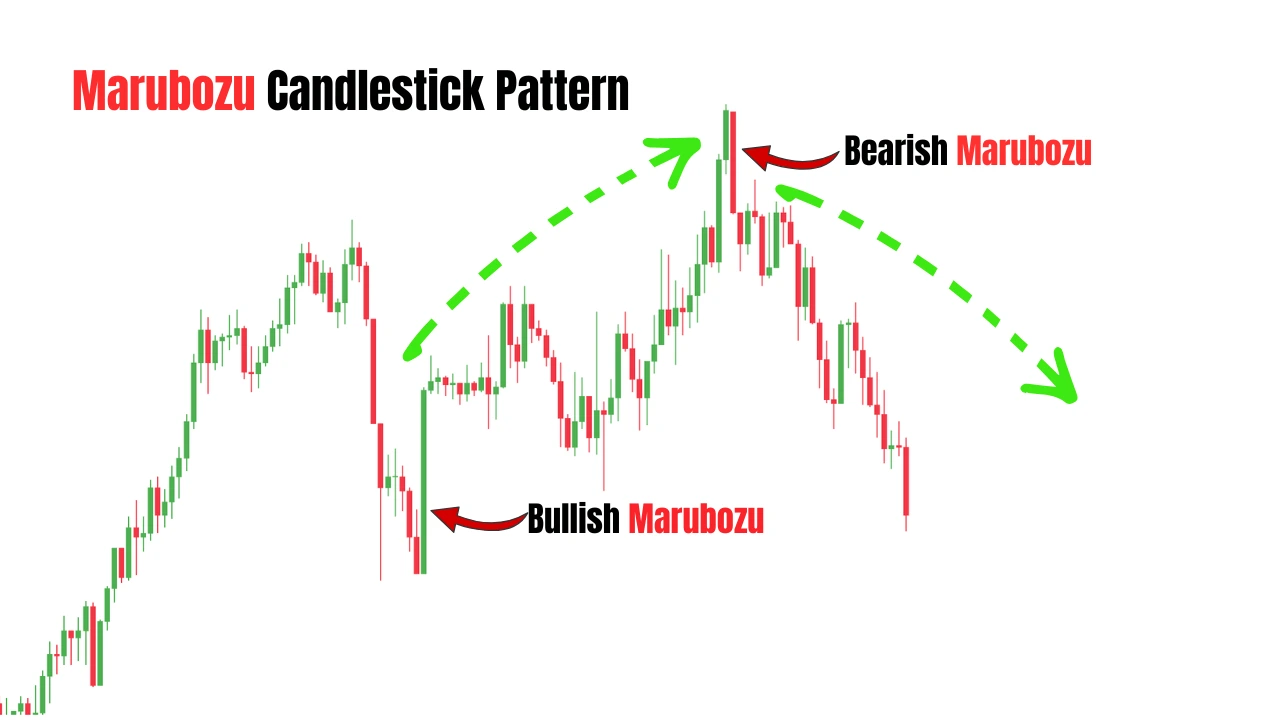
A Marubozu candlestick pattern is a Japanese candlestick pattern characterized by a long body and little to no upper or lower shadows.
It represents strong buying or selling pressure, indicating that one side of the market was in control throughout the entire trading session.
A bullish Marubozu forms when buyers dominate the market from the opening price to the closing price, pushing the price higher with minimal resistance.
A bearish Marubozu forms when sellers remain in control throughout the session, driving the price lower without significant buying pressure.
Because of its large body and lack of noticeable wicks, the Marubozu candle is often viewed as a sign of strong momentum and increased market participation.
Traders frequently use this pattern to identify potential trend continuations, breakout opportunities, and shifts in market sentiment.
Key Takeaways
-The Marubozu candlestick pattern is characterized by a large body and little to no upper or lower shadows.
-A Bullish Marubozu signals strong buying pressure and shows that buyers controlled the market throughout the trading session.
-A Bearish Marubozu signals strong selling pressure and indicates that sellers remained in control from open to close.
-There are three main types of Marubozu candles: Full Marubozu, Open Marubozu, and Close Marubozu.
-The pattern can be used to identify potential trend reversals, trend continuations, and breakout opportunities.
-Marubozu candles are most effective when combined with technical analysis tools such as supply and demand zones, support and resistance levels, and trend lines.
-Waiting for the candle to close is essential because a candle’s appearance can change significantly before the session ends.
-Avoid trading oversized Marubozu candles that require large stop losses and offer poor risk-to-reward ratios.
-The Marubozu pattern is not a standalone trading strategy and should always be supported by proper risk management.
-Like all candlestick patterns, the Marubozu can fail, which is why long-term success depends on discipline, money management, and maintaining a favorable risk-to-reward ratio.
Marubozu Candlestick Pattern Chart Examples
The Marubozu pattern does not appear as frequently as many other candlestick formations. However, when it does appear, it often signals unusually strong buying or selling pressure entering the market.
Look at the bullish Marubozu example below.
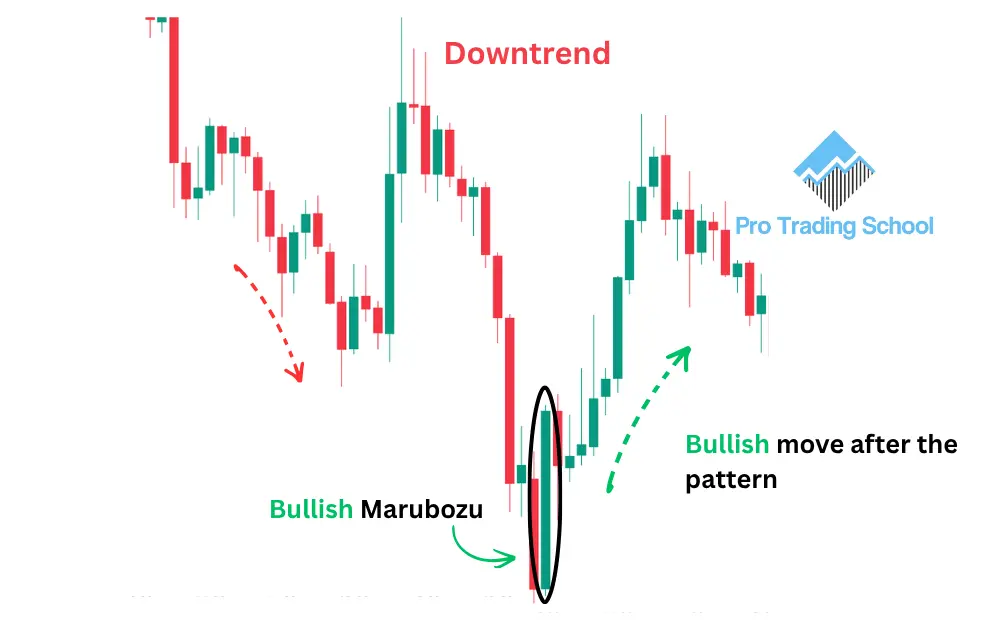
As you can see, the market was previously trending lower, which means sellers were in control. Then a large bullish Marubozu candle formed.
This type of candle indicates that buyers aggressively entered the market and pushed prices higher throughout the entire trading session.
Notice how the candle has little to no upper or lower shadows. If sellers had been able to challenge the move, the candle would likely have developed noticeable wicks.
Instead, the strong body of the candle suggests that buyers maintained control from the opening price to the closing price.
This shift in momentum may signal that institutional traders, large market participants, or a significant increase in buying pressure has entered the market. As a result, the bearish trend may be weakening, and a bullish reversal could be developing.
Now look at the bearish Marubozu example below.
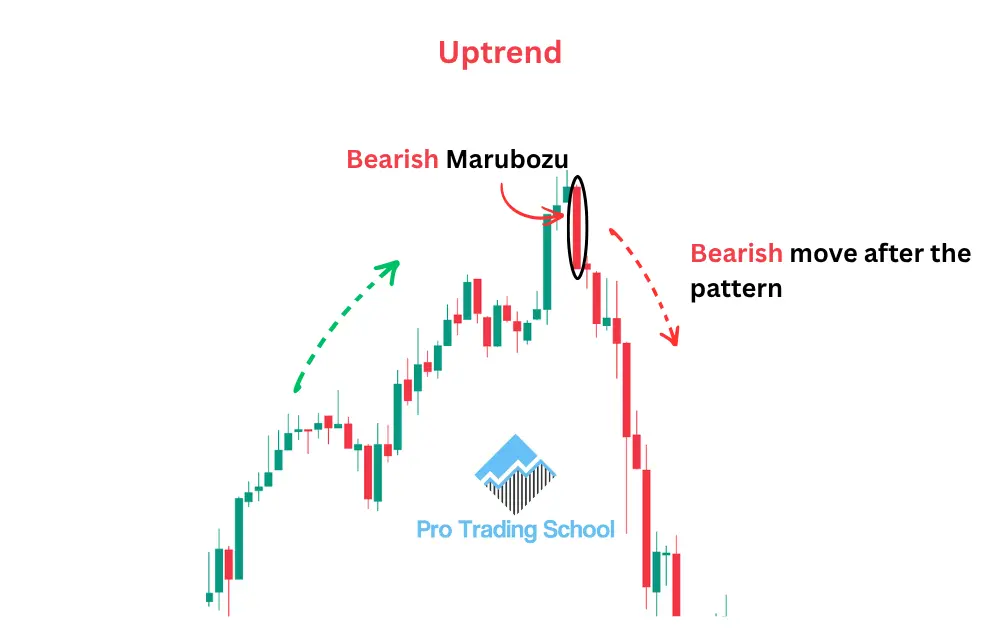
In this chart, the market was trending higher, indicating that buyers were controlling the market. Suddenly, a large bearish Marubozu candle appeared.
This pattern shows that sellers overwhelmed buyers during the trading session. The absence of significant shadows suggests that selling pressure remained strong from the opening price to the closing price, leaving little room for buyers to push prices higher.
A bearish Marubozu can indicate profit-taking by existing buyers, aggressive short selling, or the entry of large institutional sellers. In some cases, it signals the end of bullish momentum and the potential beginning of a new downtrend.
Keep in mind that the examples shown above are provided for educational purposes only. A Marubozu candle alone is not a trading strategy.
Successful traders combine candlestick patterns with additional forms of analysis such as support and resistance levels, market structure, volume, trend analysis, liquidity sweeps, or supply and demand zones before making trading decisions.
The Marubozu Candlestick Anatomy
The Marubozu candlestick has a unique structure that makes it easy to recognize on a price chart.
Unlike many other candlestick patterns, a Marubozu candle is defined by its large body and the absence of significant upper or lower shadows. This structure reflects strong conviction from either buyers or sellers.
Bullish Marubozu Anatomy
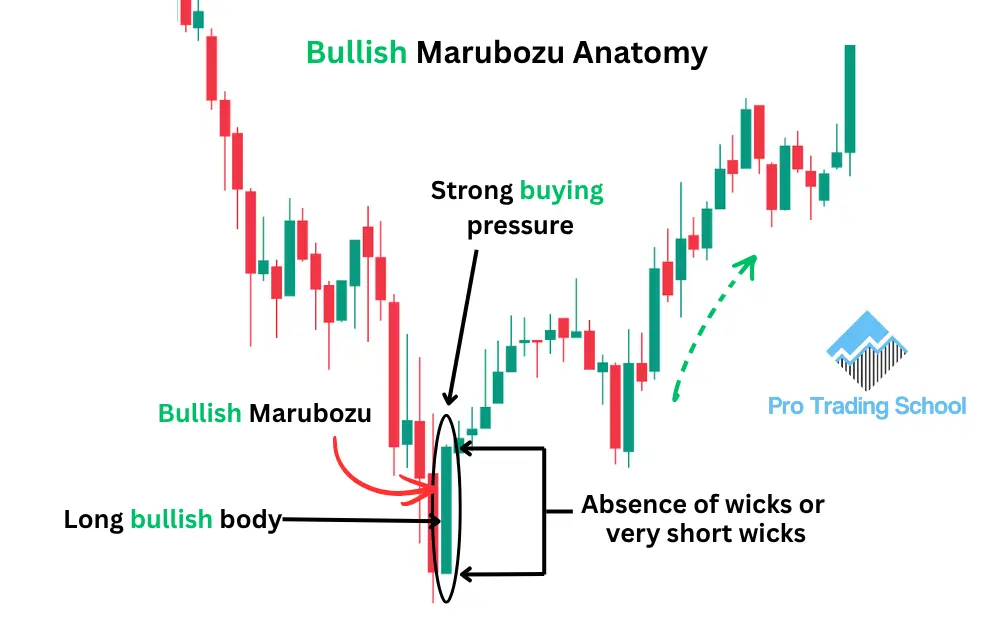
A bullish Marubozu consists of the following characteristics:
- A long bullish body that shows strong buying pressure throughout the trading session.
- The closing price is significantly higher than the opening price, meaning the candle is typically displayed in green or white, depending on your chart settings.
- Little to no upper shadow, indicating that buyers were able to keep prices near the session high.
- Little to no lower shadow, suggesting that sellers had very little influence during the session.
This type of candle shows that buyers controlled the market from the opening bell to the close, demonstrating strong bullish momentum.
Bearish Marubozu Anatomy
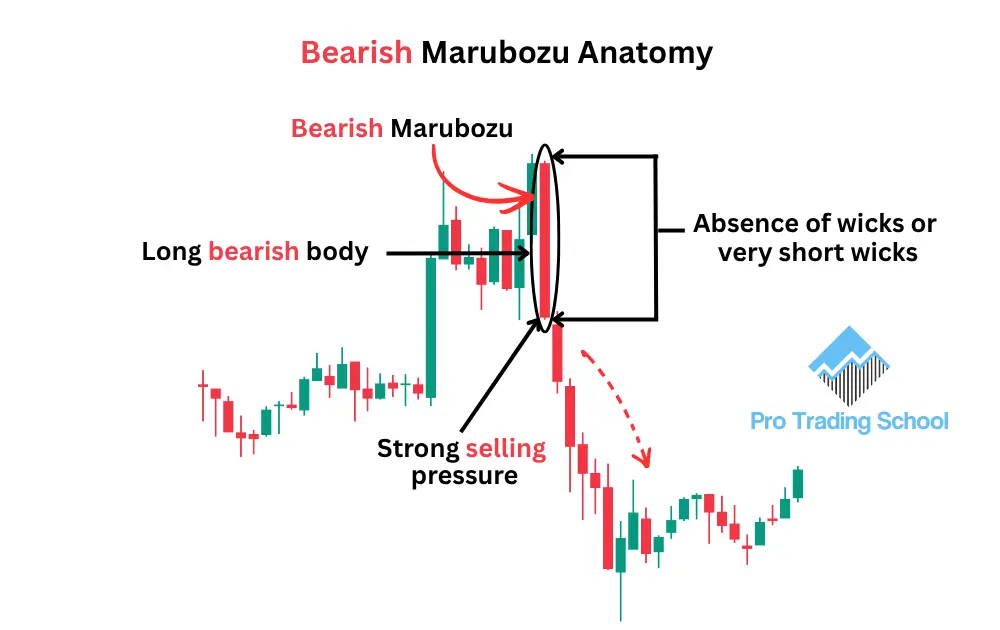
A bearish Marubozu shares the same structure but reflects the opposite market sentiment:
- A long bearish body that signals strong selling pressure.
- The closing price is significantly lower than the opening price, making the candle appear red or black on most charting platforms.
- Little to no upper shadow, indicating that buyers were unable to push prices meaningfully higher.
- Little to no lower shadow, showing that sellers maintained control until the end of the session.
A bearish Marubozu suggests that sellers dominated the market throughout the trading period and often reflects strong downward momentum.
Types of Marubozu Candlesticks
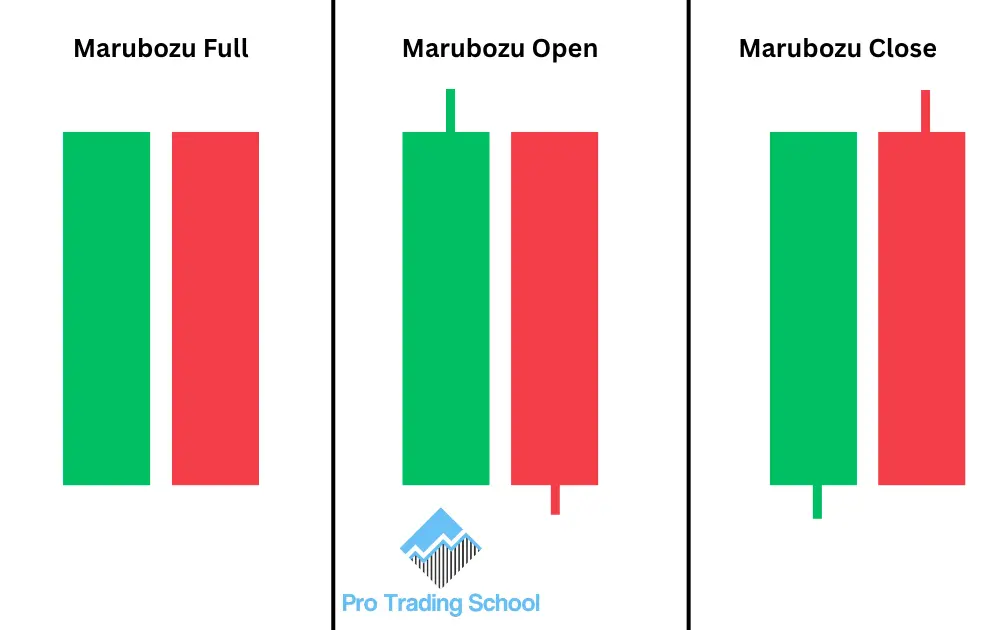
Not all Marubozu candles look exactly the same. Depending on the location of the shadows, traders generally classify this candlestick pattern into three main types: the Full Marubozu, the Open Marubozu, and the Close Marubozu.
Although all three variations reflect strong buying or selling pressure, understanding their differences can help traders better interpret market sentiment.
Full Marubozu
The Full Marubozu is the purest form of the pattern. It has a long body with no upper shadow and no lower shadow.
In a bullish Full Marubozu, the price opens at the low of the session and closes at the high. In a bearish Full Marubozu, the price opens at the high and closes at the low.
Because there are no visible wicks, this version indicates complete control by either buyers or sellers throughout the trading session.
Open Marubozu
The Open Marubozu has no shadow at the opening side of the candle but may have a small shadow at the closing side.
A bullish Open Marubozu opens at the session low and closes near the high, leaving a small upper wick.
A bearish Open Marubozu opens at the session high and closes near the low, leaving a small lower wick.
This pattern still signals strong momentum, although it suggests that the opposing side of the market was able to create a small reaction before the session ended.
Close Marubozu
The Close Marubozu has no shadow at the closing side of the candle but may have a small shadow at the opening side.
A bullish Close Marubozu closes at the session high, while a bearish Close Marubozu closes at the session low.
This variation shows that buyers or sellers finished the session with strong conviction, even though the opposing side may have had some influence near the opening of the candle.
While the Full Marubozu is generally considered the strongest variation, both the Open Marubozu and Close Marubozu can provide valuable information about market momentum and the balance of power between buyers and sellers.
Marubozu Candlestick Pattern Trading Strategies
The Marubozu candlestick pattern can be used in several trading strategies. However, like most candlestick patterns, it performs best when combined with other forms of technical analysis rather than traded on its own.
One of the most effective ways to use this pattern is with supply and demand zones, where large institutional traders often enter and exit the market.
Trading the Marubozu Pattern with Demand Zones
Look at the chart example below.
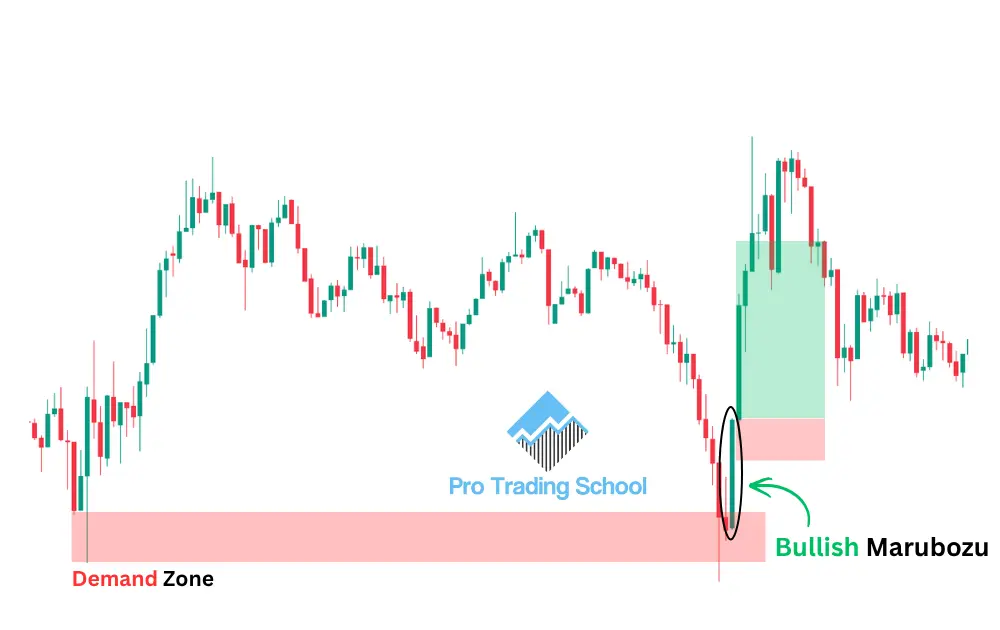
As you can see, the market created a demand zone and then moved higher. After the bullish move, the price started to retrace back toward the demand area.
When the market reached the demand zone, buyers stepped in and rejected lower prices. Shortly afterward, a bullish Marubozu candle formed.
The appearance of a bullish Marubozu at a demand zone is significant because it suggests that strong buying pressure has entered the market.
The large body of the candle and the lack of significant shadows indicate that buyers were in control throughout the session.
To trade this setup, you can place your entry at the close of the bullish Marubozu candle. The stop loss can be placed slightly below the demand zone or below the low of the signal candle, depending on your risk management rules. The profit target can be placed at the next major resistance level or supply zone.
As shown in the example, the market continued moving higher after the pattern formed and eventually reached the target.
Keep in mind that no trading setup works all the time. Even high-quality setups can fail. Long-term success comes from combining a positive risk-to-reward ratio with proper money management rather than trying to win every trade.
Trading the Marubozu Pattern with Supply Zones
Now look at another chart example.
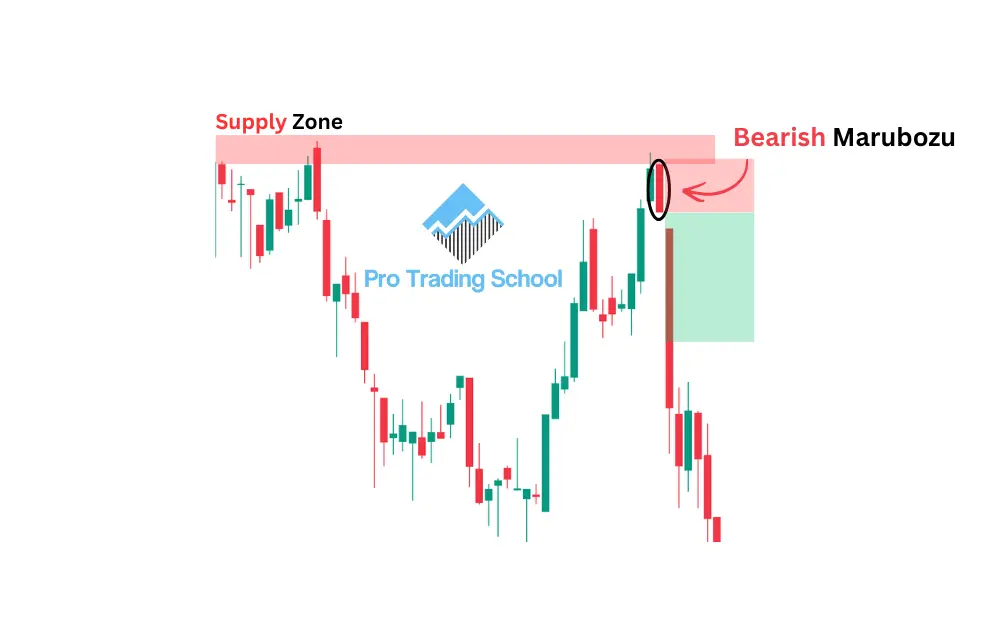
In this case, the market moved sharply lower, creating a supply zone before continuing its decline. After some time, the price retraced back to test the supply area.
When the market reached the zone, sellers defended the level and a bearish Marubozu candle formed.
The formation of a bearish Marubozu at a supply zone indicates strong selling pressure and suggests that large market participants may be entering short positions or liquidating long positions.
Because the candle closes near its low and contains little to no shadows, it shows that sellers maintained control throughout the session.
To trade this setup, you can place your entry at the close of the bearish Marubozu candle. The stop loss can be placed above the supply zone or above the high of the signal candle. The profit target can be set at the next major support level or demand zone.
As you can see in the example, the market continued moving lower after the pattern formed, providing a favorable risk-to-reward opportunity.
The key idea behind this strategy is to use the Marubozu candle as confirmation that buyers or sellers are actively defending a supply or demand zone. This additional confirmation can help traders avoid taking trades based solely on the zone itself.
Trading the Marubozu Pattern with Trend Lines
Another effective way to use the Marubozu candlestick pattern is in combination with trend lines. This strategy helps traders identify potential trend reversals and provides confirmation that momentum may be shifting from one side of the market to the other.
Bullish Marubozu Trend Line Breakout
Look at the chart example below.
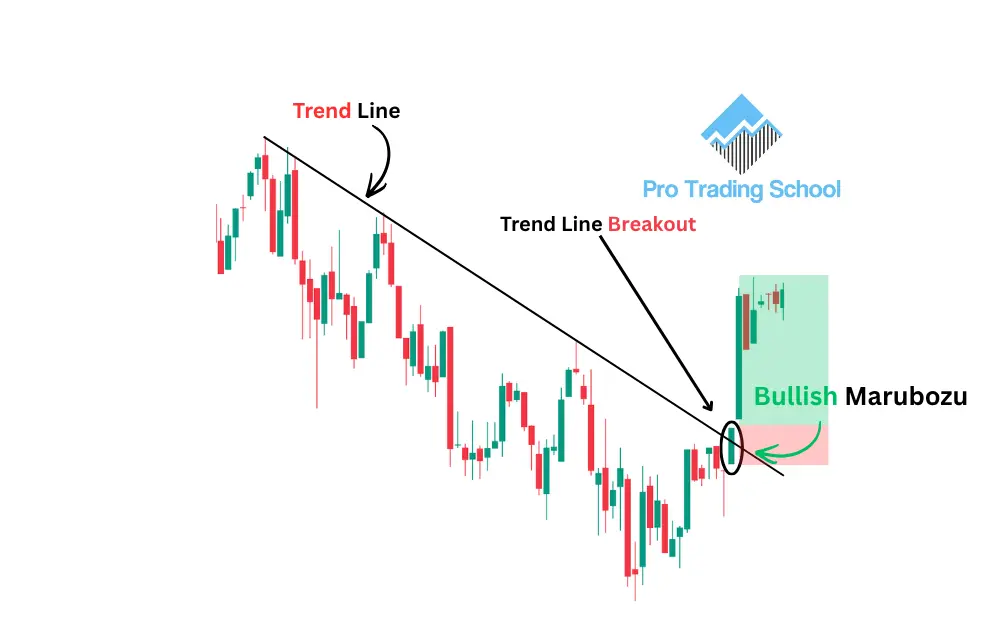
As you can see, the market was trending lower, which means sellers were controlling the price action. By connecting the swing highs, we can draw a bearish trend line that acts as dynamic resistance.
Eventually, the trend line is broken by a strong bullish Marubozu candle. This is an important signal because the large bullish body shows that buyers have gained control of the market.
The breakout of the trend line combined with the formation of a bullish Marubozu suggests that the downtrend may be ending and that a new uptrend could be developing.
To trade this setup, you can place your entry at the close of the bullish Marubozu candle. The stop loss can be placed below the low of the signal candle or below the nearest swing low. The profit target can be set at the next major resistance level.
In this example, the trade was successful because the trend line breakout was supported by strong bullish momentum, increasing the probability of a trend reversal.
Bearish Marubozu Trend Line Breakout
Now look at another chart example.
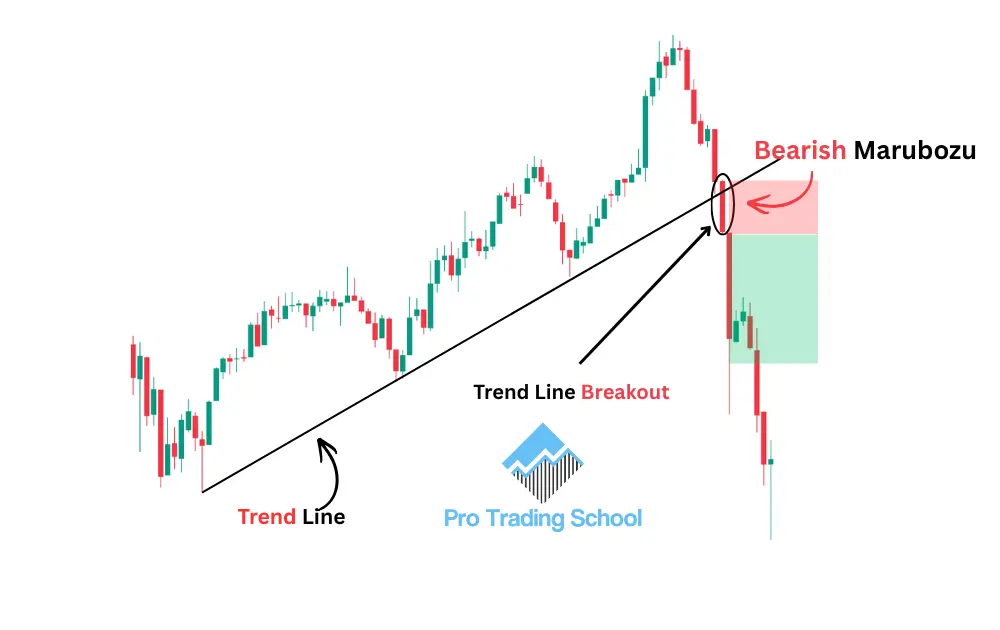
In this case, the market was trending higher, indicating that buyers were in control. By connecting the swing lows, we can draw a bullish trend line that acts as dynamic support.
As the trend develops, the market eventually breaks below the trend line with a strong bearish Marubozu candle.
The size of the candle and the lack of significant shadows show that sellers dominated the session and successfully pushed prices lower.
The combination of a trend line break and a bearish Marubozu often signals weakening bullish momentum and may indicate the beginning of a new downtrend.
To trade this setup, you can place your entry at the close of the bearish Marubozu candle. The stop loss can be placed above the high of the signal candle or above the nearest swing high. The profit target can be set at the next major support level.
As shown in the example, the market continued moving lower after the breakout, rewarding traders who waited for confirmation before entering the trade.
Like all trading strategies, this setup is not guaranteed to work every time. The goal is not to predict every market move but to identify situations where the probability is tilted in your favor by combining trend line analysis with strong momentum confirmation from the Marubozu pattern.
If you’d like to learn more about candlestick patterns, be sure to check out our 33 Candlestick Patterns Cheat Sheet (Simple Visual Guide).
Advantages and Limitations of the Marubozu Candlestick Pattern
| Advantages | Limitations |
|---|---|
| Easy to identify because of its large body and minimal shadows. | Can produce false signals when traded without additional confirmation. |
| Clearly shows strong buying or selling pressure during a trading session. | Does not provide a profit target or price objective by itself. |
| Works across multiple markets, including stocks, forex, cryptocurrencies, and futures. | A single candle cannot reveal the broader market context. |
| Can be used as a confirmation signal for trend reversals and trend continuations. | May appear after a large price move, increasing the risk of entering too late. |
| Helps traders recognize shifts in market sentiment quickly. | Strong momentum does not guarantee that the move will continue. |
| Combines well with supply and demand zones, support and resistance levels, and trend lines. | Performance can vary depending on market conditions and timeframes. |
| Can be incorporated into both day trading and swing trading strategies. | Requires proper risk management because even high-quality setups can fail. |
| Reflects strong conviction from buyers or sellers, making it useful for momentum analysis. | Institutional activity cannot be confirmed solely from the appearance of the candle. |
The biggest strength of the Marubozu pattern is its ability to highlight strong market momentum.
However, like any candlestick pattern, it should not be used as a standalone trading strategy. Combining it with market structure, key levels, trend analysis, and sound risk management can help improve its effectiveness.
Common Mistakes Traders Make When Trading the Marubozu Pattern
The Marubozu candlestick can be a powerful signal of market momentum, but many traders misuse it. Below are three common mistakes that can reduce the effectiveness of this pattern and lead to unnecessary losses.
1. Treating the Marubozu as a Standalone Trading Strategy
One of the biggest mistakes traders make is assuming that a Marubozu candle is a complete trading system by itself.
While the pattern can reveal strong buying or selling pressure, it does not tell you where the market is likely to reverse, continue, or encounter significant support and resistance.
As a result, taking every Marubozu signal without considering the broader market context can lead to poor trading decisions.
Instead, use the pattern as a confirmation tool alongside other forms of technical analysis such as supply and demand zones, support and resistance levels, trend lines, market structure, or moving averages.
The strongest trading opportunities often occur when multiple factors align with the Marubozu signal.
2. Trading Oversized Marubozu Candles
Another common mistake is entering a trade after an unusually large Marubozu candle has already made an extended move.
Although these candles can look impressive, they often require wider stop losses because of their large size. At the same time, the remaining distance to the next support or resistance level may be limited.
This creates an unfavorable risk-to-reward ratio where traders are risking a large amount to potentially make a relatively small profit.
Before entering any trade, always evaluate whether the potential reward justifies the risk. A great-looking candlestick pattern is not enough if the trade offers poor risk-to-reward characteristics.
3. Entering Before the Marubozu Candle Closes
Many traders become excited when they see a candle growing rapidly and assume it will close as a Marubozu.
However, a candlestick pattern is not complete until the candle has fully closed.
A candle that appears to be a perfect Marubozu halfway through the session can later develop a large upper shadow, a large lower shadow, or both. Once this happens, it may no longer qualify as a valid Marubozu pattern.
By entering too early, traders risk making decisions based on a pattern that does not actually exist when the session ends.
A simple solution is to wait for the candle to close before evaluating the setup. Patience can help prevent unnecessary losses and ensure that you are trading the pattern you intended to trade.
The goal is not to trade every Marubozu candle that appears on a chart. The goal is to focus on high-quality setups that occur in the right market context and offer a favorable risk-to-reward opportunity.
Conclusion
The Marubozu candlestick pattern is a powerful sign of strong buying or selling momentum. Its large body and minimal shadows show that one side of the market was in control throughout the trading session.
While the pattern can help identify potential reversals, breakouts, and trend continuations, it should not be traded on its own.
The best setups usually occur when the Marubozu aligns with supply and demand zones, support and resistance levels, trend lines, or other technical analysis tools.
Rather than trading every Marubozu candle you find, focus on high-quality setups with solid risk management and a favorable risk-to-reward ratio.
Frequently Asked Questions About the Marubozu Candlestick Pattern
What is the success rate of the Marubozu pattern?
There is no fixed success rate for the Marubozu pattern because its performance depends on factors such as market conditions, timeframe, and how it is used.
Traders generally achieve better results when they combine the pattern with other forms of technical analysis, such as support and resistance, supply and demand zones, trend lines, or volume analysis. Like any trading signal, the Marubozu can produce both winning and losing trades.
Is a white Marubozu bearish or bullish?
A white Marubozu is considered a bullish candlestick pattern. It forms when the closing price is significantly higher than the opening price, creating a strong bullish body with little to no shadows.
The pattern indicates strong buying pressure and suggests that buyers were in control throughout the trading session.
Does the color of a Marubozu pattern matter?
Yes, the color helps traders quickly identify whether buyers or sellers were in control. A green or white Marubozu is bullish because it closes above the opening price, while a red or black Marubozu is bearish because it closes below the opening price.
However, the exact colors may vary depending on your chart settings. What matters most is the relationship between the opening and closing prices.
What does the Marubozu candlestick pattern tell you?
The Marubozu pattern tells traders that one side of the market dominated the trading session. A bullish Marubozu signals strong buying pressure, while a bearish Marubozu signals strong selling pressure.
Because the candle has little to no shadows, it suggests that buyers or sellers remained in control from the opening price to the closing price, making it a useful indicator of market momentum.









I’ve heard about the Marubozu, but I never fully understood it until I read your wonderful piece of insight. Thank you so much. I’m looking forward to reading dive deep into your other Forex Trading materials.